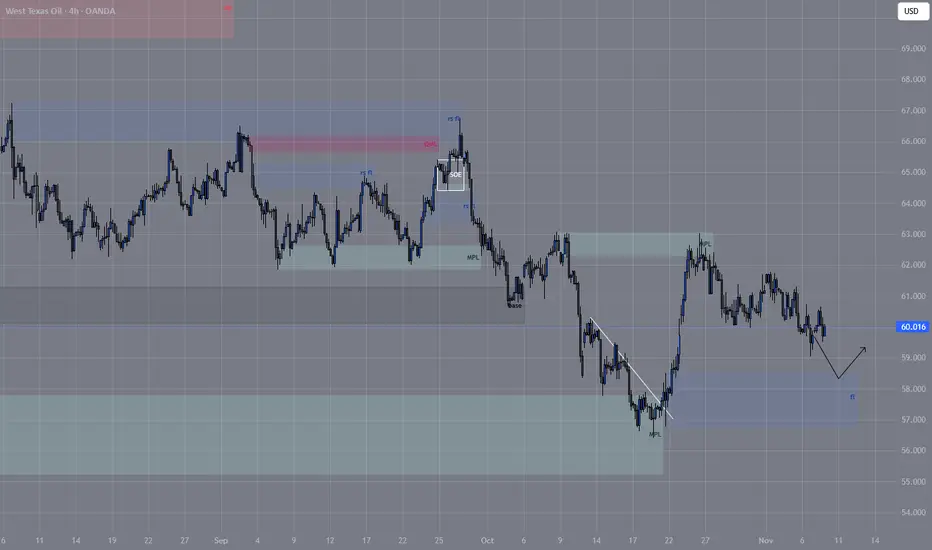
Oil price continues to declineAccording to the previous analysis, the price hit the mpl range and we are witnessing a continuation of the downtrend. We can expect the price to reach the specified fl range.
Trade ideas
Crude oil: test the upside potentialAfter completing the consolidation and foundation-building phase yesterday, crude oil has maintained a fluctuating upward trend today.
We will continue to monitor the strength and effectiveness of the rebound. Based on the momentum of the consolidation, crude oil should be able to extend its gains today. If the momentum is strong, it could reach around 61. Therefore, from a short-term perspective, we can still take long positions to test the upside potential.
Buy 58.8 - 59.3
SL 58.3
TP 59.8 - 60.3 - 61
Sell 61 - 60.5
SL 61.5
TP 59.5 - 59 - 58.5

WTI Crude Oil: Is a New Super-Cycle About to Ignite?WTI may be approaching one of its most important turning points in years. The long correction from the 2022 high appears complete, and multiple technical frameworks now align to signal a potential new bullish cycle.
Price remains supported on the 3/1 Gann angle on the monthly chart. A monthly close above $70 opens the first breakout phase, while a break above $130 would confirm a new multi-year advance. Gann cycle timing highlights 2027, 2029, and 2031 as major future peak windows.
The weekly trend remains firm above the $55.15 structural low, reinforcing the April 2025 cycle bottom. Elliott Wave counts show a clean 5-wave rally into 2022, followed by an ABC correction into 2025, which strongly suggests the market has reset.
If momentum builds, WTI could target new all-time highs, with potential to stretch toward the $200 region in the next major cycle.
Vital Direction sees oil entering a phase where long-term opportunity may outweigh risk, with breakout levels clearly defined.

The Imminent U.S.–Iran Crisis: A Real-Time Analytical AssessmentDate of Analysis: Friday, November 7, 2025
Overview
The following is a condensed version of a dynamic strategic discussion between an intelligent user and an AI assistant. The analysis aimed to decode the hidden layers of a potentially imminent military crisis in the Middle East through real-time observation of geopolitical developments.
Introduction: Initial Hypothesis and the Major Shift
The analysis initially rested on the assumption that following the “12-Day War” (June 2025), the region was in a fragile ceasefire. The central question was when the “second round” of conflict might begin. It was correctly identified that Israel’s main constraint was a shortage of defensive missiles.
Turning Point:
Assuming four months had passed since the first war, it was concluded that the logistical bottleneck (missile defense shortage) had likely been resolved. This invalidated earlier timelines predicting renewed conflict by December and instead shifted the danger window to November—the current month.
Part I: The Strategic Deception (Iraq and Venezuela as Cover)
Attention then turned to a wave of simultaneous “crisis signals”: rising talk of “a U.S. conflict with Venezuela” and “U.S. warnings to Iraq.”
Assessment:
These were identified as elements of a classic deception operation, intended to divert the attention of the media, diplomats, and, most importantly, Iran’s intelligence and defense systems away from the real target. This served as a perfect cover for preparing a strike on Iran.
Part II: Breakdown of the Deception and Loss of Surprise
Key Insight (User’s Observation):
The user correctly noted that this deception had failed. With “war with Iran” trending again in global media and official warnings escalating, Iran was no longer complacent—it had entered maximum alert.
This fundamentally changed the dynamics. The element of surprise, the attacker’s greatest asset, was now entirely lost.
Part III: The “Forced Hand” Scenario
When surprise evaporates, what can the attacker (the U.S. and Israel) do next?
Analysis:
The attacker is now trapped in a strategic stalemate:
Cost of Attrition: Maintaining full-scale military readiness for both sides is expensive, stressful, and unsustainable.
Risk of Delay: Every passing hour allows Iran to disperse and conceal its strategic assets (missiles, drones), making target acquisition harder.
Point of No Return: The use of Venezuela and Iraq as covers was the equivalent of cocking a rifle—any retreat now would amount to a catastrophic strategic humiliation for the U.S.
Time-Based Conclusion:
Since the deception failed and surprise is gone, the attacker is effectively compelled to act. They must launch the attack before their forces degrade further and before Iran becomes even more fortified.
New Urgent Window: Within 24 to 72 hours (this very weekend).
Part IV: The Hidden Economics of War — Why “Crisis” Becomes a “Solution”
In the final stage, the focus shifted from “when” to “why”, exploring the economic motives driving the potential escalation. The analysis suggested that this war could serve as a planned economic reset to address U.S. domestic challenges.
Global Economic Shock:
The immediate aftermath of an attack would be a spike in oil prices (estimated to surpass $150 per barrel within 24 hours) due to disruptions in the Strait of Hormuz and Iranian retaliation—triggering global stagflation.
Dollar Strength (Flight to Safety):
During such turmoil, global investors would flee risky assets (like crypto, which had already pre-priced a downturn) and rush into U.S. dollars, causing the DXY index to surge.
Domestic Political and Economic Diversion (Wag the Dog Effect):
This crisis would allow the U.S. government to:
Deflect attention from domestic debt and weak economic indicators (e.g., PMI and recession risks).
Reignite the military-industrial complex, boosting GDP through massive arms sales to regional allies and internal consumption.
Justify inflation by attributing it to “geopolitical instability and rising oil prices” rather than past monetary policies.

WTI Crude upside resistance at 6160The WTI Crude Oil is currently trading with a bearish bias, aligned with the broader downward trend. Recent price action shows a retest of the longer term support, suggesting a temporary relief rally within the downtrend.
Key resistance is located at 6160, a prior consolidation zone. This level will be critical in determining the next directional move.
A bearish rejection from 6160 could confirm the resumption of the downtrend, targeting the next support levels at 5946, followed by 5845 and 5780 over a longer timeframe.
Conversely, a decisive breakout and daily close above 6160 would invalidate the current bearish setup, shifting sentiment to bullish and potentially triggering a move towards 6215, then 6300.
Conclusion:
The short-term outlook remains bearish unless the WTI Crude price breaks and holds above 6160. Traders should watch for price action signals around this key level to confirm direction. A rejection favours fresh downside continuation, while a breakout signals a potential trend reversal or deeper correction.
This communication is for informational purposes only and should not be viewed as any form of recommendation as to a particular course of action or as investment advice. It is not intended as an offer or solicitation for the purchase or sale of any financial instrument or as an official confirmation of any transaction. Opinions, estimates and assumptions expressed herein are made as of the date of this communication and are subject to change without notice. This communication has been prepared based upon information, including market prices, data and other information, believed to be reliable; however, Trade Nation does not warrant its completeness or accuracy. All market prices and market data contained in or attached to this communication are indicative and subject to change without notice.

Crude Oil Trading Strategy for TodayShort-term weaknesses have become more prominent, while the stabilizing role of crude oil has intensified.
The fluctuation in renewable energy output and the surge in demand for crude oil replenishment
In November, the world experienced extreme weather: The cold wave in Europe led to a 27% drop in wind power output (wind power generation in Germany and France decreased by 32% year-on-year), the Asian typhoon season delayed the progress of photovoltaic installation (new installations in November decreased by 35% year-on-year), and the power supply gap was forced to rely on crude oil to be filled. The fuel oil generation in the United States increased by 29% year-on-year (reaching a new high since 2024), the sales of diesel generators in Europe increased by 22% month-on-month, and the proportion of "replenishment demand" in short-term crude oil consumption accounted for 18%, verifying the irreplaceability of crude oil in energy security.
The cost of biofuels is high, and the substitution effect has significantly weakened
The prices of global palm oil and soybean oil rose by 21%-25% due to drought in Southeast Asia, the production cost of biodiesel exceeded $88 per barrel, far exceeding the current crude oil price. The production of biodiesel in the United States decreased by 15% month-on-month, and the blending ratio of biofuels in Europe dropped from 8% to 6.5%. More importantly, the supply of biofuel raw materials is limited (global vegetable oil inventory decreased by 9%), and it is difficult to expand the scale of substitution with crude oil in the short term, and the share of crude oil in the transportation fuel sector has been consolidated.
Crude Oil Trading Strategy for Today
buy:59.5-60
tp:60.5-601
sl:59

Market Analysis: WTI Crude Faces HurdlesMarket Analysis: WTI Crude Faces Hurdles
Crude oil is showing bearish signs and might decline below $58.80.
Important Takeaways for WTI Crude Oil Price Analysis Today
- Crude oil prices failed to clear the $61.20 region and started a fresh decline.
- There is a bearish trend line forming with resistance at $60.00 on the hourly chart of XTI/USD.
WTI Crude Oil Price Technical Analysis
On the hourly chart of WTI Crude Oil, the price struggled to clear $61.20 against the US Dollar. The price started a fresh decline below $60.00.
The bears gained strength and pushed the price below $59.50 and the 50-hour simple moving average. Finally, the price tested $58.80 and recently started a recovery wave. There was a move above $59.40, and the 23.6% Fib retracement level of the downward move from the $61.21 swing high to the $58.80 low.
The bears are now active below $59.80. If there is a fresh increase, the price could face a barrier near $60.00. There is also a bearish trend line forming with resistance at $60.00.
The first major resistance is near the 76.4% Fib retracement at $60.65. The next stop for the bulls could be near $61.20. Any more gains might send the price toward $62.00. Conversely, the price might start another decline and test $59.40.
The next major area of interest for the bulls on the WTI crude oil chart is $58.80. If there is a downside break, the price might decline toward $57.50. Any more losses may perhaps open the doors for a move toward $55.00.
This article represents the opinion of the Companies operating under the FXOpen brand only. It is not to be construed as an offer, solicitation, or recommendation with respect to products and services provided by the Companies operating under the FXOpen brand, nor is it to be considered financial advice.

Crude Oil Trading Strategy for TodayPolicy stimulus in emerging markets opens up the ceiling for growth
Policy-driven procurement in Asia becomes the core engine
To support the "doubling of refining capacity by 2030" plan, the Indian government increased the import quota of 20 million tons of crude oil (approximately 400,000 barrels per day) in November, and signed a long-term supply agreement with Iraq for "payment in rupees" (locking in 1.2 million barrels per day). In the first half of November, India's crude oil import volume increased by 18% year-on-year (reaching 5.6 million barrels per day), reaching a historical high. At the same time, Southeast Asian countries also stepped up their efforts: the Renze refinery in Vietnam (14 million tons per year) officially started production in December, driving a 22% increase in crude oil procurement volume in November compared to the previous month. Indonesia launched the "refinery tax refund policy", increasing processing profits by $8 per barrel, promoting the early release of replenishment demands from refining and chemical enterprises. The overall increase in Asian crude oil imports accounted for 75% of the global demand increase, becoming a core support for short-term demand.
"Discrepancy growth" in transportation and chemical demand
Unlike the decline in transportation fuel demand in Europe and the United States (U.S. gasoline consumption decreased by 2.1% year-on-year), the transportation fuel demand in emerging markets maintained a high growth rate: Indian diesel consumption increased by 7.8% due to infrastructure investment (road and port projects increased by 28% year-on-year), and the demand for aviation kerosene in Southeast Asia increased by 11% month-on-month due to the recovery of tourism (international flight volume recovered to 115% of 2019). More importantly, chemical demand formed a "secondary support" - China's new 1.5 million tons of ethylene plant started production in November, and the purchase volume of naphtha increased by 12% year-on-year; the integrated refining and chemical project of Reliance Industries (25 million tons per year) started raw material reserves, driving a 15% increase in the purchase volume of light crude oil (WTI-related varieties) compared to the previous month, forming a dual demand resilience of "transportation + chemical".
Crude Oil Trading Strategy for Today
buy:59.5-60
tp:60.5-601
sl:59

Expanding triangle and support breakoutThe price broke out of an expanding triangle, followed by a pullback, which was also a fake out, now the price has made a lower low and looks to short
WE ONLY TRADE PULLBACKS
Comment your thoughts

Hellena | Oil (4H): LONG to resistance area 64.8.Colleagues, in fact, I have not changed the wave markup, but I have a slightly different view on the near-term price movement plan.
In the last forecast I emphasized that the target is the area of 58.9, but now it looks more likely that the completion of wave “C” in a complex correction (resistance area 64.8). Then I will consider the long-awaited downward movement again.
Manage your capital correctly and competently! Only enter trades based on reliable patterns!

USOIL SUPPORT, RESISTANCE & TRENDLINE ANALYSISGo "SHORT" IF IT BREAKS 59.63 with 59.32 / 59.01 and 58.70 as the 1st, 2nd & 3rd targets respectively. It should break and sustain each level to reach the above mentioned targets.
Go "LONG" if it breaks 59.63 with 59.94 / 60.01 / 60.69 & 61.41 as the 1st, 2nd, 3rd & 4th targets respectively. It should break and sustain each level to reach the above mentioned targets.
Note: Check for candle patterns as well for proper confirmation.

Crude Oil Trading Strategy for TodayGeopolitical Risks: Structural imbalances persist, with short-term disturbances being the main factor
The conflict between Russia and Ukraine has entered its fourth year. Russia's crude oil has doubled its share in the Asian market through the "shadow fleet" (487 vessels) and Indian refineries (processing 1.8 million barrels per day), with the price difference between Urals and Brent narrowing to $15 per barrel. The pulse-like impact of the conflict on oil prices has weakened, but there is still a possibility of a "black swan" event - if Russian energy facilities are attacked, it could lead to a 2-3 million barrels per day supply gap, and oil prices could exceed $150. Additionally, the advancement of the Gaza ceasefire agreement and the restoration of shipping order in the Red Sea have reduced the short-term geopolitical premium, but potential risks such as the situation in the Middle East and Iran sanctions have not been eliminated, which may trigger short-term price fluctuations.
The core contradiction in the current crude oil market is the "mid-term supply surplus" versus "short-term marginal improvement (demand differentiation + interest rate cut expectations + geopolitical disturbances)". The price of $59.50 is in the "bottom support zone + policy sensitive zone", making it suitable to adopt a combination strategy of "short-term catching rebounds, medium-term controlling risks" - using short-term marginal variables to earn short-term gains, while hedging the downward risks brought by the medium-term surplus through option tools.
Crude Oil Trading Strategy for Today
buy:59-59.5
tp:60-60.5
sl:58.5

WTI – Bearish Retest of Broken SupportWTI has broken below a key support zone (highlighted in purple) and is currently pulling back into this same zone.
This area may now act as new resistance.
If price rejects this zone, we may see continuation toward the next major support level around 57.93.
The overall momentum is bearish, and the current upward leg looks corrective rather than impulsive, which supports the continuation scenario.
Trade Plan:
• Entry: After rejection signs inside the purple zone
• Stop Loss: Above the purple zone / recent swing high
• Take Profit: 57.93 area (blue level)
Bias:
Bearish continuation as long as price remains below the purple zone.
Logic:
This is a classic break → pullback → continuation structure.
If price fails to close back above this zone, sellers remain in control and the next bearish leg can unfold toward 57.93.

Crude oil's downward space is expandingDue to a significant increase in U.S. crude oil inventories, WTI prices have extended their decline.
In the short term, crude oil’s trend saw a seesaw battle between bulls and bears near the lower edge of the range, with frequent shifts in momentum. Eventually, the bears prevailed, sending prices lower. The moving averages are in a bearish alignment, indicating an objectively downward short-term trend.
Oil prices have broken below the 60 support level. It is expected that crude oil’s intraday trend will continue to expand downward. And the short-term support is 58.5,If it breaks below 58.5, focus on the support level at 57.5, while resistance above is at 60.8.
Buy 58.5 - 58.8
SL 58
TP 59.3 - 59.8 - 60.3
Sell 60.5 - 60
SL 61
TP 59 - 58.5 - 58

Crude Oil Trading Strategy for TodayIncreased policy stimulus in emerging markets, with greater certainty in the increase in demand.
Policy-driven procurement emerges as a new engine: The Indian government, in order to ensure the expansion of refineries (with an additional annual capacity of 20 million tons by 2025), launched the "Strategic Reserve Supplement Plan for Crude Oil". In the first half of November, the import volume increased by 16% year-on-year (reaching 5.4 million barrels per day), and it signed a 3-year long-term supply agreement with Saudi Arabia (locking an additional 1 million barrels per day). At the same time, Indonesia and Vietnam simultaneously introduced "Refinery Tax Reduction Policies", driving the import volume of crude oil in Southeast Asia to increase by 12% month-on-month. The policy benefits directly transformed into rigid procurement demands, breaking the single narrative of "weak demand".
Recovery of consumption scenarios exceeded expectations: Indian diesel consumption increased by 7.2% due to the acceleration of infrastructure investment (road and port projects increased by 25% year-on-year), while the demand for aviation kerosene in Southeast Asia increased by 9% month-on-month due to the recovery of tourism (international flight volume recovered to 110% of 2019). The demand for transportation fuels and chemical raw materials (with the commissioning of a new 1.2 million-ton ethylene plant in China) formed a "dual-wheel drive", and the expected monthly increase in global crude oil demand in November was 800,000 barrels per day, far exceeding the market expectation of 500,000 barrels per day.
Crude Oil Trading Strategy for Today
buy:59.5-60
tp:60.5-61
sl:61.5

Oil analysisAfter oil dropped to 56 dollars per barrel, it managed to climb back up to 62 dollars and hit a resistance there, and at the moment it has reached 59 dollars.
If it can break the support it is currently reacting to, a risky position down to 57.800 could be taken.
At this moment, besides this scenario, I don’t see any other opportunity until the chart gives a bullish signal.

Crude Oil Trading Strategy for TodayThe resonance of the three core driving forces opens up the space for a rebound.
The global economy is experiencing a weak recovery, with demand resilience exceeding pessimistic expectations: Despite the IEA's downward revision of demand growth for 2025-2026, the global economy has not fallen into recession. In the third quarter, crude oil demand has grown by an average of 750,000 barrels per day, with the rebound in demand for petrochemical feedstocks being a key support, breaking the market consensus of "persistent weak demand".
The cost structure of US shale oil is moving upward: Data from the analysis firm Enverus shows that due to the depletion of high-quality resources and the complexity of the extraction areas, the marginal cost of US shale oil is gradually rising from about $70 per barrel. Most small and medium-sized producers need an oil price of over $65 to make a profit on new well projects, while only large-scale enterprises can maintain a break-even point in the $50-60 range. The current oil price is approaching the cost line, and further declines will curb supply growth, forming a natural bottom support.
Net long positions have risen significantly: The latest CFTC position data shows that Brent crude oil long positions increased by 57,000 contracts, short positions decreased by 62,000 contracts, and net long positions rose by 119,000 contracts compared to the previous period. Market sentiment has shifted from extreme pessimism to a bottoming out and rebound, with continued inflows of new buying supporting oil prices.
Crude Oil Trading Strategy for Today
buy:59.5-60
tp:60.5-61
sl:61.5

wti 1h🔹 Overall Outlook and Potential Price Movements
In the charts above, we have outlined the overall outlook and possible price movement paths.
As shown, each analysis highlights a key support or resistance zone near the current market price. The market’s reaction to these zones — whether a breakout or rejection — will likely determine the next direction of the price toward the specified levels.
⚠️ Important Note:
The purpose of these trading perspectives is to identify key upcoming price levels and assess potential market reactions. The provided analyses are not trading signals in any way.
✅ Recommendation for Use:
To make effective use of these analyses, it is advised to manually draw the marked zones on your chart. Then, on the 5-minute time frame, monitor the candlestick behavior and look for valid entry triggers before making any trading decisions.

Crude Oil Trading Strategy for TodayMarginal improvement signals have emerged, and consumer resilience exceeded expectations.
The demand for replenishment in Asia has been concentratedly released: In November, China's petrochemical refineries received an additional 15 million tons of crude oil import quotas (approximately 300,000 barrels per day). In the first half of November, China's crude oil imports increased by 12% year-on-year, and the purchasing focus shifted to WTI-related varieties, which led to an increase in U.S. crude oil export volume from 5.4 million barrels per day to 5.8 million barrels per day (reaching a new high since October), forming a "import - export" positive cycle.
Heating oil demand started earlier than expected: In the first ten days of November in North America, the temperature was 3-5℃ lower than the average. The price of heating oil futures in the New York port rose by 4.2% in a week, and the output of heating oil by refineries increased by 8% month-on-month, which led to the continuous reduction of distillate oil inventories and indirectly stimulated the demand for crude oil purchases.
Crude Oil Trading Strategy for Today
buy:59.5-60
tp:60.5-61
sl:61.5

WTI OIL 4H Channel Down aiming for a Lower Low.WTI Oil (USOIL) is extending the 1D MA50 (red trend-line) rejection of October 24 and has formed a short-term Channel Down. We are currently on its second Bearish Leg following a new rejection this time on the 4H MA200 (orange trend-line).
With the first Bearish Leg declining by -4.72%, we expect the current one to replicate this drop and target $58.60.
-------------------------------------------------------------------------------
** Please LIKE 👍, FOLLOW ✅, SHARE 🙌 and COMMENT ✍ if you enjoy this idea! Also share your ideas and charts in the comments section below! This is best way to keep it relevant, support us, keep the content here free and allow the idea to reach as many people as possible. **
-------------------------------------------------------------------------------
💸💸💸💸💸💸
👇 👇 👇 👇 👇 👇

USOIL LOCAL LONG|
✅WTI OIL is expected to bounce from the demand level near $60.00, targeting the $60.70 resistance zone as bullish momentum builds. Time Frame 3H.
LONG🚀
✅Like and subscribe to never miss a new idea!✅

WTI Crude resistance at 6160The WTI Crude Oil is currently trading with a bearish bias, aligned with the broader downward trend. Recent price action shows a retest of the longer term support, suggesting a temporary relief rally within the downtrend.
Key resistance is located at 6160, a prior consolidation zone. This level will be critical in determining the next directional move.
A bearish rejection from 6160 could confirm the resumption of the downtrend, targeting the next support levels at 5946, followed by 5845 and 5780 over a longer timeframe.
Conversely, a decisive breakout and daily close above 6160 would invalidate the current bearish setup, shifting sentiment to bullish and potentially triggering a move towards 6215, then 6300.
Conclusion:
The short-term outlook remains bearish unless the WTI Crude price breaks and holds above 6160. Traders should watch for price action signals around this key level to confirm direction. A rejection favours fresh downside continuation, while a breakout signals a potential trend reversal or deeper correction.
This communication is for informational purposes only and should not be viewed as any form of recommendation as to a particular course of action or as investment advice. It is not intended as an offer or solicitation for the purchase or sale of any financial instrument or as an official confirmation of any transaction. Opinions, estimates and assumptions expressed herein are made as of the date of this communication and are subject to change without notice. This communication has been prepared based upon information, including market prices, data and other information, believed to be reliable; however, Trade Nation does not warrant its completeness or accuracy. All market prices and market data contained in or attached to this communication are indicative and subject to change without notice.

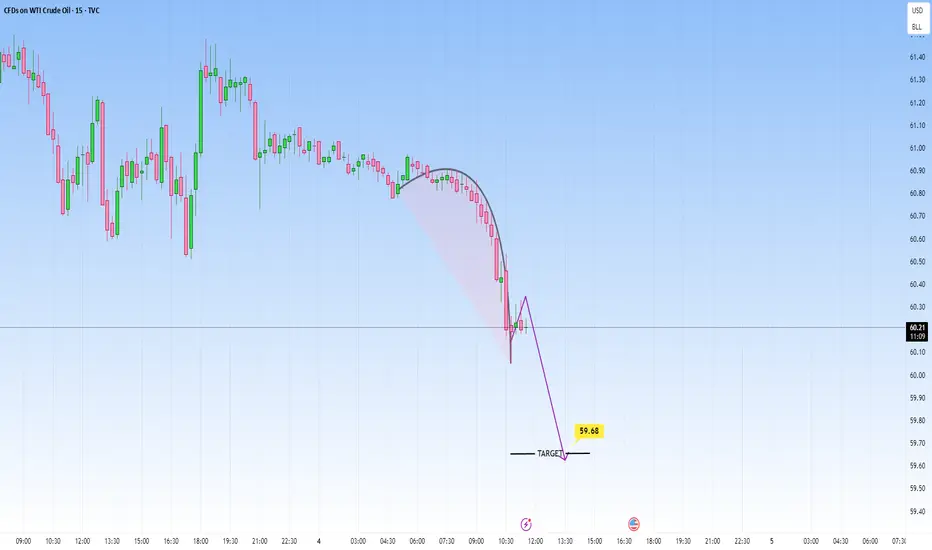
USOIL: Slow Continuation to the downside LikelyIn this short-term view, price is forming a rounded kind of top. The structure broke to the downside with more volume.
We could see another leg lower, targeting around 59.65.