Hellena | Oil (4H): SHORT to support area of 59.00.Colleagues, the situation is complicated, but I still expect the price to renew the local low of 56.40.
It looks like the price is forming a complex compound correction (WXY) and I think that for now it is worth looking at the 59.00 area as the nearest most likely level.
Ideally, I would like to see the completion of wave “C” in the area of 64.80.
Fundamental context
According to the latest IEA report, the global oil market remains under pressure as supply continues to outpace demand. For 2025, production is expected to rise by around 3 million barrels per day, while demand growth is forecast at only 0.7 million barrels. This imbalance increases the risk of oversupply and inventory buildup across key regions.
Manage your capital correctly and competently! Only enter trades based on reliable patterns!
Trade ideas

Bullish bounce off?WTI Oil (XTI/USD) has bounced off the pivot, which has been identified as a pullback suport and could potentially rise to the 1st resistance.
Pivot: 60.13
1st Support: 58.86
1st Resistance: 63.19
Disclaimer:
The above opinions given constitute general market commentary, and do not constitute the opinion or advice of IC Markets or any form of personal or investment advice.
Any opinions, news, research, analyses, prices, other information, or links to third-party sites contained on this website are provided on an "as-is" basis, are intended only to be informative, is not an advice nor a recommendation, nor research, or a record of our trading prices, or an offer of, or solicitation for a transaction in any financial instrument and thus should not be treated as such. The information provided does not involve any specific investment objectives, financial situation and needs of any specific person who may receive it. Please be aware, that past performance is not a reliable indicator of future performance and/or results. Past Performance or Forward-looking scenarios based upon the reasonable beliefs of the third-party provider are not a guarantee of future performance. Actual results may differ materially from those anticipated in forward-looking or past performance statements. IC Markets makes no representation or warranty and assumes no liability as to the accuracy or completeness of the information provided, nor any loss arising from any investment based on a recommendation, forecast or any information supplied by any third-party.

Short-term bullish core logic: 3 immediate signals resonatePolicy aspect: OPEC+ halts production increase takes effect, $60 defense line is firmly established
On November 3rd, OPEC+ officially announced a 2026 first-quarter production pause, with only a 12-month maintenance increase of 137,000 barrels per day. This decision precisely hedged against the "2 million barrels per day supply surplus in the first quarter" risk warned by IEA. Historical data shows that when OPEC+ voluntarily curbs production during the demand slack period, oil prices often receive a policy support premium of 1-2 weeks. Currently, $60.91 is at the stabilization stage after policy support, and $60, as the marginal cost line for US shale oil, forms a double support.
Inventory aspect: Unexpected continuous inventory reduction, demand resilience exceeds expectations
As of the week ending October 24th, US commercial crude oil inventories dropped by 6.86 million barrels (expected only a 200,000 barrel reduction), gasoline and distillate inventories decreased by 5.94 million barrels and 3.36 million barrels respectively, and all three oil product inventories were below the five-year average by 3%-8%. Although the inventory in the Cushing region increased by 1.334 million barrels month-on-month, the overall commercial inventory has cumulatively decreased by 15.9 million barrels, coupled with the import volume dropping to a 2021 low (510 million barrels per day), the short-term supply-demand tight balance pattern has not changed, providing substantial support for oil prices.
Technical aspect: Bottom formation begins, rebound momentum starts
$60.91 is at the upper edge of the "56.93-61.65" oscillation range, the daily line presents a "hammer pattern + bullish engulfing" combination pattern, and since late October, a clear bottom reversal signal has been formed;
Momentum indicators improve simultaneously: RSI has rebounded from the oversold range to 41, the MACD red bar begins to expand, and after the price stabilizes at the $60 key level, speculative long positions have returned 38,000 contracts in a week, the financial support has strengthened.
Crude Oil Trading Strategy for Today
sell:61-61.5
tp:60.5-60
sl:62
Crude oil barrel priced at $300?Don't be surprised if we eventually see the crude oil barrel priced at $300.
I sure won't!

Crude Oil Trading Strategy for TodayThe cooling of inflation data strengthens the logic of a rate cut.
The core PCE price index in the United States rose by 2.8% year-on-year in October (lower than the expected 3.0%), reaching a new low since March 2023 and remaining below 3% for three consecutive months, confirming that inflation is approaching the Fed's 2% target. The probability of a 25BP rate cut in December has risen from 65% to 82%, and the cumulative rate cut expectation for 2026 has reached 125BP. In a liquidity-lean environment, the valuation attractiveness of crude oil as a risky asset has significantly increased - historical data shows that the average increase in WTI oil prices during the rate-cut cycle is 12%-15%, and the current price of $61.21 is still in the early stage of valuation recovery.
The US dollar index is under pressure, and the expectation of non-US demand release is expected.
The US dollar index has fallen by 3.2% from its October high and is currently stabilizing below the 92.5 mark. The purchasing power of non-US currencies has rebounded. The purchasing costs of oil-importing countries such as India and China have decreased. In November, India's oil imports are expected to increase by 6% month-on-month (to 5.2 million barrels per day), and China's refineries have received new quotas in November (an additional 12 million tons), and the policy-driven replenishment demand will directly support oil purchases, forming a positive cycle of "weak US dollar - increased purchases - oil price rise".
Crude Oil Trading Strategy for Today
buy:60.5-61
tp:61.5-62
sl:60

Crude Oil Trading Strategy for TodayU.S. crude oil inventories have exceeded expectations for three consecutive weeks of decline, easing the pressure in Cushing.
The latest EIA data (as of the week ending November 1) shows that U.S. crude oil inventories decreased by 5.8 million barrels on a month-on-month basis (expected - 2.2 million barrels), with the scale of decline in the past three weeks exceeding market expectations, and a cumulative reduction of 12.6 million barrels. The core Cushing region's inventories ended the previous four weeks of consecutive increases and decreased by 1.2 million barrels on a month-on-month basis (to 35 million barrels, 8% lower than the 5-year average), shifting from "accumulation pressure" to "tight balance". This data directly dispelled market concerns about "more than 2 million barrels per day of accumulation in the fourth quarter", and $61 became the strong bottom range supported by inventories.
Global major consumption areas' inventories have improved simultaneously, verifying the resilience of demand
European ARA region's crude oil inventories dropped to 43 million barrels (a 12% year-on-year decrease), China's commercial crude oil inventories decreased by 3.5 million barrels on a month-on-month basis (with the start of refinery replenishment demand), and Japan's crude oil inventories also decreased by 5% compared to the previous month. Global major consumption areas' inventories have simultaneously declined, confirming that terminal demand is not "unilaterally weak", but rather shows "overall resilience under regional differentiation", providing cross-regional supply and demand support for oil prices.
Crude Oil Trading Strategy for Today
buy:60.8-61
tp:61.8-62.5
sl:60.4

Crude Oil Trading Strategy for TodayPrecise control of production increase pace, directly addressing the pain point of the demand off-season
On November 2nd, the eight core member countries of OPEC + reached a key decision: in December 2025, they will maintain a slight increase of 137,000 barrels per day, but in the first quarter of 2026, they will completely suspend further production increases. This decision precisely hedged against the risk of "a record 4 million barrels per day surplus in 2026" as warned by the IEA. By freezing the supply increase in the weakest demand quarter (with demand possibly dropping by 2-3 million barrels per day in February and March), it forms a substantive "price protection and stabilization measure". Compared with the previous market concerns about "continuous production increase", the policy shift brought about a difference in expectations, providing strong support for oil prices. $60 became the implicit bottom line for the OPEC + policy to support the market.
Crude Oil Trading Strategy for Today
buy:60.8-61
tp:61.8-62.5
sl:60.4

WTI Crude Oil | Flag Breakout Faces Macro ResistanceCrude broke out of its short-term flag, but momentum has been softer than expected — a possible hint of a broader consolidation phase. OPEC+’s pause on supply hikes through Q1’26 aligns with surplus projections, but fresh U.S. sanctions on Russia could flip that narrative fast.
Technical Lens:
Price broke above a descending channel, yet upside follow-through stalled beneath the $62–65 resistance band (former breakdown zone). RSI is mid-range near 55, showing balance between buyers and sellers. A larger flag may be forming within the broader $58–65 structure.
Scenarios:
If $65 holds as resistance → price could drift back toward $58–59 support to reset momentum.
If $65 breaks cleanly → opens scope toward the $68–70 handle, aligning with prior supply zone.
Catalysts:
OPEC+ output guidance revisions, U.S. sanctions enforcement on Russian crude, and global demand indicators heading into winter.
Takeaway:
WTI sits in a technical crossroads between breakout continuation and macro restraint — $62–65 remains the decision zone to watch this week.

BUY USOILOur trade for today is on OIL, as you can see, we bought to target the Daily LQ.
Follow for more trades!

USOIL Is Very Bullish! Buy!
Please, check our technical outlook for USOIL.
Time Frame: 6h
Current Trend: Bullish
Sentiment: Oversold (based on 7-period RSI)
Forecast: Bullish
The market is trading around a solid horizontal structure 60.808.
The above observations make me that the market will inevitably achieve 62.277 level.
P.S
Overbought describes a period of time where there has been a significant and consistent upward move in price over a period of time without much pullback.
Like and subscribe and comment my ideas if you enjoy them!

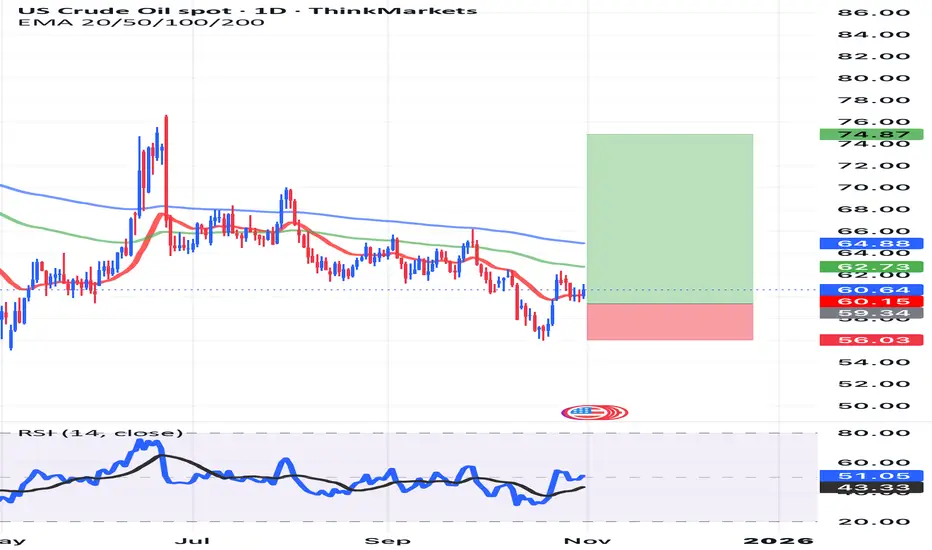
Crude oil review - 03/11/2025Oil prices climbed after OPEC+ announced a modest output hike for next month, followed by a production pause through the first quarter of next year. The move signals the group’s acknowledgment of a growing supply surplus in 2026, despite earlier price declines due to concerns about oversupply. While tighter U.S. sanctions on Russian producers have added some uncertainty to supply forecasts, overall market conditions remain skewed toward excess production. Additional risks include disruptions from a Ukrainian drone strike on a Russian oil facility and political instability in Nigeria, which could affect output and shipping flows.
On the technical side, the crude oil price has retested the major technical resistance at $62 and corrected to the downside since. Currently, the price is testing the resistance of the 50-day simple moving average and the 50% Fibonacci retracement level of the daily range. The Bollinger Bands are still expanded, indicating that volatility in the crude oil market remains high, while the Stochastic oscillator is near extreme overbought levels, suggesting a potential bearish correction in the upcoming sessions. If this becomes reality, the first area of potential support may be seen around the $60 level, which is the psychological support of the round number. The second area of support might be found around $58, which corresponds to the 23.6% Fibonacci retracement level.
Disclaimer: The opinions in this article are personal to the writer and do not reflect those of Exness

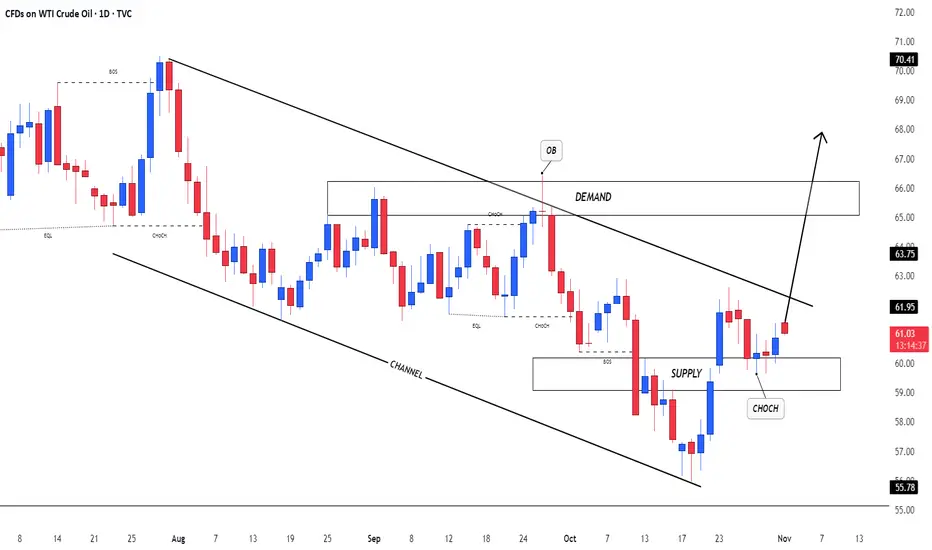
US OilCrude Oil Index
- Bearish Channel as an corrective pattern in Short Time Frame
- RSI - Divergence
- Supply Zone
- Change of Characteristics
- Order Block
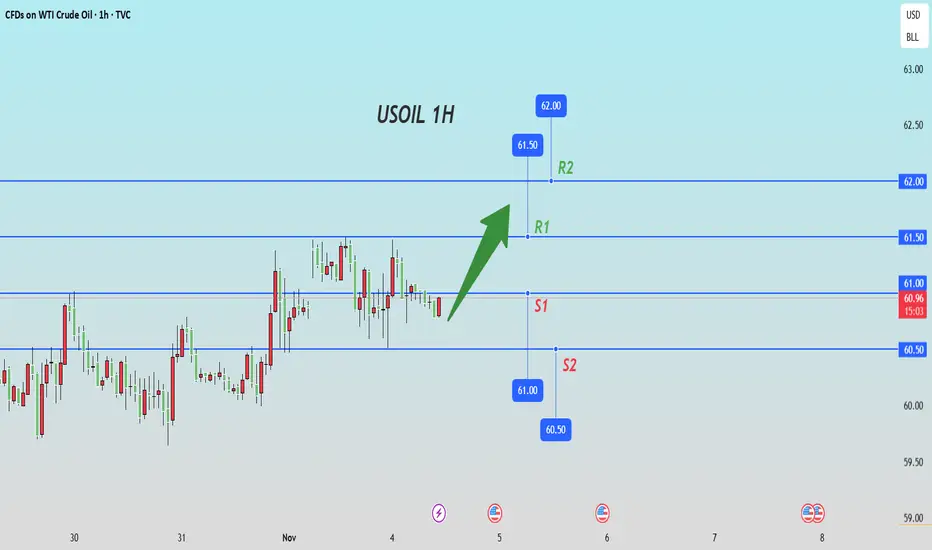
USOIL Symmetrical triangle buying from key support📊 USOIL Update (1H Timeframe)
🟢 Symmetrical Triangle Breakout Setup!
Price holding strong at the key support zone – $60.000 ✅
🎯 Technical Targets:
1️⃣ $60.800
2️⃣ $61.800
3️⃣ $62.400
🧭 Plan:
Looking for buying opportunities from the support zone as long as $60.000 holds.
⚠️ Risk Management is Key!
Always use proper SL and position sizing 🔐
💬 Like ❤️ | Follow 🔔 | Comment 💭 | Share 📢
#USOIL #CrudeOil #WTI #TechnicalAnalysis #PriceAction #ForexTrading #CommodityMarket #TradingSetup

wti 1h🔹 Overall Outlook and Potential Price Movements
In the charts above, we have outlined the overall outlook and possible price movement paths.
As shown, each analysis highlights a key support or resistance zone near the current market price. The market’s reaction to these zones — whether a breakout or rejection — will likely determine the next direction of the price toward the specified levels.
⚠️ Important Note:
The purpose of these trading perspectives is to identify key upcoming price levels and assess potential market reactions. The provided analyses are not trading signals in any way.
✅ Recommendation for Use:
To make effective use of these analyses, it is advised to manually draw the marked zones on your chart. Then, on the 5-minute time frame, monitor the candlestick behavior and look for valid entry triggers before making any trading decisions.

US OILHI GUYS,
We are still selling as illustrated months ago, nothing has changed , no correction on technical just a clean update on sell entries H4, H3 CHART and price patterns for speed on entry

US OILHI GUYS,
US OIL , we are still selling on weekly chart to area of interest as we expect RT DAILY SOON.

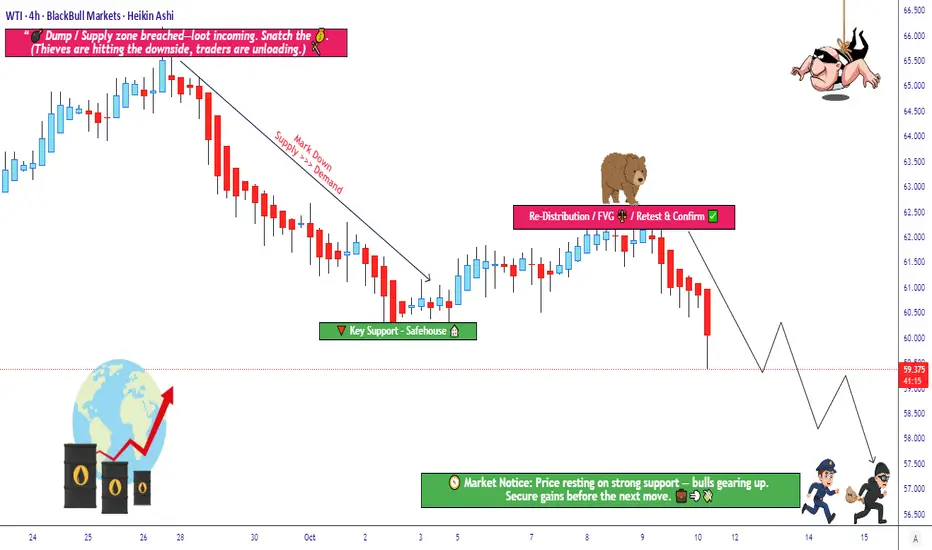
Is Crude Oil Setting Up for a Major Bearish Reversal?🛢️ XTI/USD “WTI” – Bearish Redistribution Zone Incoming (Thief Strategy Inside)
📉 Setup Overview
Market: XTI/USD (WTI crude oil)
Bias: Bearish confirmed — we’re looking for re-distribution / supply pressure to take control
Trade Type: Swing / Day Trade hybrid
🎯 Entry Plan (Thief-Layer Strategy)
I use a layering / multiple limit order approach (aka “Thief Strategy”). You may use any price level as entry, but here’s my preferred ladder:
Sell Limit @ 61.500
Sell Limit @ 61.000
Sell Limit @ 60.500
Sell Limit @ 60.000
Sell Limit @ 59.500
(You may extend more layers if you like)
You don’t need to hit all layers — just get partial fills, ride the move downward.
🚫 Stop Loss
Thief’s SL: 62.500
⚠️ Note to Thief OG’s: I’m not forcing you to follow my SL. You choose what works. Make money, take money — at your own risk.
🎯 Target
We see police barricade as a strong support zone + oversold trap possibility.
So primary target: 57.000
⚠️ Note to Thief OG’s: Don’t blindly hold to my TP. If price gives you your gains early, escape with your money — don’t wait for perfection.
🔍 Related Pairs & Correlations
AMEX:USO or USOIL (oil ETFs / indices) – real-world crude correlation
$BRENT/USD – watch for strength or weakness divergence
AMEX:XOP / AMEX:OIH (oil & gas sector indices) – sentiment in energy names
Key point: if Brent weakens while WTI breaks down, it reinforces the bias.
📌 Key Technical Notes
We’re waiting for ** redistribution / supply zone** to hold — a retest or failure bounce is ideal setup.
Oversold conditions + a “trap” candle (fake breakout) strengthen the move.
Use layering to average in, not “all-in” at once.
Be ready for whipsaws around support zones; partial exits can help.
✨ “If you find value in my analysis, a 👍 and 🚀 boost is much appreciated — it helps me share more setups with the community!”
Disclaimer: This is Thief-style trading strategy just for fun. I am not giving financial advice. Trade at your own decision and risk.
#WTI #CrudeOil #XTIUSD #EnergyTrading #OilStrategy #Layering #SwingTrade #DayTrade #BearishBias #ThiefStrategy
Usoil Daily structure tf
Wave 1/5 has build
Liquidy formed
Bias bullish
Make wait for discount entrry

Expecting decrease in supply by end of yearBased on the current OPEC's report (October 2025) there is an increase in supply.
The supply will be reduced by the end of year.
In relation to the MFE and MAE we are getting closer to MAE.
We're heading to a discount price (ICT)
Add long position below 44USD

USOIL: Short Trading Opportunity
USOIL
- Classic bearish setup
- Our team expects bearish continuation
SUGGESTED TRADE:
Swing Trade
Short USOIL
Entry Point - 60.87
Stop Loss - 61.10
Take Profit - 60.44
Our Risk - 1%
Start protection of your profits from lower levels
Disclosure: I am part of Trade Nation's Influencer program and receive a monthly fee for using their TradingView charts in my analysis.
❤️ Please, support our work with like & comment! ❤️

WTI OIL TECHNICAL OUTLOOK
WTI OIL CLOSING PRICE 60.87$ per barrel
WTI OIL defended price at 56.45 per barrel and found a new weekly support at 59.62$ per barrel.
if oil break out of the descending trendline on its current support from 59.62$ per barrel ,it could hit 66.57$ per barrel resistance roof .
key supply zone 70.32$ per barrel
key supply roof 74,3$ per barrel
WTI FUNDAMENTAL OUTLOOK .
OPEC+ policies continuing with moderate production increases, balancing supply with steady but not surging global demand.
Demand in emerging markets, especially in Asia, remains resilient despite global economic uncertainties.
Geopolitical risks are present but largely priced in, with no immediate large supply disruptions expected.
Inventories and stockpiles are stable, and US shale production remains a key swing factor.
Shifts in energy transition policies and investment in renewables create a backdrop for gradual demand growth for oil, sustaining fundamental support for prices.
US oil inventory levels and the Strategic Petroleum Reserve (SPR) have a significant impact on oil prices, including WTI crude:
US oil inventories represent the stockpiles of crude oil held by commercial entities. When inventories decline, it signals tighter supply, which tends to push oil prices higher. Conversely, rising inventories indicate excess supply, weighing on prices. Recent trends show US commercial crude inventories dropping below seasonal norms, supporting upward pressure on oil prices despite global supply concerns.
The Strategic Petroleum Reserve (SPR) is a government-controlled emergency stockpile. Releases from the SPR increase available supply in the market temporarily, usually putting downward pressure on prices. Conversely, when SPR drawdowns slow or reserves are rebuilt, it diminishes this supply cushion, which can support higher prices. The SPR has been at historically low levels recently following government releases, limiting its impact on immediate weekly inventory reports but remains a key factor in market confidence.
Overall, tight US inventories combined with limited SPR releases create a supply-constrained environment that supports oil prices. However, global supply dynamics, including OPEC+ production targets and non-OPEC supply growth, also play critical balancing roles. Market participants closely monitor US inventory reports and SPR announcements as near-term price catalysts due to their direct impact on available crude supply and market sentiment.
In summary, falling US crude oil inventories generally push WTI prices higher as they signal tighter market supply, while SPR drawdowns or replenishments modulate this effect by adjusting emergency stock availability. Both are key components in oil price dynamics and important for traders and analysts assessing near-term supply-demand balance.
#usoil #wtioil #crude

USOILHow to become successful in forex and stock trading:
1.Master fundamentals and technical analysis.
2.Build and follow a solid trading plan.
3.Apply strict risk management (4–6% rule).
4.Stay disciplined—control fear and greed.
5.Record and analyze every trade.
6.Focus on high-quality setups only.
7.Diversify across assets and markets.
8.Keep evolving—study, adapt, and grow daily.
The attack committee's risk has triggered supply anxietyDirect supply disruption risk: 900,000 barrels/day capacity at risk of zeroing out
The current daily crude oil production in Venezuela is 940,000 barrels (accounting for 0.9% of the global total). Although the absolute scale is limited, as the only OPEC oil-producing country not subject to production quotas, its production capacity has strategic resilience. Actions such as the arrival of US B-1B bombers and the deployment of the "Ford" aircraft carrier strike group in the Caribbean Sea, if escalated to military strikes, the core facilities of PDVSA, such as Lake Maracaibo oil field (accounting for 60% of the capacity) and Jose Port (the only deep-water oil port), will be directly paralyzed. Short-term exports may drop from 900,000 barrels/day to zero, forming a dual supply shock of "sanctions + war".
Replacement supply gap difficult to fill: OPEC+ remaining capacity in crisis
Currently, the total remaining capacity of OPEC+ is only 210,000 barrels/day, and it is concentrated in Saudi Arabia (180,000 barrels/day). If combined with the sanctions on Iran and disruptions in Red Sea transportation, Saudi Arabia needs to increase production by 170,000 barrels/day to fill the gap, which is close to its maximum idle capacity limit. Although US shale oil has potential, due to capital discipline restrictions, the maximum monthly increase in production is only 30,000 barrels/day, far from covering the supply vacuum in Venezuela. The price spread of heavy crude oil (the main type in Venezuela) has expanded from 1.2 US dollars to 1.8 US dollars, and structural tension has emerged.
Market sentiment preview: Risk premium accelerating inclusion
Historical data shows that after the US imposed sanctions on PDVSA in 2019, the weekly fluctuation range of oil prices expanded to 8%; while the impact intensity of military conflicts is 3-5 times that of sanctions - the oil facilities in Iran were attacked in 2019 (similar supply disruption), pushing oil prices to surge by 7.3% in a single day. Currently, the CFTC crude oil volatility index has risen from 18 to 25, and funds have begun to layout geopolitical risks in advance. The premium of near-month contracts over far-month contracts has expanded to 1.2 US dollars, reflecting short-term supply concerns.
Next week's crude oil trading strategy
buy:59.5-60
tp:61-61.50
sl:58.5
