WTI OIL US OIL Bureau of Labor Statistics today published CORE PPI DATA REPORT,
the core ppi Measures the Change in the price of finished goods and services sold by producers, excluding food and energy;'Actual' greater than 'Forecast' is good for currency;
Frequency Released monthly, about 13 days after the month ends and the Next Release will be Sep 10, 2025
the Producer Price Index (PPI) data for July 2025 came in much stronger than expected:
The headline PPI increased by 0.9% month-over-month, compared to the forecast of just 0.2% and a flat 0.0% reading in June. This is the largest monthly gain since June 2022.
Core PPI, which excludes food and energy prices, also surged by 0.9% month-over-month, well above the forecast of 0.2% and no change the prior month.
On a year-over-year basis, the headline PPI rose 3.3%, up from 2.4% in June, while core PPI climbed to 3.7%, the highest core producer inflation level since March 2025.
The price increases were broad-based, with significant rises in goods prices (especially food, steel, aluminum) and service prices (such as machinery wholesaling, hotels, freight).
This sharp rise in producer inflation is partly attributed to the delayed effects of import tariffs, which producers have largely absorbed so far but are starting to pass through into prices.
The strong PPI figures have raised concerns about increasing inflationary pressures, making near-term Federal Reserve interest rate cuts less likely. Markets have adjusted expectations, with the probability of a September rate cut slightly declining.
Labor market data showed initial unemployment claims slightly better than expected at 224,000, indicating continuing labor market strength alongside rising inflation.
In summary, this unexpected surge in wholesale inflation signals growing inflation pressures that could complicate the Federal Reserve's policy decisions moving forward. It suggests inflation at the producer level is escalating after a period of moderation, challenging hopes for near-term rate relief.
At 3:10pm, St. Louis Federal Reserve President and FOMC member Alberto Musalem spoke about U.S. economic conditions and monetary policy. Key points from his statements include:
Tariffs are feeding through into inflation, which is running close to 3%.
Most of the tariff impact on inflation is expected to fade within 6 to 9 months, but there is a chance the impact could be more persistent.
The U.S. economy is around full employment, though there are some early signs of weakening in the labor market.
Musalem favors a meeting-by-meeting approach for monetary policy decisions, emphasizing the need for an open mind as new data arrive.
He revised his view slightly with labor market risks seen as somewhat higher and inflation risks somewhat lower.
Economic growth is slightly below 1%, creating downside risks for the job market.
So far, businesses are not indicating imminent layoffs.
Musalem stressed the Fed's role to listen to businesses and main street rather than political views on monetary policy.
He suggested a patient approach is best, with further rate adjustments dependent on inflation and labor market developments, keeping an eye on whether inflation becomes more persistent or the labor market weakens.
U.S. natural gas storage reported 56 billion cubic feet available, higher than the previous 53 billion, indicating ample supply.
U.S. mortgage delinquencies improved slightly to 3.93% from 4.04%, showing some easing in mortgage stress.
#OIL
Market insights

USOIL--LONG--strong upward reaction from long term support
--Although I prefer price first pullback to entry1 level then move upward, it may directly go to the target

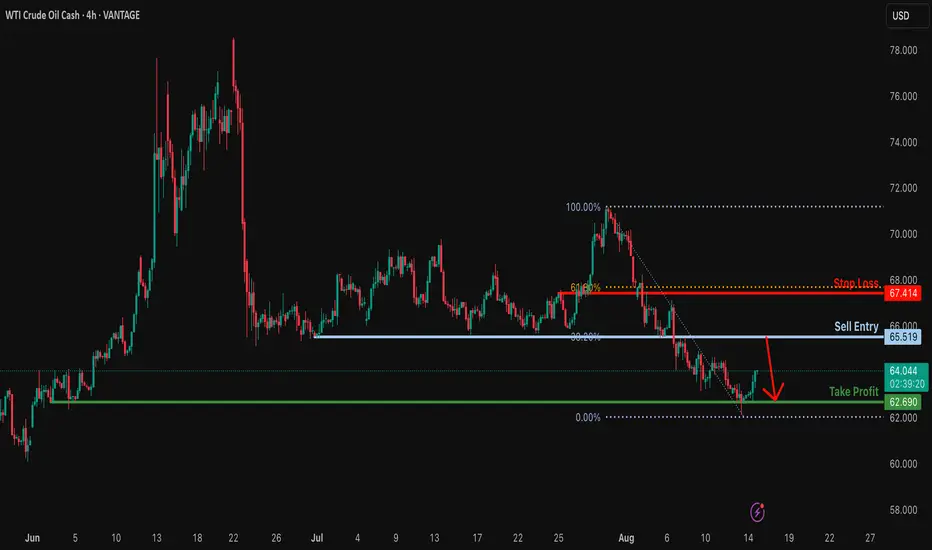
Heading into 38.2% Fibonacci resistance?USO/USD is rising towards the resistance level which is a pullback resistance that lines up with the 38.2% Fibonacci retracement and could drop from this levl ot our take profit.
Entry: 65.51
Why we like it:
There is a pullback resistance that lines up with the 38.25 Fibonacci retracement.
Stop loss: 67.41
Why we like it:
There is a pullback resistance that aligns with the 61.8% Fibonacci retracement.
Take profit: 62.69
Why we like it:
There is a pullback support.
Enjoying your TradingView experience? Review us!
Please be advised that the information presented on TradingView is provided to Vantage (‘Vantage Global Limited’, ‘we’) by a third-party provider (‘Everest Fortune Group’). Please be reminded that you are solely responsible for the trading decisions on your account. There is a very high degree of risk involved in trading. Any information and/or content is intended entirely for research, educational and informational purposes only and does not constitute investment or consultation advice or investment strategy. The information is not tailored to the investment needs of any specific person and therefore does not involve a consideration of any of the investment objectives, financial situation or needs of any viewer that may receive it. Kindly also note that past performance is not a reliable indicator of future results. Actual results may differ materially from those anticipated in forward-looking or past performance statements. We assume no liability as to the accuracy or completeness of any of the information and/or content provided herein and the Company cannot be held responsible for any omission, mistake nor for any loss or damage including without limitation to any loss of profit which may arise from reliance on any information supplied by Everest Fortune Group.
Spot WTI Crude OilBat pattern developing and in b or x leg of neo wave pattern. I am not sebi registered analyst and its not buy , sell hold recommendation.

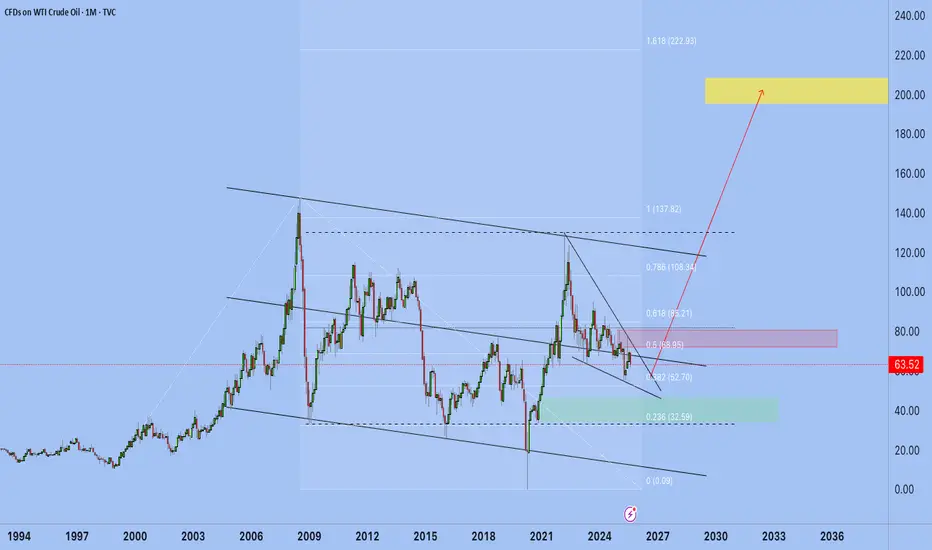
The Path to $200 Oil: A Storm and the T Pattern of the DecadeIn anticipation of the potential meeting between Trump and Putin, many are expecting de-escalation. My primary scenario, however, is that the initial talks will most likely fail. This event will not bring relief but will instead trigger a new round of escalation: intensified sanctions and, consequently, a potential reduction of oil supply on the global market.
It is precisely this impending geopolitical storm that will become the fuel that perfectly aligns with a powerful technical picture that has been forming for years.
It is precisely this impending geopolitical storm that will become the fuel that perfectly aligns with a powerful technical picture that has been forming for years.
Anatomy of the Bull Case – Why the Breakout Will Be Upwards
On the monthly chart, we are not just seeing a consolidation, but one of the strongest bullish setups one can find:
The Giant Bull Flag: We entered this multi-year channel from the bottom. According to all canons of technical analysis, this means the most probable exit will be directed upwards, continuing the prior trend.
The Liquidity Grab (The "Bitcoin 2018" Pattern): The most crucial part happened very recently. We witnessed the formation of a descending triangle that broke to the downside, as expected. But this was not a true bear trend. It was a textbook "liquidity grab"—the market took out the stops of all the buyers, collected their liquidity, and is now ready for the true move up. Bitcoin painted the exact same formation in 2018 before beginning its journey to new highs.
The Psychological Fuel – What Will Power the Rally to $200
A rocket needs fuel. In our case, the fuel will be the short-sellers. At every new level—$100, $120, $150—a huge mass of traders will try to "catch the top" by opening short positions. Their predictable liquidations will be what propels the price ever higher, creating a brutal, months-long short squeeze.
This is precisely why I argue that most will not be able to ride this move. The biggest mistake the average trader will make is either closing their long position too early, taking a pathetic fraction of the profit, or worse, starting to short, fighting against a trend that is stronger than them.
Why a Bear Case is Now a Bet Against Logic
You might ask, "What if it all goes wrong? What is the bear case?"
In the current configuration, I am not considering one. When you have a powerful geopolitical catalyst leading to a supply shock on one side of the scale, and one of the strongest bullish technical patterns after a perfect liquidity grab on the other, the probability shifts so dramatically to one side that betting on a decline becomes a game with a negative expected value. My job is not to guess all outcomes but to bet on the scenario with the highest probability. And right now, it is clearly bullish.
Conclusion
I am leaving this long-term forecast here. This is my view of the market, based on a combination of geopolitics, technicals, and crowd psychology. The direction of the move, in my opinion, has been set. Time will tell who is right. This is not a trading recommendation
Wishing everyone success.
Best regards, EXCAVO.
US OIL LONG SETUP Oil price had been in a falling channel and held the Trendline Support, making attempts to form an ascending wedge, from where I took the long position and price moved up initially but couldn't break the zone to continue upward.

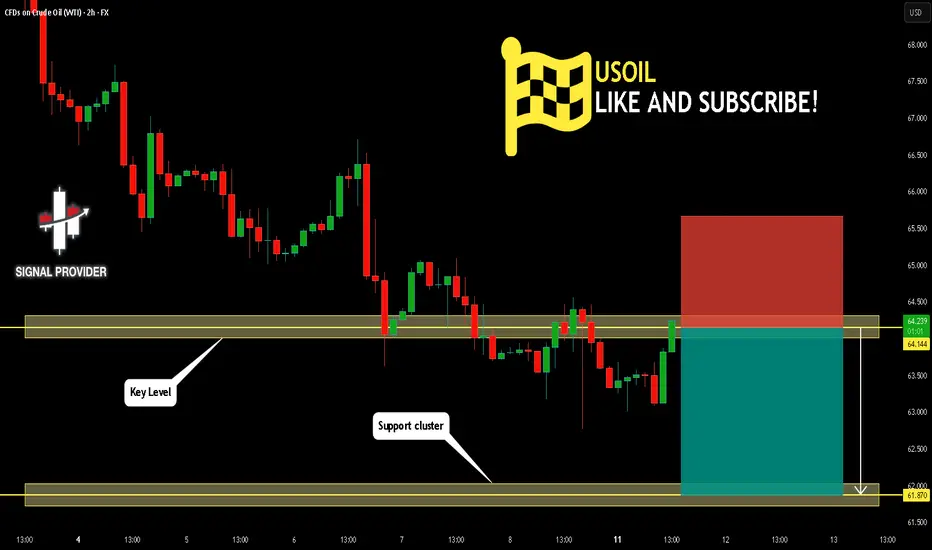
USOIL Is Going Down! Sell!
Take a look at our analysis for USOIL.
Time Frame: 2h
Current Trend: Bearish
Sentiment: Overbought (based on 7-period RSI)
Forecast: Bearish
The price is testing a key resistance 64.144.
Taking into consideration the current market trend & overbought RSI, chances will be high to see a bearish movement to the downside at least to 61.870 level.
P.S
Overbought describes a period of time where there has been a significant and consistent upward move in price over a period of time without much pullback.
Disclosure: I am part of Trade Nation's Influencer program and receive a monthly fee for using their TradingView charts in my analysis.
Like and subscribe and comment my ideas if you enjoy them!
US OILS Detailed AnalysisTechnical Summary:
The primary trend of WTI is bearish, and the prices on a 4H chart also continue their downtrend within a declining wedge pattern.
However, prices are retracing after testing the lower fib level 0.0 (61.33) and are currently trending above a crucial psychological & historically tested support of 62.00.
If prices remain able to sustain higher, then it might test important resistance at 63.00, with a near hurdle at the fib level 0.236 (63.45).
Indicator Interpretation:
The prices are rising after testing the lower Bollinger band, signaling a bullish reversal.
Alternate Scenario
If crude oil breaks the crucial support zone between 62.0 - 61.8, then it could signal rising bearish pressure.
Key Levels
Resistance
R1 = 62.45
R2 = 63.15
Support
S1 = 62.00
S2 = 61.30
Facts & Figures:
The world produces about 95–100 million barrels of crude oil per day, with major producers including the U.S., Saudi Arabia, Russia, and Canada.

Hellena | Oil (4H): SHORT to support area of 61.937 (Fibo lvl).Hello, colleagues!
Well, I think that the previous scenario is still relevant and the “ABC” correction is developing according to the scenario.
At the moment, I see a five-wave structure in the downward wave “C”. I expect a small correction to the area of 67.287, then a continuation of the downward movement to the area between 61.8% and 100% of the levels of Fibonacci extension - the support area of 61.937.
Manage your capital correctly and competently! Only enter trades based on reliable patterns!

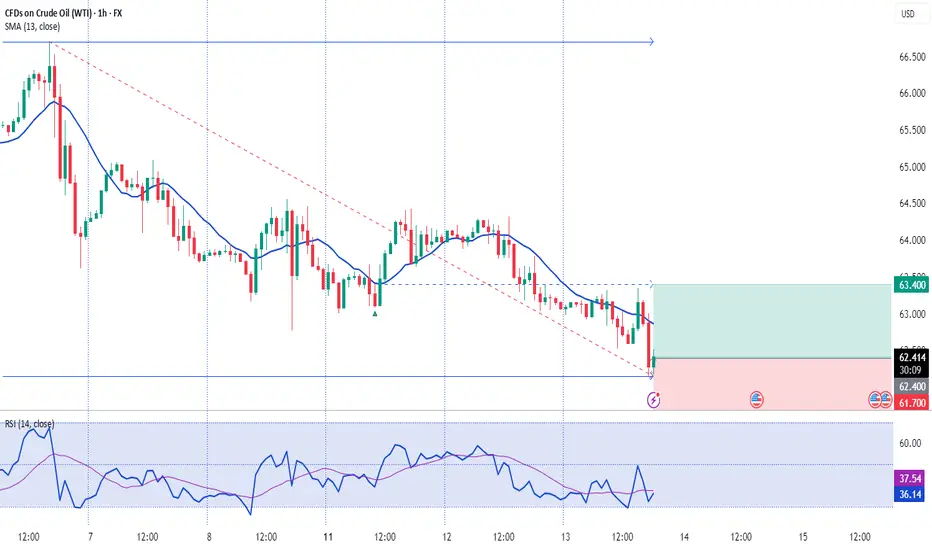
WTI Crude Intraday Buy: Oversold Extremes Signal Dip-BuyTrade Idea - WTI Crude – Buy Limit
Entry: 62.000
Target: 65.260
Stop Loss: 61.000
Type: Intraday
Trade Idea:
The rally was sold and the dip bought, resulting in mild net losses yesterday.
Bespoke resistance is located at 65.26.
There is scope for mild selling at the open, but losses should be limited.
Price is trading at oversold extremes, and the preferred trade is to buy on dips targeting a rebound towards resistance.
Resistance Levels: 63.620 / 65.260 / 66.140
Support Levels: 62.190 / 62.000 / 61.580
Next Volatile Events:
14/08/2025 13:30 – Producer Price Index ex Food & Energy (YoY), US
Disclosure: I am part of Trade Nation's Influencer program and receive a monthly fee for using their TradingView charts in my analysis.

Waiting for pullback USOILPrice has come down the last few days i think it needs a breather. Im looking at these levels for a possible stop hunts before resuming the trend.
Whats your thougts?
USOIL : Back below $63.50Price is now dipping below $63.50 for the second time. I think this time it would just go all the way.
This is the best recession indicator.
Be careful if you are into RISK assets.
Brace for impact.
Good luck.

USOIL - BEARISH MOVE!Hello Traders!
After strong selling pressure,
The USOIL broke the support level (64.970 - 63.983).
This key level becomes new resistance!
So, I expect a new bearish move📉
___________
TARGET: 60.85🎯

EXPECT A BULLISH MOMENTUM SOON ON WTIPrice is forming a falling wedge pattern on WTI and I anticipate a quick turnaround in price. Technically, a buy opportunity is envisaged from the current market price. Target profit is at $64.8 per barrel.

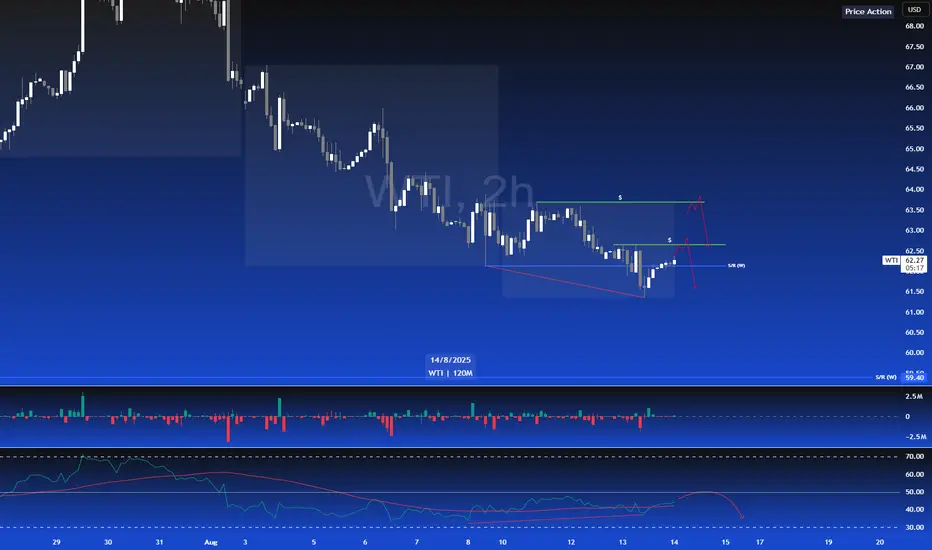
Crude Oil Analysis (WTI / USOIL)
Crude oil prices are currently trading near a key resistance area at $63.30, with the overall trend still bearish, awaiting today’s crude oil inventory report.
🔻 Bearish Scenario:
If the price breaks below $62.60 and holds, it may target the $62.00 level, which could act as a potential rebound area.
🔺 Bullish Scenario:
If the price regains momentum and breaks above $63.30 with a confirmed hold, it could retest the $64.30 level.
