USOIL Will Go Lower From Resistance! Sell!
Take a look at our analysis for USOIL.
Time Frame: 4h
Current Trend: Bearish
Sentiment: Overbought (based on 7-period RSI)
Forecast: Bearish
The price is testing a key resistance 59.046.
Taking into consideration the current market trend & overbought RSI, chances will be high to see a bearish movement to the downside at least to 58.167 level.
P.S
Please, note that an oversold/overbought condition can last for a long time, and therefore being oversold/overbought doesn't mean a price rally will come soon, or at all.
Like and subscribe and comment my ideas if you enjoy them!
Trade ideas

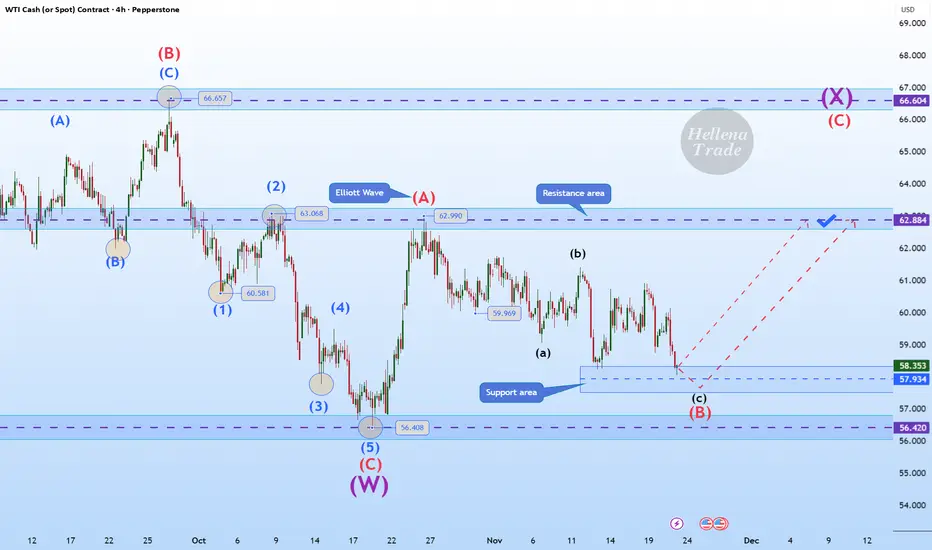
Hellena | Oil (4H): LONG to the area of the maximum of wave “A”.Colleagues, the past forecast has not been canceled, but I see some changes and therefore feel it is necessary to make a fresh forecast.
Apparently, the corrective wave “B” has extended to the area of 57.930. This is quite close to the low of wave “C” at 56.408 and the price should not update it, otherwise there will be a full-fledged break of the structure.
In connection with the above, I think that the price is already completing the downward movement and I expect the resumption of the upward movement at least to the area of the maximum of wave “A” - 62.990.
Manage your capital correctly and competently! Only enter trades based on reliable patterns!
How I Sniped 207 Pips on XAGUSD—Using ONE Simple SetupI just closed out a 207-pip XAGUSD (Silver) trade, and in this video I walk you step-by-step through exactly how it happened — from the higher-timeframe bias to the precise entry inside a clean supply & demand zone.
If you trade Silver, Gold, or any high-volatility pair, this breakdown will help you understand:
Why XAGUSD was primed for a major move
The exact structure shift that confirmed my bias
How I timed my entry with precision and avoided false breakouts
My risk management approach for fast-moving metals
What most traders overlook in Silver price action
How to stay disciplined when the market is moving aggressively
This wasn’t luck — it was preparation, patience, and psychology.
Whether you’re a funded trader, working toward funding, or just trying to level up your price-action skills, this XAGUSD trade recap will give you real insights you can apply immediately.
If you want help refining your strategy or becoming more consistent, drop your email or tap the link in my bio — I’ll send you coaching details.

VNShark OB | Why Some Perfect Order Blocks Still FailOrder Blocks are powerful tools — but they are not sacred zones where we can place absolute confidence.
Even a perfect-looking OB can fail if traders ignore context and its position within the market structure.
A strong displacement, a clean IMB, a clear structure break — these make an OB look perfect on the surface.
But the deeper question is:
👉 Where did this OB form in the overall market cycle?
1️⃣ End-Cycle OBs Look Strong but Carry No Real Strength
Toward the end of a strong trend:
The market runs out of opposing liquidity
Retail traders FOMO into the direction
Counterflow dries up
Buy-side or sell-side participation becomes extremely weak
Without matching orders, Big Money simply cannot push the trend further, even if they generate a strong displacement candle.
This creates the classic “Empty OB”:
Beautiful structure
Strong Phase 1 push
But no institutional follow-through
No Phase 2 continuation
Easy to break with minimal volume
In other words:
👉 Perfect OB, zero internal strength.
2️⃣ Why Big Money Creates a Perfect OB but Doesn’t Continue the Move
A common misunderstanding is believing that a beautiful OB = strong OB.
In reality, at the end of a cycle, institutions often:
Push price with a strong Phase 1 move
Sweep liquidity
Trigger retail entries
Complete their short-term objective
…but when price approaches major HTF support or resistance, they:
👉 Cancel their pending orders
👉 Avoid Phase 2 continuation
👉 Stop committing further capital
The OB remains on the chart — but only as liquidity history, not as active institutional interest.
This is why many “textbook” OBs fail instantly.
3️⃣ Empty OBs Break Easily Near HTF Zones
When price reaches strong H4 or D1 support/resistance:
Retail Buy/Sell activity increases
Institutions stay neutral
Price rises or falls slowly with low volume
And eventually breaks the OB effortlessly
This creates the classic behavior:
👉 Low volume, big impact — Empty OB collapse.
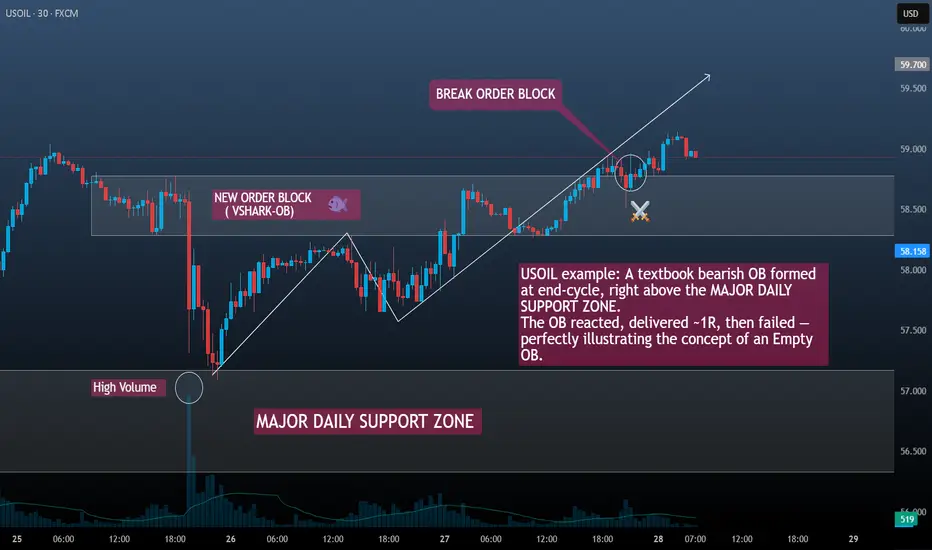
This is exactly what happened to USOIL:
Beautiful bearish OB
Strong displacement
Clean IMB
Nice reaction and even delivered ~1R
But HTF support absorbed the move
Institutions did not push Phase 2
OB failed with small pullback volume
Logical. Clean. And completely in line with end-cycle mechanics.
4️⃣ A Failed OB at End-Cycle Is Not a Bad Sign — It’s a Signal
Most retail traders panic when a perfect OB fails.
Professionals don’t.
Because an OB failing at end-cycle often indicates:
The prior trend is exhausted
Liquidity has been redistributed
HTF structure is taking control
A new cycle is forming
Better opportunities will appear right after the OB breaks
Sometimes, waiting for the OB to fail gives a much clearer, safer, and stronger setup than trading the OB itself.
Conclusion
Order Blocks are powerful —
but they only work when they’re backed by true institutional flow and placed correctly within the market cycle.
When an OB forms:
At the end of a trend
Near HTF support/resistance
When liquidity is dried up
When Phase 2 is absent
…it becomes an Empty OB: beautiful on the surface, but extremely fragile.
The failure of such an OB is not noise.
It is information — a message from Big Money that a new phase is coming.
First Comment (for posting)
Even perfect OBs can fail — especially at end-cycle.
Yesterday’s USOIL setup illustrated this perfectly.
Share your thoughts: Do you track “Empty OBs” in your analysis?
Signature
— VNShark
Institutional OB • Liquidity • Volume • Market Structure
Tag:
#OrderBlock, #SmartMoneyConcept, #SmartMoney, #Liquidity, #VolumeAnalysis, #Imbalance, #MarketStructure, #OBTrading, #InstitutionalTrading, #PriceAction, #BigMoney, #VNSharkOB, #USOIL, #CrudeOil, #WTI, #TradingEducation, #ForexTrading, #CommodityTrading, #TrendAnalysis
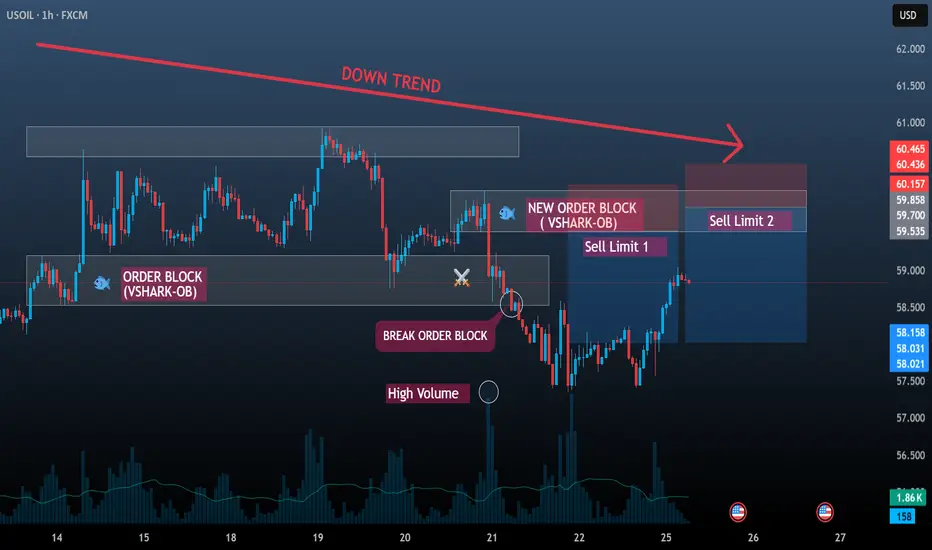
🇺🇸 USOIL – Big Money Steps Back In | Fresh Sell Order BlockUSOIL continues to follow its broader downtrend as Big Money steps back into the market.
After a brief bullish correction, price was rejected sharply and formed a fresh VShark Order Block, supported by strong volume and a clean Imbalance zone.
This reaction reveals clear footprints of large players preparing for the next bearish leg.
🔻 Sell Idea
VShark suggests looking for short entries at the newly formed OB zone, targeting RR 1:2, respecting the prevailing bearish structure.
⚠️ Risk Notice
Always size your positions properly and manage risk carefully.
This is a technical analysis idea — not financial advice.
—
✍️ VNSHARK Signature
Following the footprints of Big Money to understand the market’s true intention.
🏷️ Tags
#USOIL #WTI #BigMoney #OrderBlock #VSharkOB #Volume #Imbalance
#SmartMoney #PriceAction #InstitutionalTrading #VNShark #Commodity

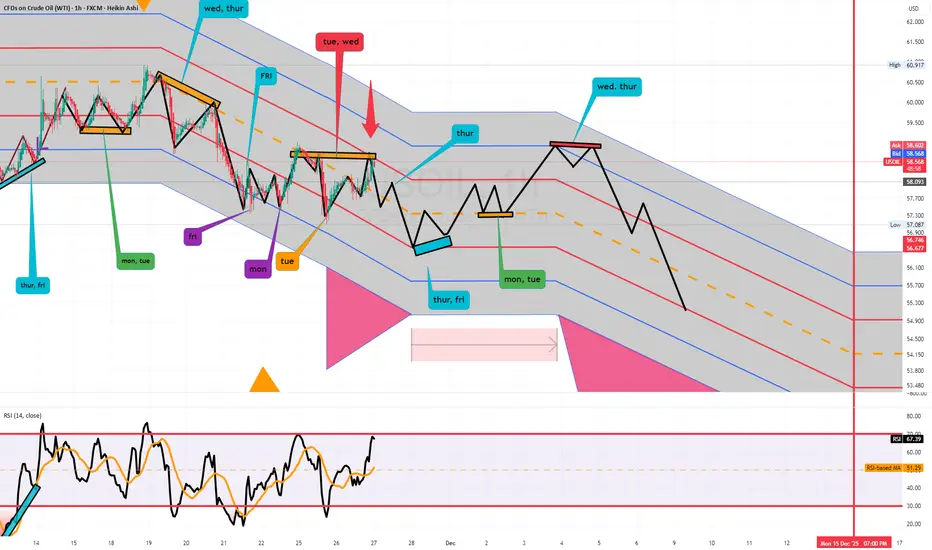
us oilHI GUYS,
UPDATE and CORRECTION on US OIL
we wait for sells Friday morning, a few hours from now,
(MON, TUE) Double bottom buy price is calling for a sell price pattern (FRI, MON) Head shoulder

USOIL : Full analysisHello friends
Well, you see that we have a descending channel in which the price is moving, and considering that the price reached the ceiling of the channel, we had a Sharpe decline, and now it seems that the sellers want to break the channel, and the first support identified could be the buyers' stronghold, where we need to see if they support the price or not.
If they support, there is a significant resistance in their way. This area is full of sell orders and can naturally correct the price. In this regard, breaking this resistance is very important and vital for price growth.
Now what if the buyers cannot support the price in the support area and the price falls further?
Well, we need to find areas again for a sell trade because if the descending channel is broken, the fall will be heavier and it is better to move with the trend.
This analysis is purely technical and is not a buy or sell recommendation.
*Trade safely with us*
USOIL : LIVE TRADE
Hello friends
Well, considering the downtrend and the power of the sellers, we should also follow the trend and go to the side of the one who has the power.
Given the price drop, if the price pullbacks, we can see the price drop again.
This post is not a buy or sell offer and is only reviewed from a technical perspective.
Observe risk and capital management and avoid emotional movements.
*Trade safely with us*
US OILHI GUYS
CORRECTION AND UPDATE ON US OIL
we are around sell area.
Today i expect sells on ( tue, wed) double top price pattern as shown above
Earlier today i adjusted from h4, h6,h8 to Daily path.
The ( RT Daily type 1 ) Illustration will be in comment section.
USOIL FREE SIGNAL|SHORT|
✅WTI OIL is returning into the higher-timeframe supply after clearing buy-side liquidity, signaling distribution. If rejection confirms, bearish displacement could drive price toward the sell-side liquidity target below.
—————————
Entry: 58.70$
Stop Loss: 59.00$
Take Profit: 58.12$
Time Frame: 3H
—————————
SHORT🔥
✅Like and subscribe to never miss a new idea!✅

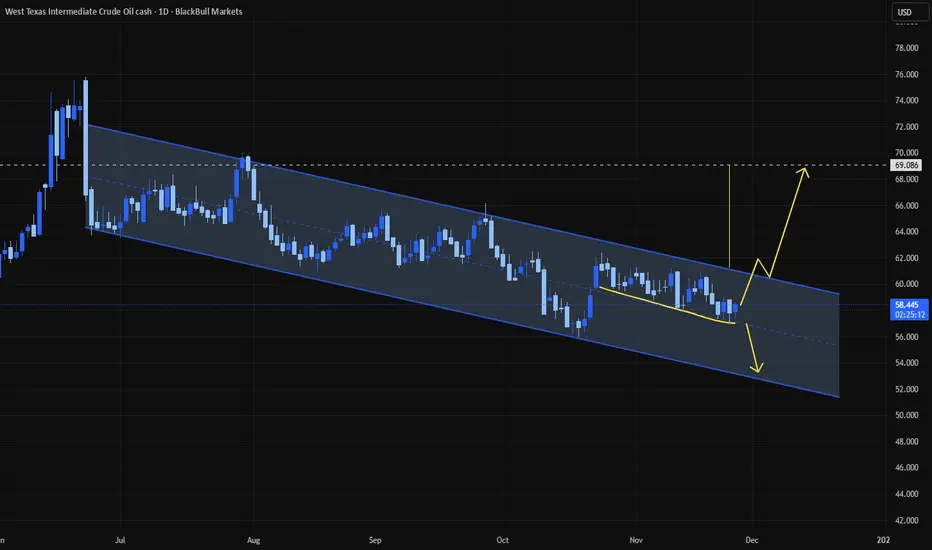
Oil AnalysisFor over a month, oil has been hovering right around the channel’s midline, leaving the market indecisive. We have two scenarios for this situation. Since this analysis is on the daily timeframe, it could take several weeks for either scenario to play out—or it could happen overnight.
To get a clearer picture of oil’s next move, we’re focusing on the daily chart:
Scenario 1 – Breakout to the upside (our preferred scenario)
If the price breaks above the channel’s top and confirms it, we can follow the move up to around $68 according to the classic channel pattern target.
This scenario is our priority because it offers a larger target and higher profit potential.
Scenario 2 – Move toward the bottom of the channel
If the price moves downward, we can follow it to the channel’s bottom, but naturally, the target is smaller.
Why do we prefer a long position in a downtrend?
The reasoning is entirely fundamental:
Instability in the Middle East increases geopolitical risks, which usually drives speculative demand for oil.
For this reason, the upside breakout scenario is considered worth taking, even if the overall structure remains bearish.
WTI Crude Holds at Its Lowest Levels of the YearWTI crude oil continues to show a steady bearish bias below the 60-dollar area in the short term. For now, selling pressure has remained firm, while recent comments regarding the military conflict between Ukraine and Russia point to an increase in reinforcements aimed at achieving a possible ceasefire. Such a scenario could reduce the economic sanctions currently imposed on Russia and, over time, become an important factor that drives a stronger-than-expected recovery in global crude production. This backdrop has kept confidence in the price of the barrel limited, reinforcing a persistent bearish tone that could continue if an official ceasefire is eventually reached.
Medium-Term Trend Remains Firm:
During the second half of the year, the prevailing bearish movements in WTI have maintained a perspective aligned with a solid medium-term downward trendline. So far, no meaningful buying corrections have appeared that could threaten this bearish structure in recent weeks, making it likely that this formation will continue to dominate most price movements in the medium term—especially if the market continues to trade below the 50-period simple moving average.
Neutrality Begins to Emerge in Indicators:
At the moment, both the RSI line and the MACD histogram remain oscillating within the neutral range of their respective indicators. This suggests that, in the short term, both the average selling and buying impulses and the directional strength of the moving averages remain in a neutral and indecisive zone, which can partly be explained by the price interacting with important support areas. What matters here is that as long as both indicators maintain this neutral stance, they could open the door for potential bullish corrections to develop in the coming sessions.
Key Levels to Watch:
60 dollars: This is the main resistance on the chart, aligned with the current downward trendline, the barrier marked by the 50-period moving average, and the 23.6% Fibonacci retracement level. Buying moves that manage to break above this area could trigger a break of the bearish trend, potentially activating a more constructive bullish tone.
58 dollars: This level corresponds to the most recent zone of indecision and could become the reference area to monitor if bullish corrections begin to form within current price movements.
57 dollars: This marks the lowest level of the year and stands as the most relevant bearish barrier at the moment. Selling moves that break below this level could open the door to a more aggressive bearish bias, extending the current downward trend even further.
Written by Julian Pineda, CFA, CMT - Market Analyst

us oilHI GUYS,
CORRECTION AND UPDATE ON US OIL BOTH PRICE PATTERN AND DAYS OF THE WEEK
We currently selling, however the range is not over, i expect (mon, tue) double bottom for buys and (fri, mon) head shoulder sell correction next week.

WTI Crude selling pressure below 5926 resistanceThe WTI Crude continues to display a bearish outlook, in line with the prevailing downward trend. Recent price action suggests a corrective pullback, potentially setting up for another move lower if resistance holds.
Key Level: 5926
This zone, previously a consolidation area, now acts as a significant resistance level.
Bearish Scenario (rejection at 5926):
A failed test and rejection at 5926 would likely resume the bearish momentum.
Downside targets include:
5745 – Initial support
5677 – Intermediate support
5635 – Longer-term support level
Bullish Scenario (breakout above 5926):
A confirmed breakout and daily close above 5926 would invalidate the bearish setup.
In that case, potential upside resistance levels are:
5973 – First resistance
6025 – Further upside target
Conclusion
WTI Crude remains under bearish pressure, with the 5926 level acting as a key inflection point. As long as price remains below this level, the bias favours further downside. Traders should watch for price confirmation around that level to assess the next move.
This communication is for informational purposes only and should not be viewed as any form of recommendation as to a particular course of action or as investment advice. It is not intended as an offer or solicitation for the purchase or sale of any financial instrument or as an official confirmation of any transaction. Opinions, estimates and assumptions expressed herein are made as of the date of this communication and are subject to change without notice. This communication has been prepared based upon information, including market prices, data and other information, believed to be reliable; however, Trade Nation does not warrant its completeness or accuracy. All market prices and market data contained in or attached to this communication are indicative and subject to change without notice.

Analysis of Core Factors in the Short-Term Oil MarketSupply Side: The oversupply situation has become a consensus, and the geo-political support has failed
- Global supply remains consistently tight: The OPEC report in November adjusted the global oil situation to be in an oversupply state. The current daily production exceeds demand by 500,000 barrels, while the previous month's estimate was a shortage of 400,000 barrels. The IEA has continuously raised the expected global crude oil supply surplus for six consecutive months, and it is predicted that in 2026, there will be a record-breaking surplus of nearly 4 million barrels per day. At the same time, the supply increase in the United States is significant. As of the week of November 21, the total number of oil drilling rigs in the United States increased to 419. The Trump administration also plans to open new drilling areas in the west coast and the Arctic. Additionally, although OPEC+ has suspended production increases in the first quarter of next year, the overall supply growth trend remains strong, making it difficult to change the oversupply situation.
- Geopolitical risks have marginally eased: There have been signals of peace talks in the Ukraine conflict. US officials stated that Ukraine has agreed to the terms of the peace agreement, with only some details yet to be finalized. Zelensky expects to "as soon as possible" visit the United States to advance the agreement. This news has weakened the geopolitical risk premium for oil. Although Russian refineries and export ports have been attacked multiple times recently, Russia can buffer through methods such as temporary storage in floating tanks, and the short-term export pressure is limited, making it difficult to have a substantive impact on supply.
Crude Oil Strategy Analysis
sell:58.5-59
tp:58-57.5
sl:59.5
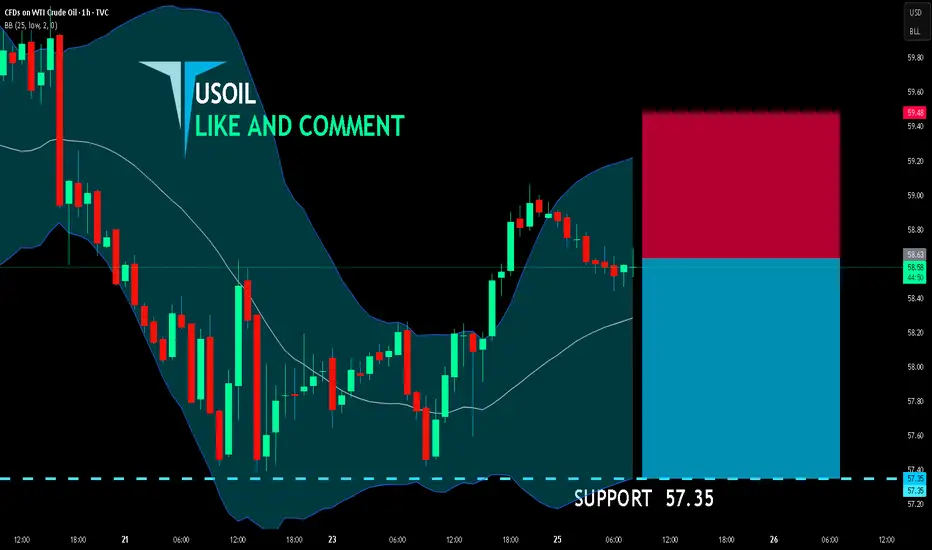
USOIL BEARS ARE GAINING STRENGTH|SHORT
USOIL SIGNAL
Trade Direction: short
Entry Level: 58.63
Target Level: 57.35
Stop Loss: 59.48
RISK PROFILE
Risk level: medium
Suggested risk: 1%
Timeframe: 1h
Disclosure: I am part of Trade Nation's Influencer program and receive a monthly fee for using their TradingView charts in my analysis.
✅LIKE AND COMMENT MY IDEAS✅
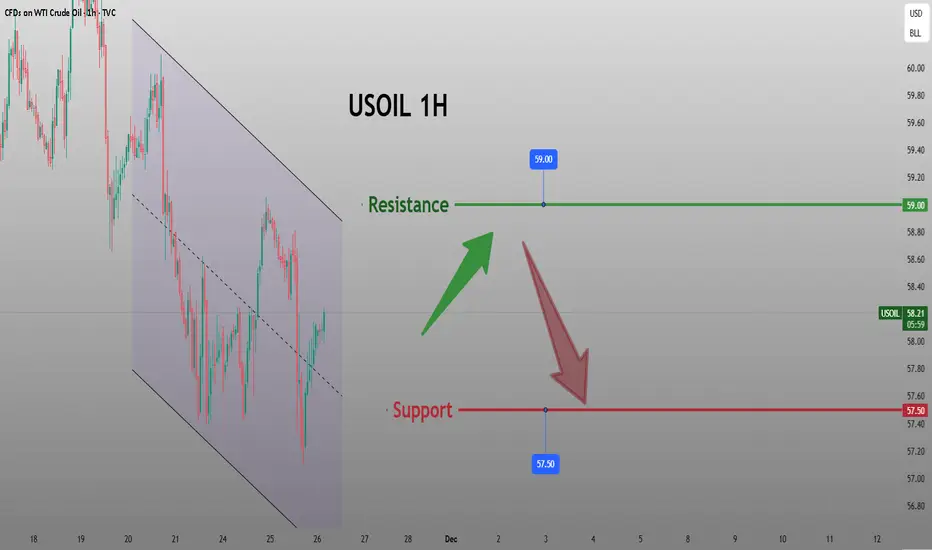
Crude Oil 4H Falling Channel OutlookCrude Oil continues to respect the falling channel on the 4 hour chart. Every move toward the upper trendline is facing heavy selling pressure. Recent rejection from the 58.25 and 58.80 supply zones pushed price back down toward the 57.40 support area.
The bounce from the grey box looks corrective and not strong enough to confirm reversal. The major support remains at the 57.00 to 57.20 green zone. Multiple retests show this level is weakening and a break below it can open room for further downside.
On the upside, buyers need a clean breakout above the falling trendline to shift momentum. First targets on a breakout remain 58.25 and then 58.80.
Key Resistance Zones: 58.25, 58.80, 60.05
Key Support Zones: 57.40, 57.00
Bias remains bearish until the channel is broken.

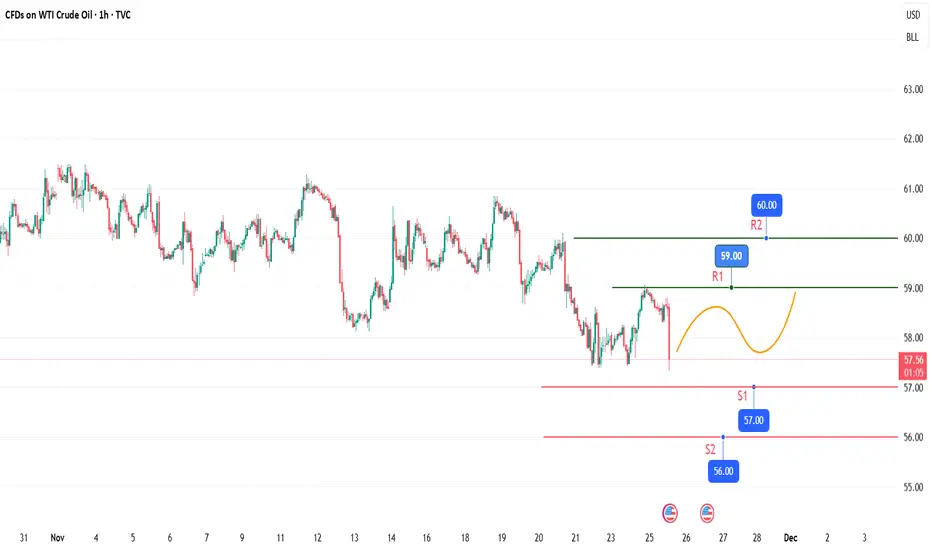
USOIL trades with a weak oscillatory biasUSOIL is exhibiting a weak oscillatory downward trend today. Despite a slight rebound yesterday, affected by bearish news and technical pressure, the intraday upside momentum remains insufficient, with bearish momentum gradually emerging. Overall, it shows a sluggish pattern of a quick pullback after the rebound.
For the upside, focus on the short-term resistance zone of $59.5 - $60.5 per barrel, among which $59.5 per barrel can be regarded as a key watershed. On the downside, closely monitor the support range of $57.0 - $57.5 per barrel. If this zone is effectively broken down, the price may further decline to around $56 per barrel.
Sell 59 - 59.7
SL 60.1
TP 57.5 - 57 - 56.5
USOIL : LIVE TRADEHello friends
Given the bearish structure we had, the price has now been supported by buyers at the specified support several times and we can expect this support to continue.
Observe risk and capital management and avoid emotional and irrational behavior.
*Trade safely with us*

WTI OIL Short-term relief rebound before a Lower Low?WTI Oil (USOIL) has been trading within a 1-month Channel Down and has just completed its strongest Bearish Leg (-5.91%). All previous three Bearish Legs eventually bottomed and rebounded into the new Bullish Legs towards the Sell Zone consisting of the 4H MA200 (orange trend-line) - 1D MA50 (red trend-line) range to form a new Lower High.
In 2 out of those 3 cases, it even exceeded the 0.618 Fibonacci retracement level. As a result, we expect a short-term rise now to subsequently be sold towards the -0.236 Fibonacci extension. Our medium-term Target remains 56.500.
---
** Please LIKE 👍, FOLLOW ✅, SHARE 🙌 and COMMENT ✍ if you enjoy this idea! Also share your ideas and charts in the comments section below! This is best way to keep it relevant, support us, keep the content here free and allow the idea to reach as many people as possible. **
---
💸💸💸💸💸💸
👇 👇 👇 👇 👇 👇

Sell USOIL – Smart Money Getting Ready to Pull the TriggerUSOIL is still in a clean downtrend — lower highs, lower lows, no drama, just classic bearish structure.
The previous bullish Order Block didn’t survive the pressure.
It got broken with heavy volume, which usually means:
“Buyers tried… Smart Money said nope.”
Now a new bearish VShark-OB has formed, and price is pulling back to refill liquidity — the typical “come back to daddy” move before the next leg down.
Sell Zones I’m watching:
Sell Limit 1: First touch of the new OB
Sell Limit 2: Higher liquidity sweep — in case Smart Money wants to hunt some eager early sellers before sending it lower
Volume is also aligning with the narrative.
That big spike wasn’t random — it’s the footprint of large players preparing their next push.
Let’s see if price respects the OB and delivers the next displacement.
#USOIL #CrudeOil #WTI #OrderBlock #SmartMoney #SMC #PriceAction
#Liquidity #VolumeAnalysis #InstitutionalTrading #VSharkOB
#MarketStructure #SellSetup #TradingView #TechnicalAnalysis
WTI Crude Oil (OIL) – Sell OutlookPrice is retesting a supply zone at 58.60–58.90 after a bearish market structure (BOS + CHoCH).
As long as price stays below this zone, we expect continuation to the downside.
🔻 Sell Bias: After rejection from supply
🎯 Target: 57.20–57.30 (Weak Low liquidity)
🛑 Stop: Above the supply zone
⚠️ Downtrend remains valid — demand below looks weak and likely to break.

WTICOUSD LONG TERM PREDICITIONBasically, this setup is from a monthly timeframe. I usually look for the trend first before entering. So, my analysis indicates a long-term buy, with many strong resistance levels that make it difficult for the price to break through. That’s all, thank you, let the market take its time to rise. :) TYOR (trust your own research/risk).
