USOIL Is Very Bearish! Sell!
Please, check our technical outlook for USOIL.
Time Frame: 15m
Current Trend: Bearish
Sentiment: Overbought (based on 7-period RSI)
Forecast: Bearish
The market is approaching a significant resistance area 57.983.
Due to the fact that we see a positive bearish reaction from the underlined area, I strongly believe that sellers will manage to push the price all the way down to 57.471 level.
P.S
We determine oversold/overbought condition with RSI indicator.
When it drops below 30 - the market is considered to be oversold.
When it bounces above 70 - the market is considered to be overbought.
Like and subscribe and comment my ideas if you enjoy them!
Trade ideas

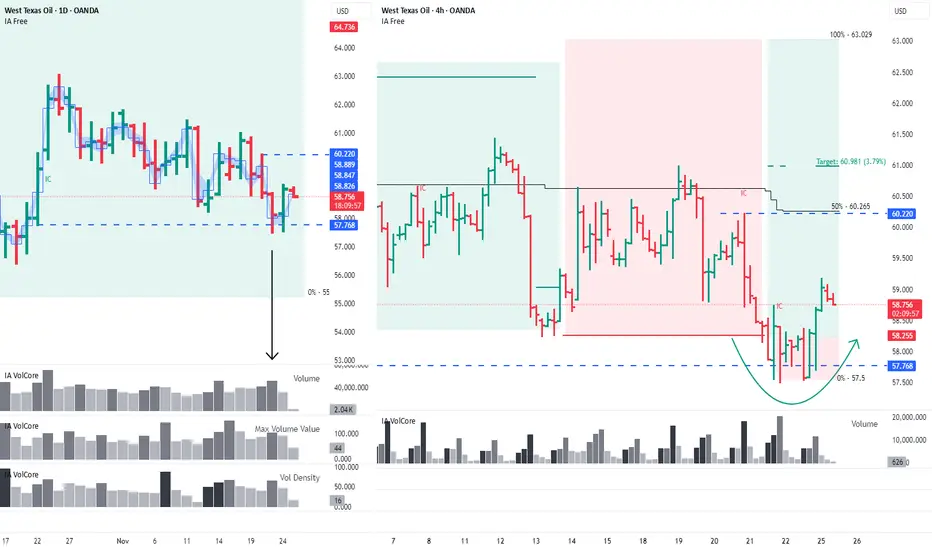
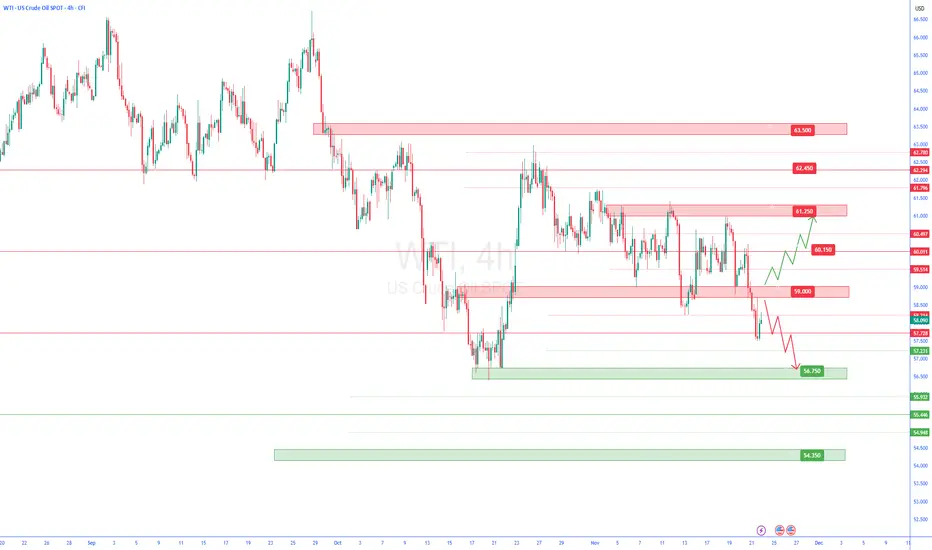
WTI: Buyers Return After a False BreakoutOn the daily timeframe, buyers absorbed the sellers, and a false-breakout pattern has formed on the 4H chart. The nearest targets are 60.22 and 60.981.
This analysis is based on the Initiative Analysis (IA) method.
Hello, traders and investors!
Oil is showing early signs of recovery. On the daily timeframe, the key level is 57.768 — the base of a buyer candle with increased volume during the last upward impulse. A high-volume seller candle interacted with this level, and yesterday’s daily buyer candle absorbed the seller, indicating strengthening buyer initiative. It’s also worth noting that in both candles, the key volume was accumulated at the bottom.
The blue band on the chart represents the minimal price range of the candle where 50% of the volume was accumulated.
The blue line marks the price level with the maximum accumulated volume.
On the 4-hour timeframe, the price is in a sideways range. A false-breakout pattern has just formed at the lower boundary of this range. The nearest target is 60.22, which aligns with the 50% level of the trading range — an important point to monitor. The next target is 60.981.
Wishing you profitable trades!

Oil Upd:Price at Resistance–But the Real Story Is in OptionFlowRight now, price has reached the upper boundary of the 1σ Expected Range (ER).
A pause or rejection here is possible.
But that’s not the main story.
Bears are getting active in the options market.
First sign: A significant Put Condor has appeared — large enough to stand out.
Target range: $55–$57
Timeframe: 20 days to expiry
📌 For those still learning:
A Condor profits most when price stays within a tight range at expiry.
Second wave of bearish positioning:
Additional players are placing Put Spreads targeting $54–$55, but with a much shorter horizon — 5–7 days.
This shows a layered approach:
Short and mid- term pressure expected
🧠 Bottom Line:
I’m not jumping into shorts right now — and I wouldn’t advise it blindly.
But given this growing bearish sentiment, it’s smart to start looking for short setups
Sentiment is building.
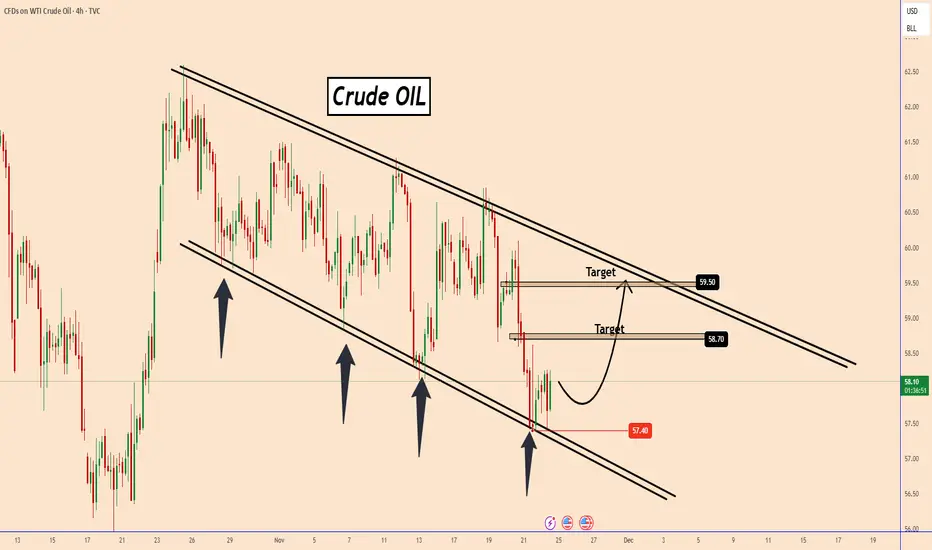
OIL: Time To Rise AgainOIL: Time To Rise Again
Oil is moving within a "Descending Channel Pattern" which is clear and well defined.
Every time the price tested the lower support of the pattern, the price moved back up and every time Oil tested the upper boundary of the pattern, the price moved back down.
It is more likely that Oil has found strong bullish momentum again near the 57.40 support area and is probably preparing to move higher as shown in the chart.
KeyTargets:
58.70
59.50
You may find more details in the chart!
Thank you and Good Luck!
❤️PS: Please support with a like or comment if you find this analysis useful for your trading day❤️
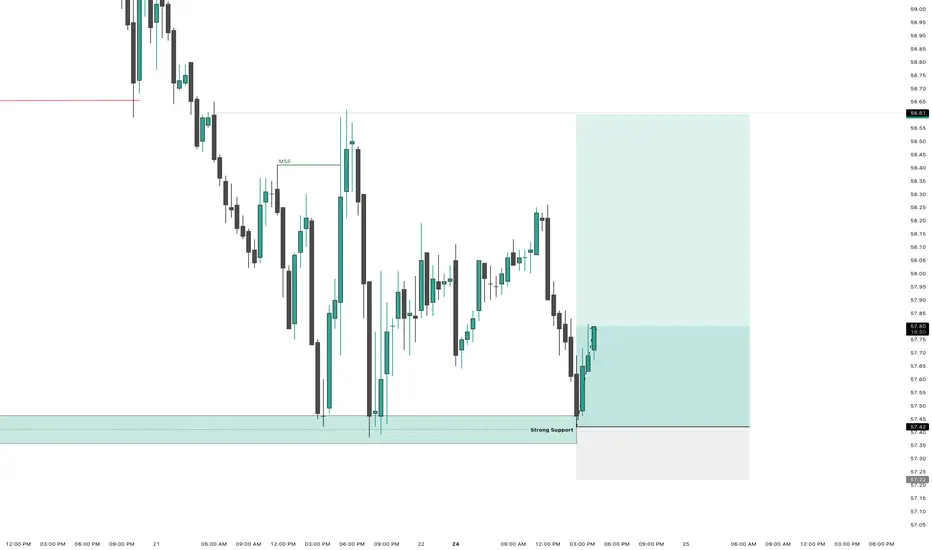
USOIL M30 Bullish Reversal Setup from Strong SupportPrice tapped a major demand zone / strong support around 57.40 – 57.50, a level previously respected multiple times.
This zone has acted as a liquidity pool, and today price swept the lows before showing a strong rejection wick – signaling aggressive buyers stepping in.
After the liquidity sweep, USOIL printed a clean bullish reaction candle, confirming that buyers are defending the structure.
Why Buy Here?
• Strong historical support at 57.40
• Liquidity grab + bullish rejection
• Market structure attempting a shift on LTF
• Room to retrace back into imbalance above
Buying Area:
57.45 – 57.60 (demand zone reaction)
Short-Term Target:
58.55 – 58.60 (FVG + previous supply zone)
Invalidation:
Break and candle close below 57.35
Bias:
Bullish as long as price stays above demand zone.
A clean risk-to-reward recovery move is expected if momentum holds.
Oil – Geopolitical Engine Ready to Fuel a Surge to $100My view: I believe that oil is one of the best investments for the upcoming years. There is a strong bullish potential, with targets up to $100 a barrel, based on geopolitical and fundamental factors
Geopolitical Risk
There is a real risk of conflict between the U.S. (with Trump) and key oil-producing nations such as Venezuela. Any intervention or sanction could generate a geopolitical risk premium in the oil market.
Saudi Arabia, a central OPEC+ member, may manipulate production to maintain high oil prices. Riyadh’s strategy could be driven by its need to fund its major development projects, especially under its Vision 2030 roadmap.
OPEC+ members have made varied production decisions: while some increase supply, heavier-weight countries like Saudi Arabia restrict production to defend prices.
Saudi Arabia is diversifying its economy, but petroleum remains a cornerstone to finance its transformation agenda.
To support its budget and future mega-projects, Riyadh may aim to keep oil prices elevated, which supports a long-term bullish case.
My target: $100/barrel in a scenario where geopolitical risks intensify or remain structurally elevated.
I believe investing in oil now has strong upside potential: the market may not yet fully price in all geopolitical threats or Saudi strategy.
Of course, risk scenarios must be considered (demand drop, energy transition), but from my perspective, the bull case is very credible.

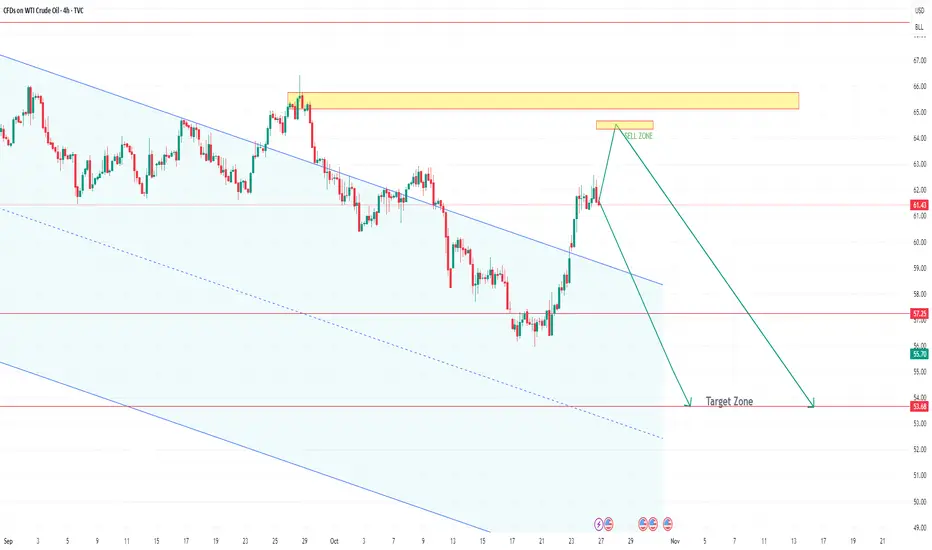
WTI Oil Market Outlook: Sell Zones & Key LevelsOil is still respecting a broader downtrend structure with consistent lower highs and lower lows. Price recently reacted from the $62–63 resistance zone (trendline + supply) confirming another lower high and maintaining bearish momentum. As long as oil stays below this zone the chart suggests a continuation toward the downside with next supports sitting near $56.30, $52.50 and potentially $50.00 if bearish pressure accelerates.
Only a clean breakout above $63 with strong candles would invalidate this bearish outlook and shift momentum toward the $66–70 zone.
🔻 Sell Setup 1
- Entry Zone: 62.00 – 63.00
- Stop Loss: 63.80
- Targets: TP1 59.00, TP2 56.30, TP3 52.50
🔻 Sell Setup 2
- Entry: Break below 57.50 and retest
- Stop Loss: 59.20
- Targets: TP1 56.30, TP2 52.50, TP3 50.00
Note
Please risk management in trading is a Key so use your money accordingly. If you like the idea then please like and boost. Thank you and Good Luck!

Crude Falls with Market Sentiment, Key Levels StandFrom a weekly perspective, the overall outlook on crude remains within a dominant downtrend since 2023, with a shorter-term trend forming from June 2025, currently stabilizing above the $55 per barrel mark.
Scenarios:
• Upside: Climbing back above the upper bound of the short-term channel (June–November 2025) and above the $63 mark could open the way for a retest of the upper boundary of the broader downtrending channel that has been in place since December 2023, near $66, before confirming a structured bullish breakout.
• Downside: A drop below the lower boundary of the six-month channel and the $55 yearly low is expected to extend losses toward the bottom of the original downtrend channel near $49, where another bullish rebound could emerge.
The borders of the December 2023–November 2025 channel remain dominant in defining crude’s next major directional move.
Written by Razan Hilal, CMT
USOIL : Daily analysis 24/11/2025Oil stabilized after a sharp weekly drop as markets weighed the possibility of a Russia-Ukraine peace deal that could add even more supply to an already well-supplied market. Prices have been sliding for months due to rising global production and expectations of a record surplus in the coming year. A potential agreement that leads to sanction relief for Russia would increase the oversupply even further, although political hurdles remain, and European leaders are pushing for revisions to the peace framework. Traders are also watching Middle East tensions and softer near-term market tightness, while OPEC and its partners prepare to review output strategy later in the month.
On the technical side, the crude oil price is testing the support of the lower band of the Bollinger Bands around the $58 price area. The Stochastic oscillator is in extremely oversold levels, hinting that a bullish correction may be forming, while the Bollinger Bands are quite expanded, indicating that volatility is present to support any sharp moves. On the other hand, the moving averages are validating an overall bearish trend in the market, and therefore any bullish correction might be minor. In the event that the price does indeed correct to the upside, the first area of potential resistance may be seen around $60, which represents both the psychological resistance of the round number and the 38.2% Fibonacci retracement level. If, however, it continues its bearish trajectory, then it might retest the lows of $57, which was tested again in late October.
Disclaimer: The opinions in this article are personal to the writer and do not reflect those of Exness
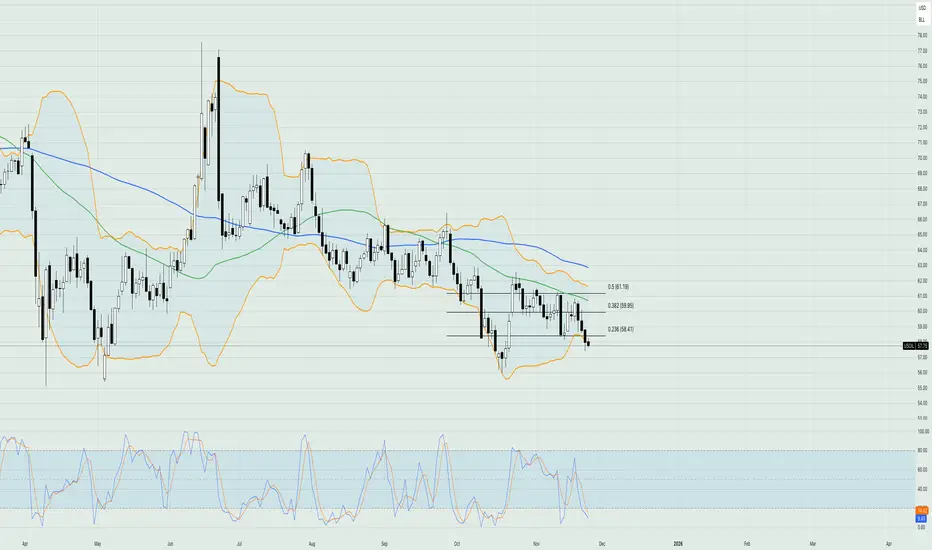
Crude oil: Weak ConsolidationToday, crude oil is trading with a weak oscillatory bias, fluctuating narrowly within the 57 - 58 per barrel range. The softened geopolitical risks have set the tone for the subdued market sentiment, while the technical landscape remains dominated by bears.
Key Levels:
Support Zones:Immediate support is concentrated around 57.0 – 57.4 per barrel, with notable buying interest emerging near 57.6. A breakdown below this zone could pave the way for a test of 56.0 per barrel, potentially extending to the vicinity of the annual low around the same level.
Resistance Levels:Near-term resistance lies around 58.75 per barrel, where some trading strategies suggest initiating short positions. Further resistance is seen at the 59.0 – 60.0 per barrel range; only a decisive breakout above this interval can alleviate the short-term bearish momentum. For a full trend reversal, a breach of the long-term key resistance at 61.44 per barrel is required.

Temporary Long .. Would have thought this is the bottom but it is hard to decide these things. There seems to be a little support at $57.4,
The only pattern i see it oil getting rejected at the 50mma (green line), so any up move might stop at that line. Will wait for price action this week to see if it still is in this downward channel.

USOIL: Bullish Continuation
It is essential that we apply multitimeframe technical analysis and there is no better example of why that is the case than the current USOIL chart which, if analyzed properly, clearly points in the upward direction.
Disclosure: I am part of Trade Nation's Influencer program and receive a monthly fee for using their TradingView charts in my analysis.
❤️ Please, support our work with like & comment! ❤️
Supply sideThe situation of excess has become a definite trend, with weak supporting force
- OPEC + increased production, coupled with the conclusion of supply surplus, Securities Times e-Company: The OPEC report in November changed the global oil situation from healthy to surplus. Currently, the world's oil production exceeds demand by 500,000 barrels per day, while a month ago it was estimated to be a shortage of 400,000 barrels. Although OPEC + decided to suspend production increase in the first quarter of 2026, it will still increase production by 137,000 barrels per day in December, and the continuous rounds of production increase in the past have continuously accumulated market supply pressure. At the same time, the compensation for production cuts by some oil-producing countries can slightly offset the impact of production increase, but it is difficult to change the overall surplus situation.
- Non-OPEC oil-producing countries have high production: The U.S. crude oil production remains at a high level, with the production reaching 13.862 million barrels per day in the week of November 7th. Although it has slightly declined later, it still remains at a historical high level. EIA also raised the 2026 U.S. crude oil production by 200,000 barrels per day to 13.5 million barrels per day. Its continuous production increase further intensifies the expectation of global supply surplus.
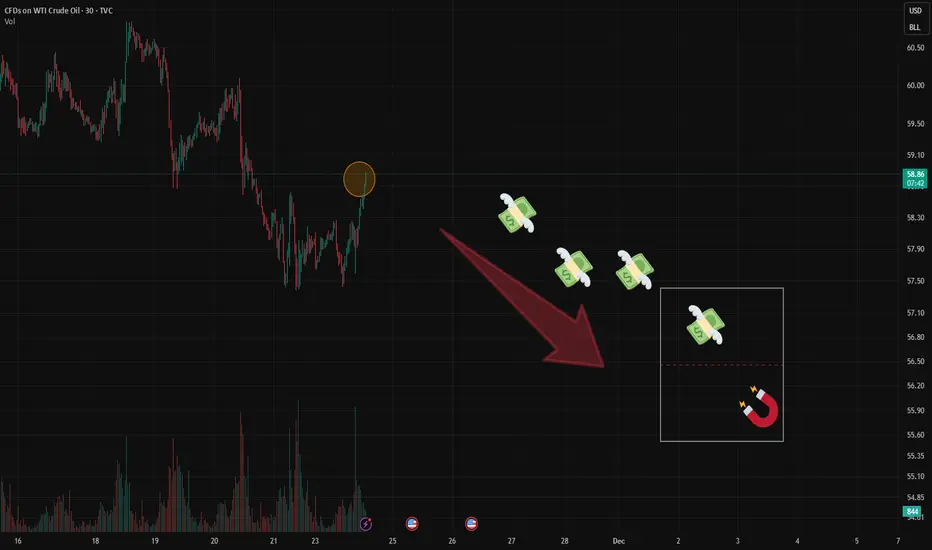
Next week's crude oil strategy analysis
sell:58-58.5
tp:57.5-57
sl:59.5

November close Where will FX:USOIL close this month?
A. $65
B. $61
C. $58
D. Below $58 somewhere around $55
What do you think?
My guess would be B. $61 because there is RSI divergence on W timeframe.

US OIL Short to 53.68The Commodity is expected to hit lower levels . The trend shows weakening of the Oil prices to the levels of 53 level.
The retracement is expected to the levels of 64.50 before the fall happens.
wti 4h🔹 Overall Outlook and Potential Price Movements
In the charts above, we have outlined the overall outlook and possible price movement paths.
As shown, each analysis highlights a key support or resistance zone near the current market price. The market’s reaction to these zones — whether a breakout or rejection — will likely determine the next direction of the price toward the specified levels.
⚠️ Important Note:
The purpose of these trading perspectives is to identify key upcoming price levels and assess potential market reactions. The provided analyses are not trading signals in any way.
✅ Recommendation for Use:
To make effective use of these analyses, it is advised to manually draw the marked zones on your chart. Then, on the 15-minute time frame, monitor the candlestick behavior and look for valid entry triggers before making any trading decisions.
CRUDE OIL Will Fall! Sell!
Hello,Traders!
USOIL is reacting inside the horizontal supply after a liquidity sweep, showing early bearish displacement. If rejection holds, price may continue lower toward the sell-side liquidity at the marked target zone.Time Frame 2H.
Sell!
Comment and subscribe to help us grow!
Check out other forecasts below too!
Disclosure: I am part of Trade Nation's Influencer program and receive a monthly fee for using their TradingView charts in my analysis.

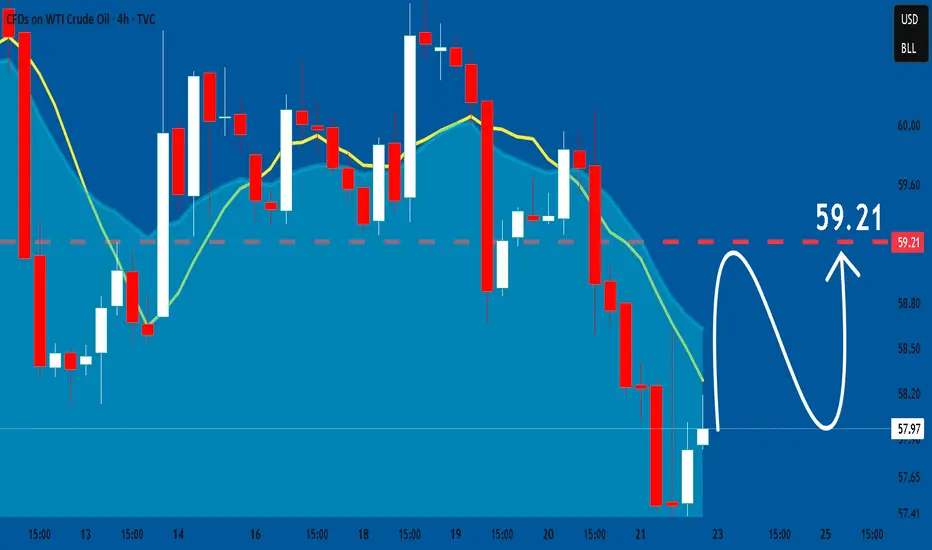
USOIL The Target Is UP! BUY!
My dear friends,
USOIL looks like it will make a good move, and here are the details:
The market is trading on 57.97 pivot level.
Bias - Bullish
Technical Indicators: Supper Trend generates a clear long signal while Pivot Point HL is currently determining the overall Bullish trend of the market.
Goal - 58.98
About Used Indicators:
Pivot points are a great way to identify areas of support and resistance, but they work best when combined with other kinds of technical analysis
Disclosure: I am part of Trade Nation's Influencer program and receive a monthly fee for using their TradingView charts in my analysis.
———————————
WISH YOU ALL LUCK

Approaching Major Support (56.5–57.0) | Potential Double Bottom WTI Crude Oil – Multi-Timeframe Analysis
Monthly (1M)
WTI is approaching a major long-term support zone at 56.5–57.0. There is a potential monthly double bottom forming, but it’s still unconfirmed. Trend remains bearish as price stays below EMA20/EMA50.
Weekly (1W)
Momentum remains weak – RSI < 50 and MACD pointing down.
However, the 56.7 level has been tested three times, forming a strong structural support. No strong bullish signals yet, but buyers are defending the area.
Daily (1D)
Price keeps rejecting EMA50, confirming the broader downtrend, but Stoch RSI is entering oversold territory. A clean retest of 56.5 would form a daily double bottom. MACD is flattening near zero, showing early signs of exhaustion.
4-Hour (4H)
This is where the strongest bullish signals appear:
MACD deeply oversold
RSI showing bullish divergence
Stoch RSI turning up from zero
Clear reaction from 57.18 support
This timeframe suggests a potential short-term bounce.

WTI Crude Returns to the Year’s LowsIn recent trading sessions, WTI crude oil has posted three consecutive losing sessions, recording a decline of more than 4.7% in the short term. Selling pressure remains steady, driven by concerns over a potential market oversupply, especially with the upcoming OPEC+ meeting in December. Additionally, weaker market confidence has raised expectations of lower short-term demand for oil, reinforcing a sense of uncertainty in crude price movements. If this trend persists, it could result in stronger selling pressure in the coming sessions.
Downtrend Remains Firm
For now, the downward movements have maintained a bearish trendline that has persisted over recent months. So far, buying attempts have not been strong enough to challenge this structure. As the price approaches the year’s lows, the downtrend could become even steeper in the coming sessions.
RSI
The RSI indicator continues to show consistent oscillations below the neutral 50 level, suggesting that the average momentum over the past 14 sessions remains predominantly bearish. If the RSI continues to decline, this could indicate stronger selling pressure in the next few sessions.
TRIX
Meanwhile, the TRIX indicator remains below the neutral 0 level, signaling that the average strength of the exponential moving averages continues to favor a bearish bias. As long as this sentiment persists, selling momentum is likely to remain dominant in WTI crude’s price action.
Key Levels to Watch:
$57 – Key Support: Represents the year’s low zone and serves as the main bearish barrier. A break below this level could reinforce the ongoing downtrend and extend selling pressure in the coming sessions.
$60 – Nearby Barrier: Corresponds to the 50-period simple moving average. Price movements returning to this level could trigger indecision and lead to a short-term sideways range.
$64 – Major Resistance: Aligns with the 200-period moving average and represents the most important bullish barrier in the short term. If the price reaches this level, it could revive buying momentum and challenge the current bearish structure.
Written by Julian Pineda, CFA, CMT – Market Analyst

USOIL BEARISH BIAS|SHORT|
✅CRUDE OIL rejected the 3H supply after taking buy-side liquidity, producing strong bearish displacement. With order flow turning lower, price is likely to seek the sell-side liquidity resting at the marked target zone. Time Frame: 3H
LONG🚀
✅Like and subscribe to never miss a new idea!✅

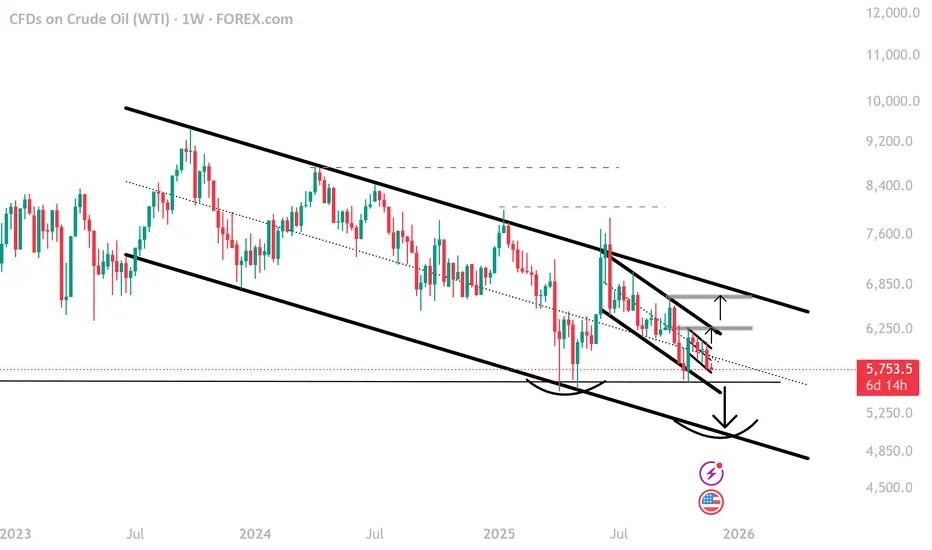
Weekly Oil Candle AnalysisAs you can see, oil has been in a long-term downtrend, and this trend has been weakening over time.
Toward the end of this trend, the last few candles show that price is entering a compression zone, which usually leads to a strong move afterward. Now we need to wait and see in which direction this “spring-like” compression will release, so we can follow the trend once it starts.
