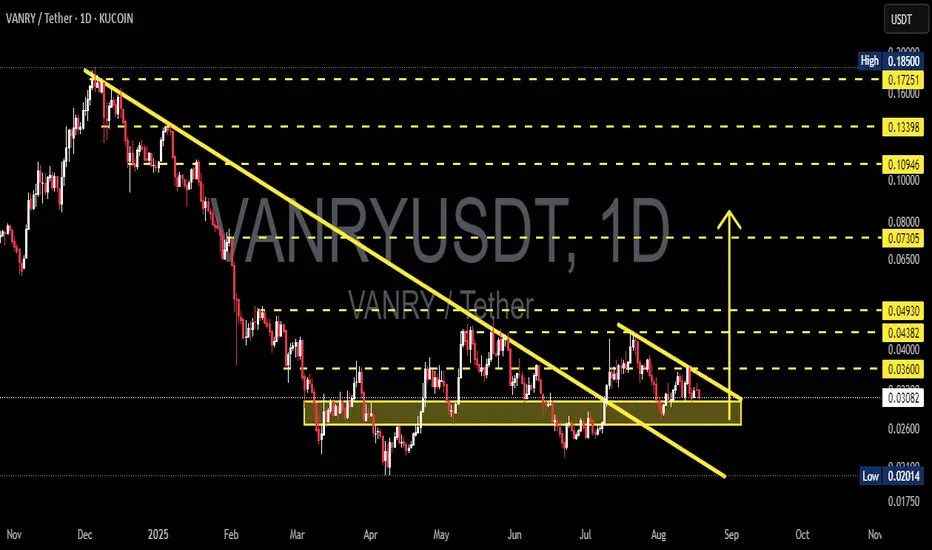
VANRY/USDT – Symmetrical Triangle, Major Breakout Approaching!🔎 Chart Overview
VANRY/USDT is currently in a consolidation phase after a prolonged downtrend since early 2025. Key observations:
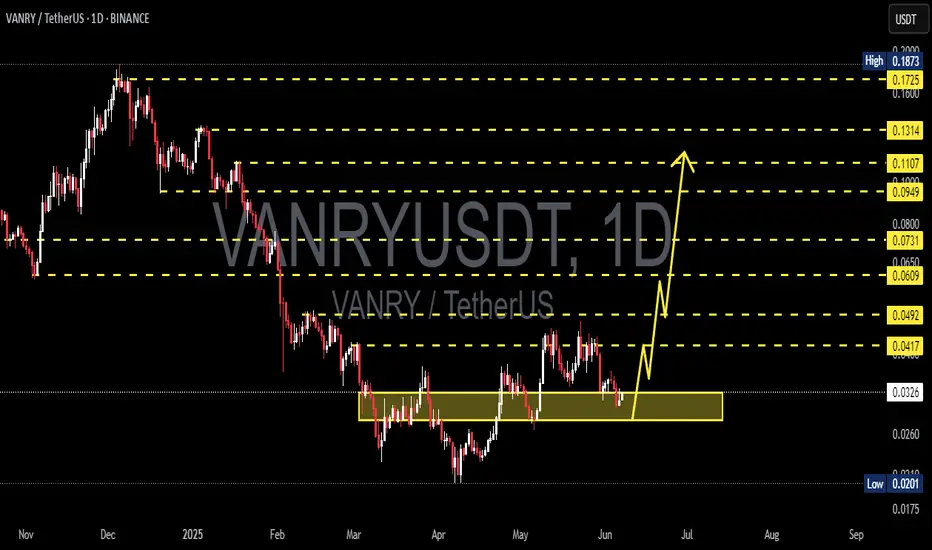
Price is stuck inside the demand zone 0.028 – 0.036 USDT (yellow box), which has acted as strong support for months.
A symmetrical triangle pattern is forming, indicati
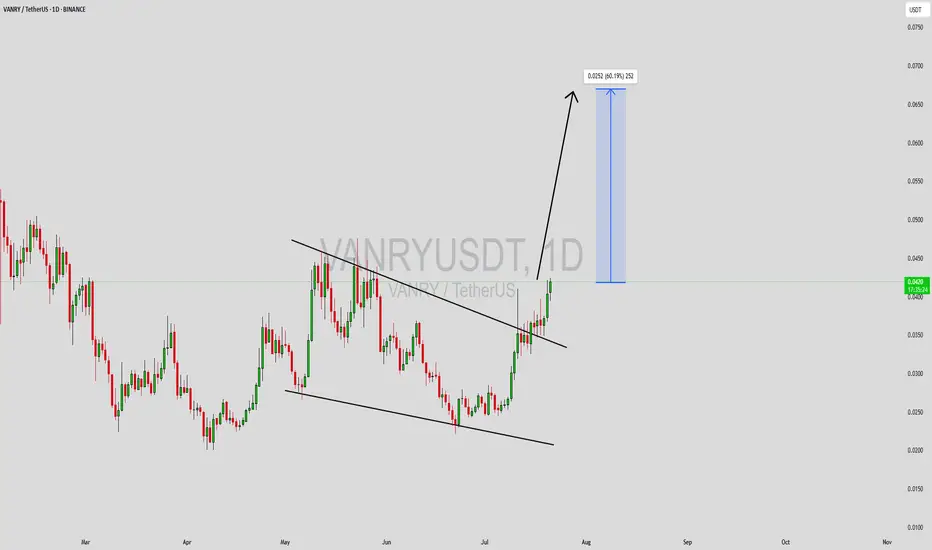
VANRYUSDT Forming Potential BreakoutVANRYUSDT is currently showing a potential breakout pattern, making it one of the more exciting altcoins to keep an eye on in the short term. The price structure has tightened in recent sessions, often a precursor to explosive movement. With strong volume backing the recent price action, the possibi
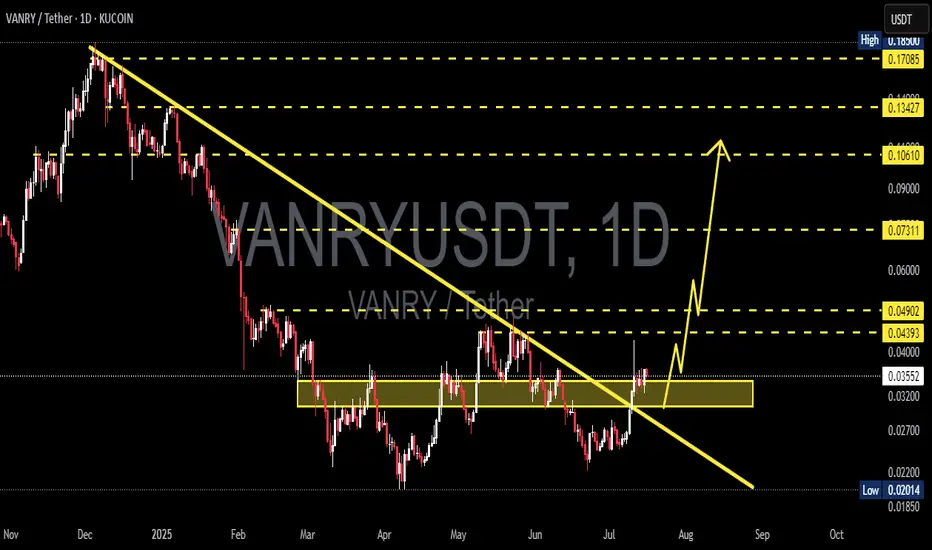
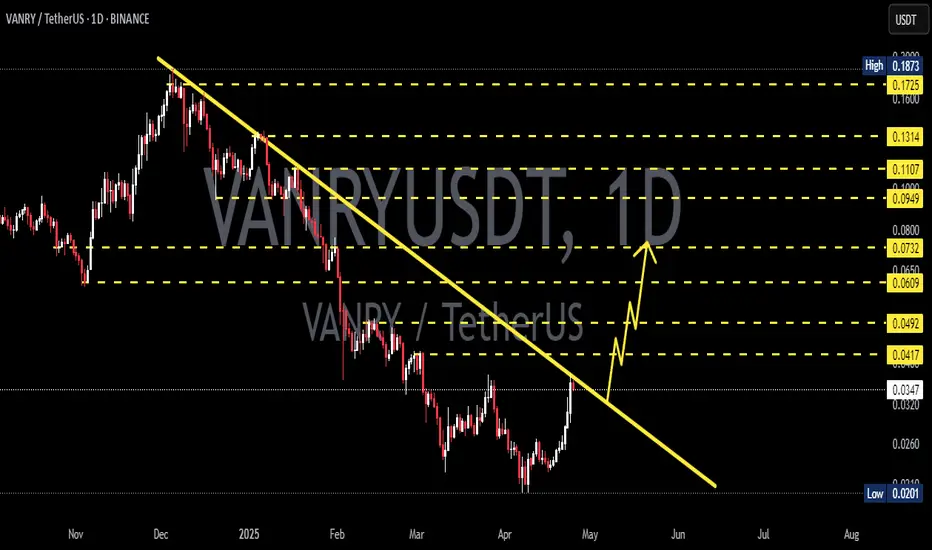
VANRY/USDT: Major Breakout from Downtrend – Is This the Start?
After months of downward pressure, VANRY/USDT has finally shown a strong technical breakout, potentially marking a shift in momentum and the beginning of a bullish phase.
📊 Technical Pattern & Market Structure
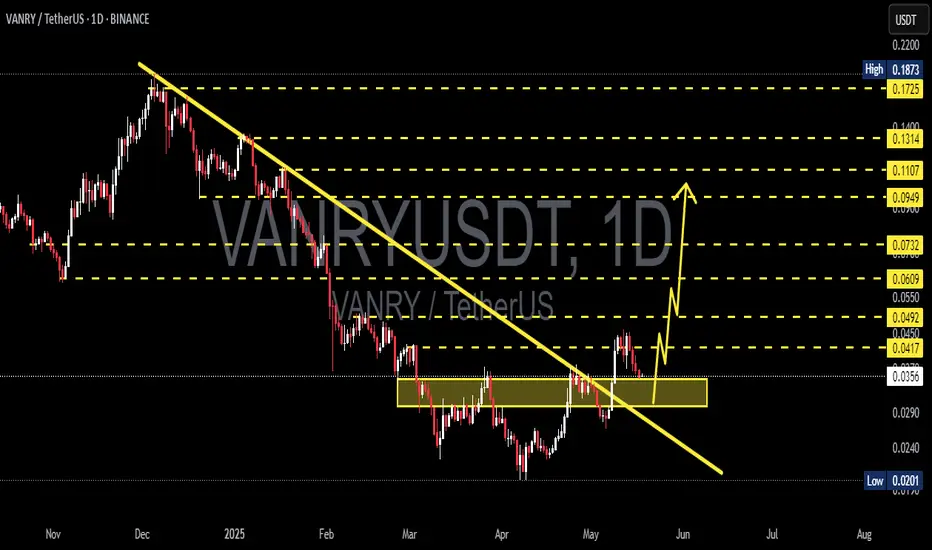
🔻 1. Descending Trendline Breakout
Price has successfully broken above a long-term de
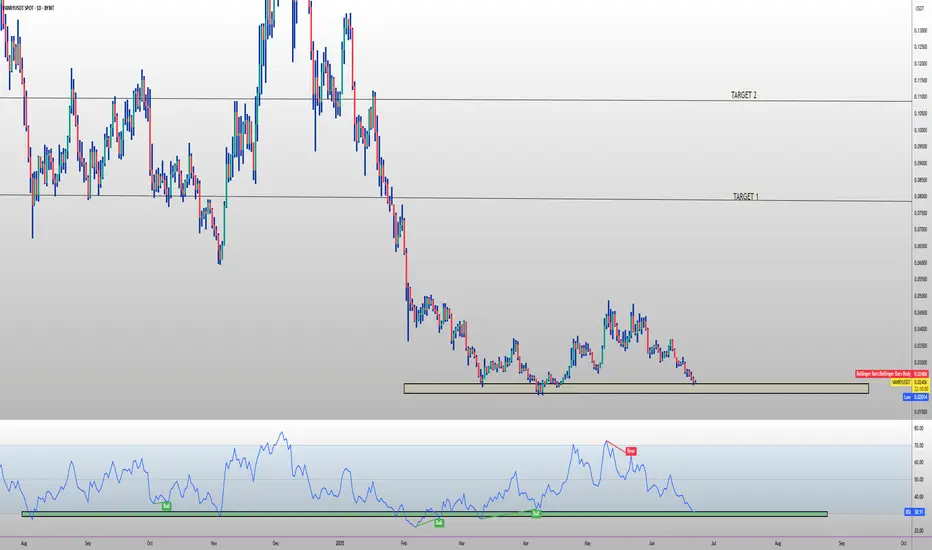
VANARY UPDATE FOR 2025 🔥 $VANRY long setup (1 D) 🚀
✅ Entry Zone: $0.020 – $0.0241 (2025 demand + wedge apex)
🎯 Targets
• TP-1: $0.08 (Q4-24 supply flip)
• TP-2: $0.125 (Mar-24 breakdown block)
⛔ Stop-Loss
Daily close < $0.016
📊 Thesis
• Vanar → first AI-native L1: built-in models & on-chain data 🤖
• Proof-of-Reputati
VANRYUSDT 1D AnalysisVANRY ~ 1D Analysis
#VANRY Buy back gradually from here if you still have confidence in this coin with a short term target of at least 15%++
VANRYUSDT 1D Analysis VANRY ~ 1D Analysis
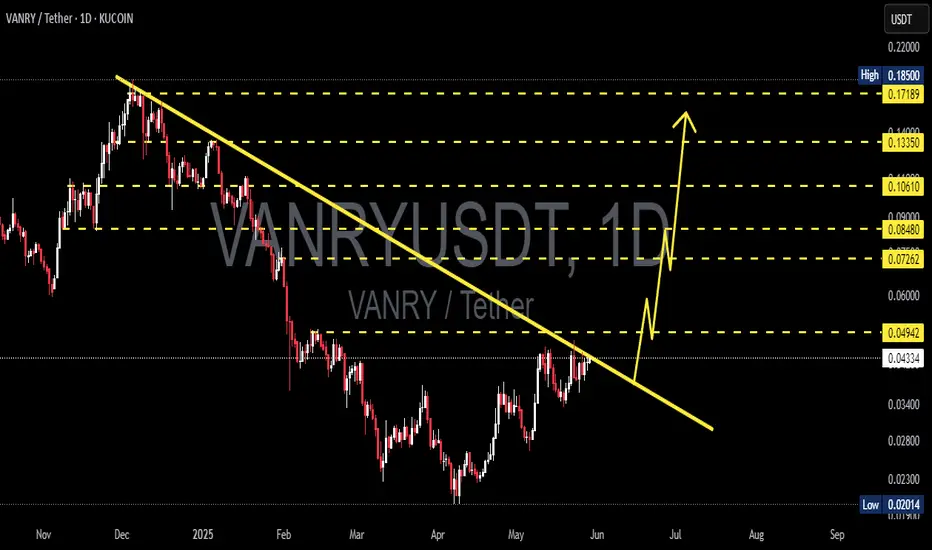
#VANRY Buy gradually after successfully breaking through this resistance line with a short-term target of at least 15%+ And long term target $0.185
VANRYUSDT 1D VANRY Analysis VANRY ~ 1D Analysis
#VANRY Buy back gradually from here if you still have confidence in this coin with a short term target of at least 15%+ from here.
#VANRY/USDT#VANRY
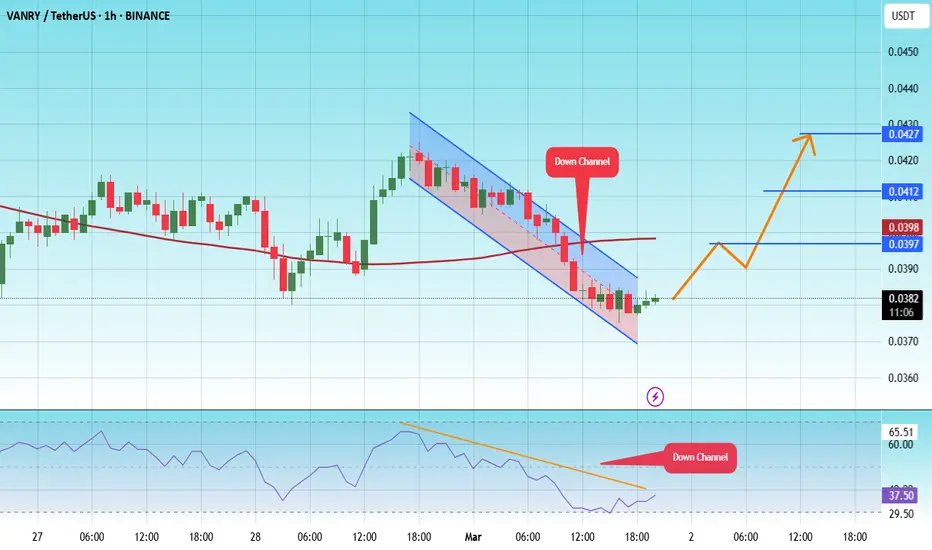
The price is moving in a descending channel on the 1-hour frame and is expected to continue upwards
We have a trend to stabilize above the moving average 100 again
We have a descending trend on the RSI indicator that supports the rise by breaking it upwards
We have a support area at the l
5-wave Elliot structure! After a perfect bounce, VANARY is struggling with 3 major resistance now. first the ~$0.03665 level; second, the trend line which is suppressing the bullish momentum for about 3 months; third, a bearish RSI divergence almost in all time frames. here's a trade setup:
Long it if it breaks ~$0.03665:

VANRYUSDT 1D AnalysisVANRY ~ 1D Analysis
#VANRY Buy after successfully penetrating this resistant line with a short -term target of at least 10%+ from here.
See all ideas
Summarizing what the indicators are suggesting.
Oscillators
Neutral
SellBuy
Strong sellStrong buy
Strong sellSellNeutralBuyStrong buy
Oscillators
Neutral
SellBuy
Strong sellStrong buy
Strong sellSellNeutralBuyStrong buy
Summary
Neutral
SellBuy
Strong sellStrong buy
Strong sellSellNeutralBuyStrong buy
Summary
Neutral
SellBuy
Strong sellStrong buy
Strong sellSellNeutralBuyStrong buy
Summary
Neutral
SellBuy
Strong sellStrong buy
Strong sellSellNeutralBuyStrong buy
Moving Averages
Neutral
SellBuy
Strong sellStrong buy
Strong sellSellNeutralBuyStrong buy
Moving Averages
Neutral
SellBuy
Strong sellStrong buy
Strong sellSellNeutralBuyStrong buy
Displays a symbol's price movements over previous years to identify recurring trends.