VANRYUSDTVANRY ~ 2D
#VANRY Do you have Conviction on this Coin. If yes, you need to pay attention to this key Support. We think it's going to be a pretty strong reversal from here.
Market insights


VANRY Price Update & Analysis in a Daily Timeframe.Hello everyone, I’m Cryptorphic.
I’ve been sharing insightful charts and analysis for the past seven years.
Follow me for:
~ Unbiased analyses on trending altcoins.
~ Identifying altcoins with 10x-50x potential.
~ Futures trade setups.
~ Daily updates on Bitcoin and Ethereum.
~ High time frame (HTF) market bottom and top calls.
~ Short-term market movements.
~ Charts supported by critical fundamentals.
Now, let’s dive into this chart analysis:
The beginning of August was tough for the crypto market, and VANRY suffered along with it. The price dropped as low as $0.0675 but managed to close at $0.0772, creating strong support.
VANRY has shown a decent rebound of 42% from the support level and is likely to test the $0.1455 resistance channel. The price has already broken above the dotted resistance trendline and the 21 EMA.
Key levels:
- Primary Support: 21 EMA and the dotted trendline at $0.0980.
- Lower Support: $0.0768.
- Primary Resistance: $0.1455.
- Long-term Target: $0.3937.
DYOR, NFA.
Please hit the like button to support my content and share your thoughts in the comment section. Feel free to request any chart analysis you’d like to see!
Thank you!
#PEACE

VANRYUSDT.1DThe chart for VANRY/USDT on a daily timeframe depicts a bearish trend over the past few months. Notably, the price has steadily declined from highs around $0.2480 in May to current levels near $0.0899. This is encapsulated within a descending channel, marked by resistance (R1) and support (S1) lines that frame the price action.
The Moving Average Convergence Divergence (MACD) indicator, as shown below the price chart, supports this bearish view. The MACD line (blue) remains below the signal line (orange)
and both are trending downwards below zero, which typically signals a strong bearish momentum.
Furthermore, the Relative Strength Index (RSI), which is at approximately 39, indicates that the asset is nearing oversold territory but is not there yet. This suggests that there might still be room for further downward movement before any significant reversal could occur.
In light of these observations, the immediate outlook for VANRY/USDT remains bearish. The price is currently testing the lower boundary of the descending channel (S1). Should it break this level, it could potentially accelerate the decline towards newer lows. Conversely, if the price rebounds from this support, an upward retest of the upper boundary of the channel (R1) at around $0.1479 could occur, although this scenario appears less likely given the prevailing downward momentum.
Investors and traders should monitor these levels closely, as a breach or bounce could offer significant trading opportunities. It is also crucial to consider broader market sentiments and news that may impact the asset's price movements.

VANRY way to 10$TVK Rebrands to Vanry approximately in Nov 23
$VANRY Buy Opportunity
Vanry, formerly known as TVK, presents a compelling investment opportunity.
Key Points:
$VANRY is currently forming a significant inverse head and shoulders pattern.
Buy Zone: $0.057-$0.076
#HODL for #100x
Final Expected Target for the inverse head and shoulders pattern: $10
During times of market fear, strategic buying in promising projects becomes crucial.
#DYOR
#NFA
Your support through likes, follows, and reposts is appreciated.

Bullish Corrections: Heading Towards $0.1100Analysis:
Following the impact of yesterday's news, VANRYUSDT is showing signs of bullish corrections. The price has been correcting from the $0.0960 price region and is now making its way towards the $0.1100 price point.
Key Points:
News Impact: Recent positive developments have sparked renewed interest and confidence in Vanary (VANRY), leading to increased buying pressure.
NFP Impact: The Non-Farm Payroll (NFP) report released today significantly affected the market. As a result, we observed a Bitcoin price drop, which caused traders to panic sell across the crypto market. Despite this, VANRYUSDT is demonstrating resilience and a bullish correction.
Support Level: The $0.0960 region has shown strong support, acting as a solid foundation for the current upward movement.
Target: Based on current market momentum and technical indicators, the next significant resistance level appears to be around $0.1100.
Technical Indicators:
Moving Averages: The 50-day and 200-day moving averages are converging, indicating potential for a bullish crossover.
Relative Strength Index (RSI): Currently trending upwards, suggesting increasing buying momentum.
Volume: There has been a noticeable uptick in trading volume, supporting the bullish outlook.
Conclusion:
With the support at $0.0960 holding strong and the market reacting positively to recent news, VANRYUSDT is poised for a move towards $0.1100. The market's response to the NFP report, causing a Bitcoin price drop and subsequent panic selling, adds an extra layer of volatility to monitor. Traders should watch for potential pullbacks and confirm the uptrend with volume and momentum indicators.
Disclaimer: This analysis is for informational purposes only and should not be considered financial advice. Always do your own research before making any trading decisions.

VANRY/USDT Approaching Support (SELL)The price is approaching the support level of 0.1021, identified on July 25. This pattern is still in the process of forming, indicating a potential bearish price movement. There is a possibility of the price declining towards the support level of 0.1021 within the next 8 days. Traders should watch this pattern and consider the potential for further downward movement in their trading strategies.

This cryptocurrency is set to explode!After bouncing back from a strong support level, the price signaled a reversal. It then broke through the moving average and stabilized above it. Consequently, I have taken long positions from these levels, targeting a 50% retracement from the recent low, as illustrated in the chart analysis.
Don't miss out on this opportunity! 🚀📈

VANRY Technical Analysis in Daily TimeframeHello everyone, I’m Cryptorphic.
For the past seven years, I’ve been sharing insightful charts and analysis.
Follow me for:
~ Unbiased analyses on trending altcoins.
~ Identifying altcoins with 10x-50x potential.
~ Futures trade setups.
~ Daily updates on Bitcoin and Ethereum.
~ High time frame (HTF) market bottom and top calls.
~ Short-term market movements.
~ Charts supported by critical fundamentals.
Now, let’s dive into this chart analysis:
VANRY is under a bullish flag pattern and is currently showing a rebound, holding the support at $0.0982.
If $VANRY breaks above the bullish flag pattern resistance, then we are likely to see a rally targeting the all-time high level.
Key levels:
- Support: $0.0982.
- Primary Resistance: $0.180.
- Target: $0.3837.
- Invalidation Point: A close below the support level.
DYOR, NFA.
Please hit the like button to support my content and share your thoughts in the comment section. Feel free to request any chart analysis you’d like to see!
Thank you!
#PEACE

VANRY/USDT : Navigating the Uptrend with Strategic EntriesThe cryptocurrency market continues to evolve, and VANRY coin has been showing promising signs of growth. Currently in an uptrend, the market for VANRY is trading within a parallel channel. However, the potential for a breakout is becoming increasingly likely. Let's take a closer look at the current market dynamics and strategic entry points for VANRY.
Current Market Performance
VANRY coin is presently trading at $0.1294, maintaining its position within an upward parallel channel. Traders and investors are closely watching this formation, anticipating a breakout that could signal further bullish momentum. A notable indicator of this potential is the formation of the luftwing candle, a bullish signal that often precedes significant upward movements.
Key Technical Indicators
Parallel Channel: The market is confined within an upward parallel channel, suggesting a steady uptrend. A breakout from this channel could lead to accelerated price increases.
Luftwing Candle: The recent formation of the luftwing candle indicates the beginning of bullish signals, reinforcing the potential for a breakout.
Double Top Structure: However, there is also a formation of a double top structure, which typically signals a downward correction. This pattern suggests caution as it indicates the potential for a bearish turn if the correction breaks the market structure.
Strategic Entry Points
For those looking to capitalize on VANRY's movements, key entry points to watch are $0.1241 and $0.1204. These levels present potential buying opportunities if the market experiences a downward correction before resuming its upward trajectory.
Market Sentiment and Outlook
While the overall sentiment in the crypto space is not exceedingly bullish, the technical indicators for VANRY suggest a mixed outlook. The formation of a double top indicates a possible downward correction. If this correction breaks the market structure, a bearish continuation could ensue. However, this scenario is currently less likely, considering the bullish signals such as the luftwing candle and the overall uptrend within the parallel channel.

VANRY/USDT PROCESS NEW RUN WITH HIGH VOLUMEDependng in last data vary seems to enter new uptrend.
checking the coming time frames for new confirmations.
High interest for Vanry for volume coming time.

Vanry - bullish ideaI am pretty bullish on Vanry - Vanar.
They are working hard on AI and games.
They partnered with NVIDIA
actually a lot of positive sentiment
Watch my idea, and let's see if it will play out...
NFA

VANRY/USDT: Watching Retest After Breakout - Time to ENTER?Heads up, crypto traders!
VANRY/USDT is making some interesting moves on the charts.
Here's the situation:
VANRY/USDT recently broke out of a falling wedge pattern, which can be a bullish technical indicator.
Currently, the price is retesting the upper trendline of the wedge.
We can expect a good upside move if the price holds this retest level.
Entry zone:- $0.124-$0.134
Targets:- $0.154/$0.168/$0.185/$0.198
SL:- 4hr candle close below $0.124
What are your thoughts on VANRY/USDT? Share your analysis in the comments below!

Vanry Usdt Technical Analysis The VANRY/USDT pair is trading at a key support zone (Green) between $0.1333 and $0.1398, which has proven to be a strong area from which the price could bounce.
If the price successfully flips the immediate resistance level at $0.1569, it may go towards the descending trend line, which might act as a powerful barrier to further upward movement.
After a strong breakout from the trend line, there is a major resistance zone (blue) between $0.2399 and $0.2530; by flipping this blue zone, we might see the vanry price reach new highs.
The descending trendline from the March 2024 highs continues to exert downward pressure, showing that bearish forces are still strong.
To predict future movements, traders should look for important price levels and volume spikes, which indicate the strength of any breakthrough or breakdown.
If the price fails to hold the Green zone and breaks down from here, it may fall to the next support level at $0.0993, with further drops potentially revisits the last zone highlighted in Yellow on the chart at $0.0769 - $0.0812.
Remember to always use a stop loss to protect your capital.
Everything is on the chart.

vanryIn the short term, it has a resistance. If it crosses, the above targets are available. If it corrects up to the green line, it should be checked. But in my opinion, buying at the lower and blue points

VANRY ANALYSIS (4H)From the place where we put a red arrow on the chart, it seems that the VANRY correction has started.
It looks like we have an ABC or a more complicated pattern.
Wave B is a triangle that we are now at the end of this triangle.
It is expected that the bell will drop down by keeping the red frame.
Closing a daily candle above the invalidation level will violate the analysis.
For risk management, please don't forget stop loss and capital management
Comment if you have any questions
Thank You

VANRYSubject to breaking the descending trend, it will head towards the targets indicated on the chart.
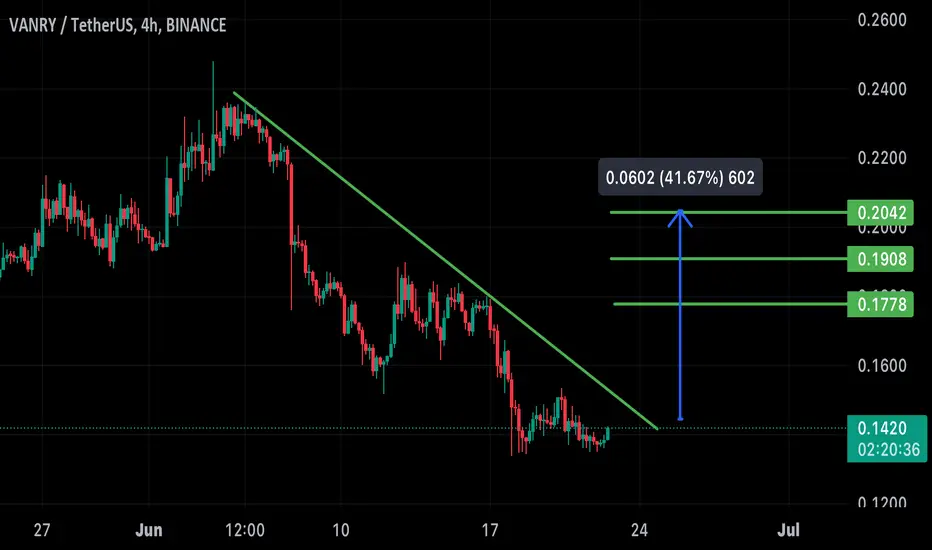
VANRYSubject to breaking the descending trend, it will head towards the targets indicated on the chart.

Testing the supportThe price is currently testing the support area at $0.136. It is important to monitor if this level can hold. If the support holds, there is potential for the price to move up towards the resistance area at $0.152.

VANRYUSD 1DVANRY ~ 1D
#VANRY Make small purchases in these demand zones. with a minimum target of 15%+

VANRYUSDT-Symmetrical Triangle#VANRY/USDT is forming a triangle on daily timeframe👀
Waiting to move up🐃

$VANRY; ONE TO WATCH $Vanry just broke out of an accumulation phase.. One to watch in coming weeks..

prision break ?I am monitoring the possible exit from the ceiling of the green pattern in the next minutes or hours
Maybe the breaking of the ceiling will cause a good movement of the currency
