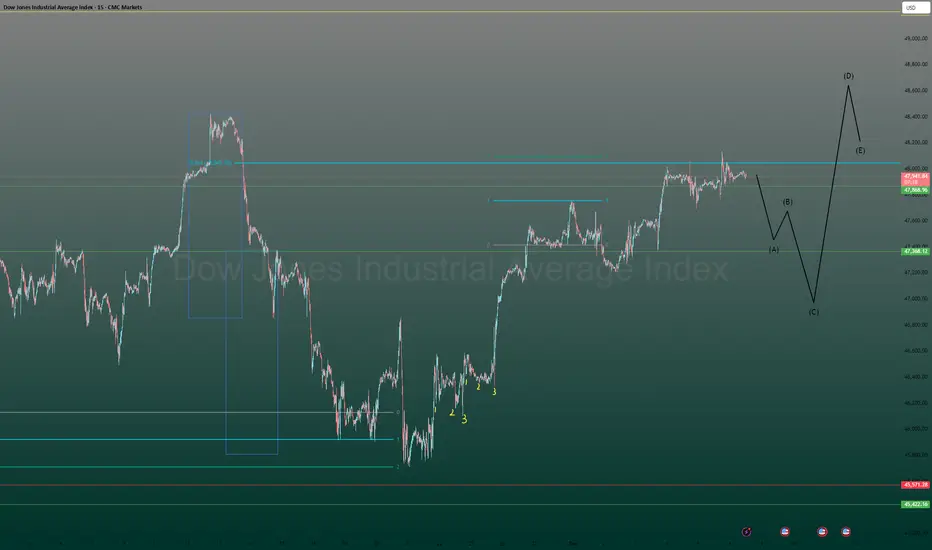
US30 Scaling Setup – Pullback to 48k Targeting 50,000 Year EndUS30’s near highs (~48,500–49,000), but a pullback to 48,000 looks likely as we await the first US unemployment rate release since the 43-day government shutdown—a highly anticipated event. Here’s my plan to scale longs and hit 50,000 by Thursday/Friday:
Setup:
Area of Interest (AOI): Targeting ~47,800–48,200 (around 48,000), a high-volume support zone (volume profile) with past buyer activity.
Confirmation: Enter on stalling bearish momentum (e.g., RSI ~50, MACD histogram flattening, bullish pin bars on 4H/1H).
Strategy:
Initial Entry: Small position (0.01 lot) at 48,000 to scalp intra-day bounces.
Scaling In: Add a 2x larger position (0.02 lot) at 47,800 if price drops, building exposure.
Target: Aim for 50,000 (psychological resistance) by Thursday/Friday, December 18–19, post-unemployment data. Close all trades at target or if 4H closes below 47,800 (bearish resumption).
Position Management: Trail stops to lock in profits (e.g., breakeven at +0.2%, trail to 0.5% portfolio gain). This trade fits my broader portfolio (e.g., XAUUSD, EURUSD), with adjustments based on weekly performance.
Risk Management:
Cap risk at 1–2% per trade, 10% portfolio max (per FTMO rules). Stops at 47,500 (initial) and 47,000 (scaled). Diversify with XAUUSD/EURUSD to spread exposure. Reserve margin for event volatility.
Key US Economic Events (Times EST):
*** Tuesday, Dec 16, 8:30 AM: Nonfarm Payrolls (Oct/Nov, delayed). Forecast: ~40,000 (Nov, per). Weak (<20,000) could rally US30 to 50,000; strong (>100,000) may deepen pullback to 47,800.
*** Tuesday, Dec 16, 8:30 AM: Unemployment Rate (Nov). Forecast: ~4.4% (per). First release since shutdown (September: 4.4%, highest since 2021). A spike (>4.7%) could trigger risk-off to 47,000; steady (~4.4%) may support 50,000.
*** Tuesday, Dec 16, 8:30 AM: Retail Sales (Nov). Forecast: +0.4% m/m (per). Weak (<0.2%) may push to 47,000; strong (>0.6%) could delay pullback.
*** Thursday, Dec 18, 8:30 AM: Initial Jobless Claims (week ending Dec 13). Forecast: ~220K (per). High (>250K) supports US30; low (<200K) caps upside.
Market Context:
US30’s up 17% YTD but faces resistance at 50,000 (per,). RSI (~55) and MACD flattening suggest a pullback to 48,000, a high-volume zone (November 2025, per,). The Nov unemployment rate (Tuesday), the first since the shutdown, is a major catalyst—steady data could fuel a rally to 50,000; a spike may trigger risk-off. Volatility’s 1–2% daily (~500–1000 points), ideal for scaling longs post-data.
Risk Warning:
The unemployment rate release could spike volatility. Keep risk at 1–2% per trade, diversify, and use tight stops. Trade your plan!
What’s your US30 play this week? Share your setups below!
#US30 #DowJones #Scalping #Unemployment #EconomicEvents
Market insights


DowJones key trading levels ahead of FOMC rate decision Key Support and Resistance Levels
Resistance Level 1: 47967
Resistance Level 2: 48132
Resistance Level 3: 48325
Support Level 1: 47400
Support Level 2: 47200
Support Level 3: 46840
This communication is for informational purposes only and should not be viewed as any form of recommendation as to a particular course of action or as investment advice. It is not intended as an offer or solicitation for the purchase or sale of any financial instrument or as an official confirmation of any transaction. Opinions, estimates and assumptions expressed herein are made as of the date of this communication and are subject to change without notice. This communication has been prepared based upon information, including market prices, data and other information, believed to be reliable; however, Trade Nation does not warrant its completeness or accuracy. All market prices and market data contained in or attached to this communication are indicative and subject to change without notice.
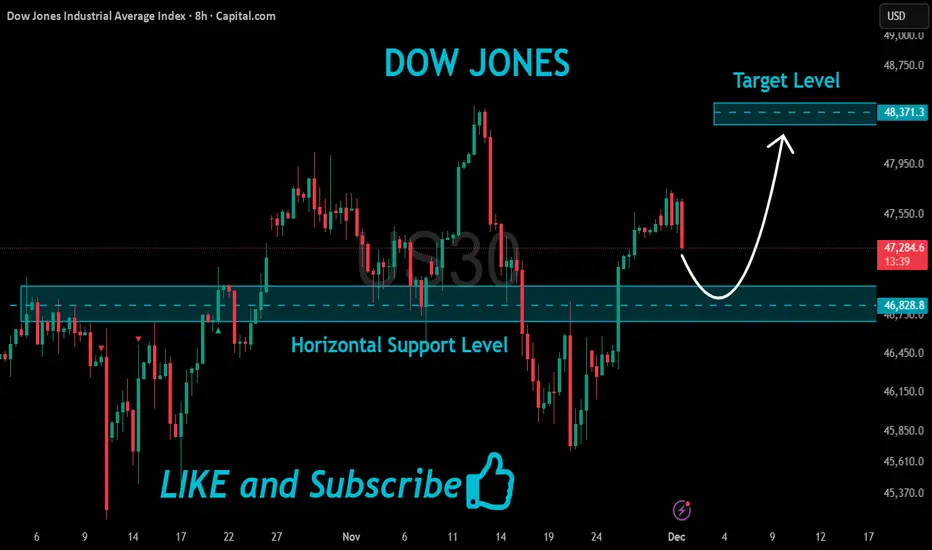
US30 Risky Long!
HI,Traders !
#US30 is about to retest
A horizontal support level
Of 46828.8 while trading
In a local uptrend so
We will be expecting a
Local bullish rebound
And a further move up !
Comment and subscribe to help us grow !
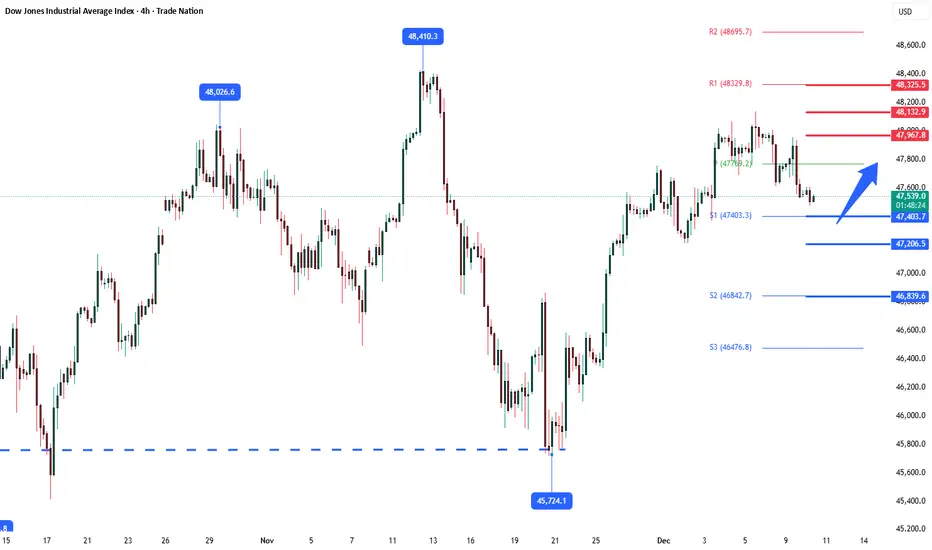
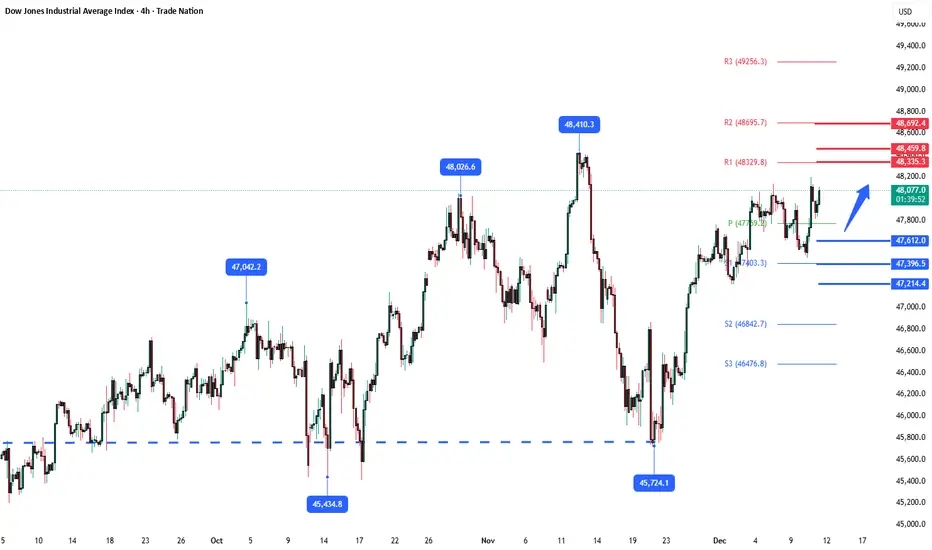
DpwJones Key Trading LevelsKey Support and Resistance Levels
Resistance Level 1: 48335
Resistance Level 2: 48460
Resistance Level 3: 48690
Support Level 1: 47610
Support Level 2: 47390
Support Level 3: 47210
This communication is for informational purposes only and should not be viewed as any form of recommendation as to a particular course of action or as investment advice. It is not intended as an offer or solicitation for the purchase or sale of any financial instrument or as an official confirmation of any transaction. Opinions, estimates and assumptions expressed herein are made as of the date of this communication and are subject to change without notice. This communication has been prepared based upon information, including market prices, data and other information, believed to be reliable; however, Trade Nation does not warrant its completeness or accuracy. All market prices and market data contained in or attached to this communication are indicative and subject to change without notice.
Is the Dow Jones Setting Up for Another Major Leg Up?The Dow Jones continues to follow its larger bullish structure, and the recent rotation fits perfectly within the expected geometric path.
As long as the current demand zone holds, momentum is preparing for another push to the upside — but the market will not move in a straight line.
I’m monitoring the chart moment by moment, like a hunter waiting for the perfect entry as price approaches the key zones.
I’ll highlight the critical turning points as they develop in real time.
US30: Targeting the Top of the Upward Channel via Two RetracemenUS30 continues to climb within a broad upward-sloping channel, and the bias remains toward a run into the channel high.
US30 – PREMIUM OUTLOOK | Momentum Shifts at Key Resistance ZoneUS30 – Technical Overview
US30 continues to show bearish momentum as long as price remains below 47920 and 48020, with downside targets at 47720 and 47560.
Price action in this zone remains sensitive, and sellers maintain control while the index trades under these resistance levels.
However, if the market closes a 1H candle above 48020, this would signal a shift in momentum and open the way for a bullish move toward 48410.
Key Levels
Pivot Line: 47920
Support: 47730 · 47560 · 47460
Resistance: 48020 · 48320 · 48410
previous idea:

US30: What’s Forming?US30 has extended its upward move, but the latest slowdown suggests a developing consolidation phase rather than a completed trend. The structure is shaping into a potential corrective pattern, indicating that the market may still be preparing for another push once this pause finalizes. With momentum moderating, the next decisive move could unfold soon, making this an interesting setup to monitor closely.
**Disclosure:** We are part of Trade Nation's Influencer program and receive a monthly fee for using their TradingView charts in our analysis.
DOW JONES — Bullish Momentum AwakeningHigh R:R Setup | When Smart Money moving in**
The Dow Jones is entering the same structural phase that typically precedes strong and sustained bullish expansions.
Smart Money has completed a clean liquidity sweep beneath recent lows, and price is now shifting into a clear expansion phase.
🔹 Why I remain strongly bullish
1. Confirmed Break of Structure
A decisive break above the last lower highs gives the first Smart Money signal for trend continuation.
2. Perfect Liquidity Grab at the Lows
The classic sweep before major bullish impulses.
Stops cleared → Smart Money positioned.
3. Orderflow is clearly bullish
Both 4H and Daily show buyer dominance with strong, impulsive candles.
4. Extremely high Risk–to–Reward available
On the first clean pullback, the setup offers R:R between 1:40 and 1:125, depending on entry precision.
🎯 Primary Bullish Scenario
As long as price holds above 46300, the bullish structure remains fully valid.
Upside targets:
48,600
49000
Final target: 49400
All levels are aligned with market geometry, liquidity maps, and Fibonacci extension zones.

US30 reflected by the upper bandIn my opinion, the upper band will reflect US30 and will go down to the lower one.
If the lower is crossed, expect more bearish.
The US 30 could stay more days between this interval - expected end of the week.

Long on Dow, expecting new highs-Dow formed bellow an inverse head and shoulders pattern, after a deep correction waiting for new highs on It

US30 – Fake Breakout Reversal Toward 48,500 $From my market view the US30 made a fake breakout above my resistance zone
This liquidity grab trapped sellers before price quickly bounced back upward showing that buyers still control the trend
At this point I expect the market to continue pushing higher toward the 48500 $ which represents
As long as price remains above the fake-breakout zone, the bullish scenario remains valid

DOW/US30 - BEAUTIFUL CHART Team, I am looking at the US30/DOW - whatever you call it
look beautiful on the 5/15 minutes channel
Sorry, i been too lazy to post because lately I've been doing scalping
I am about to prove another challenge where $1000 turns into a million
Last account $1000 turned into 100k, took 6 months
But this challenge, I am not sure.
Anyway lets focus on the trade right now
the price is 47590-99 - long entry
STOP LOSS at 47550
Target 1 at 47650-47666
Target 2 at 47701-47715
Target 3 at 47760-47781
LETS GO
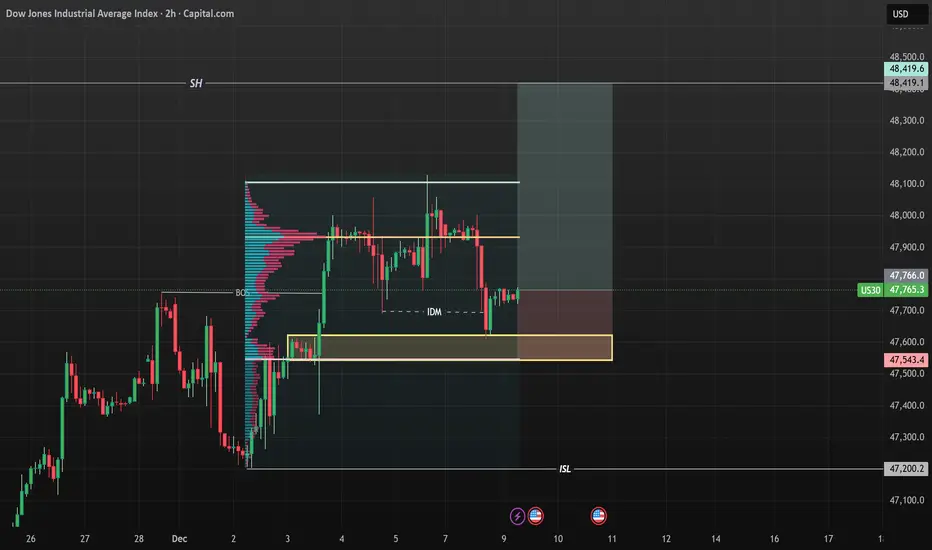
US30 BUY NOW!!!!!!!US30 take out the recent previous internal structure high and made an inducement with a proper price rejections off the demand zone am looking forward to see price maintain a bullish bias moves till price arrives 48,419....
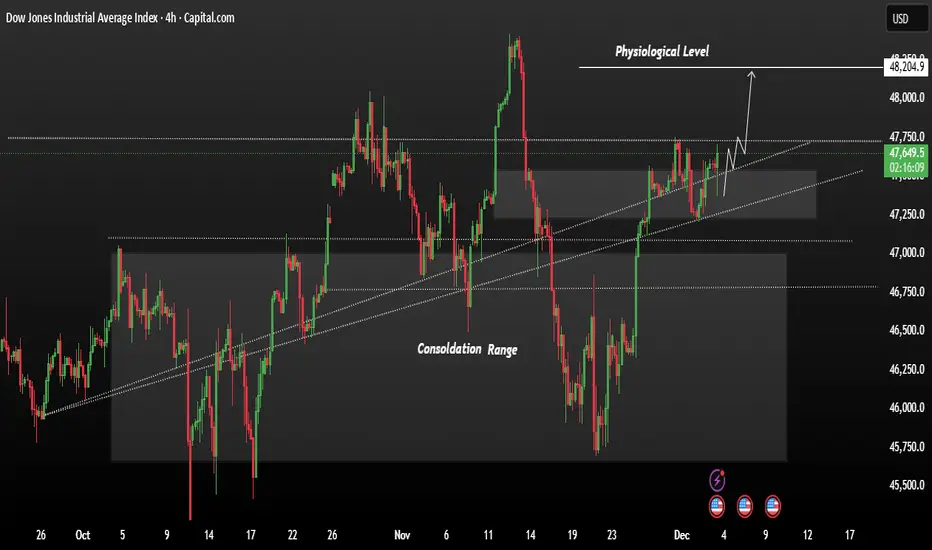
US3O showing strong bullish momentumUS30 is trading in a steady upward channel after breaking out of its previous consolidation range. Price is holding above support and showing strong bullish momentum.
As long as it stays above the current breakout zone, the market is positioned to push higher toward the next psychological level around 48,205. Buyers remain in control, and any pullbacks into the trendline support may attract fresh buying pressure.
If the price test the support level after again price range bullish from the current range we could expect price remains chance for bullish pattern.
You may find more details in the chart.
Trade wisely best of Luck buddies.
Ps; Support with like and comments for better analysis thanks for supporting.
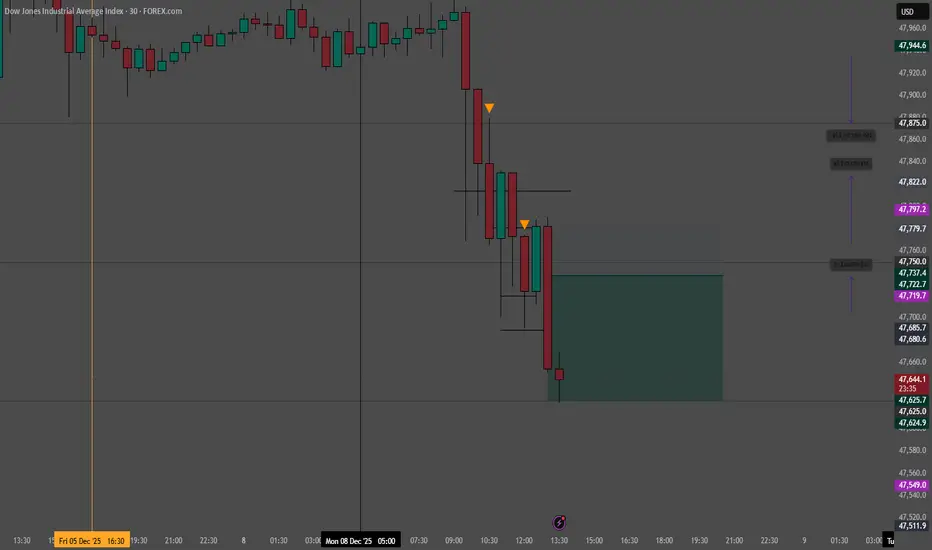
US30 Short Bias | Resistance Rejection SetupUS30 is showing bearish pressure near the 48,000 zone, which is acting as a short-term resistance area. Price rejection from higher levels suggests weakening bullish momentum and potential continuation to the downside. Lower highs on the intraday timeframe indicate sellers are in control.
Trade Plan:
As long as price remains below 48,050, the bearish setup stays valid. A move toward 47,200 is expected if selling pressure continues. Trail stop once price moves in profit to secure gains.
KEY LEVELS
Entry 48,000
Target 47,200
Stop Lose 48,050

DowJones Key support at 47530 Key Support and Resistance Levels
Resistance Level 1: 48132
Resistance Level 2: 48276
Resistance Level 3: 48420
Support Level 1: 47530
Support Level 2: 47366
Support Level 3: 47185
This communication is for informational purposes only and should not be viewed as any form of recommendation as to a particular course of action or as investment advice. It is not intended as an offer or solicitation for the purchase or sale of any financial instrument or as an official confirmation of any transaction. Opinions, estimates and assumptions expressed herein are made as of the date of this communication and are subject to change without notice. This communication has been prepared based upon information, including market prices, data and other information, believed to be reliable; however, Trade Nation does not warrant its completeness or accuracy. All market prices and market data contained in or attached to this communication are indicative and subject to change without notice.

US30 Trading Opportunity! SELL!
My dear friends,
Please, find my technical outlook for US30 below:
The instrument tests an important psychological level 47934
Bias - Bearish
Technical Indicators: Supper Trend gives a precise Bearish signal, while Pivot Point HL predicts price changes and potential reversals in the market.
Target - 47694
About Used Indicators:
Super-trend indicator is more useful in trending markets where there are clear uptrends and downtrends in price.
Disclosure: I am part of Trade Nation's Influencer program and receive a monthly fee for using their TradingView charts in my analysis.
———————————
WISH YOU ALL LUCK

DJI: Dow jones industrial index bear trend in makingDue to divergence on RSI and MCAD, the price will have a pull back as showed. its simple but i think it will follow my idea


US30 SellsWe're on track folks! I'm on a prop firm you can check the link. I use Tradingview as a POV and I place trades on TradeLocker! Target hit my first TP as we speak!
US30 analysisFirst post! I wanted to try something different and new by posting my understandings of US30. US30 tends to fake out before the real move. In my chart I like to label what I would consider whole number quarter levels. I like to wait to see some sort of opposite candle of the overall potential continuation. My Take profits are usually from 600-1250 of a continuance of the move for the day.