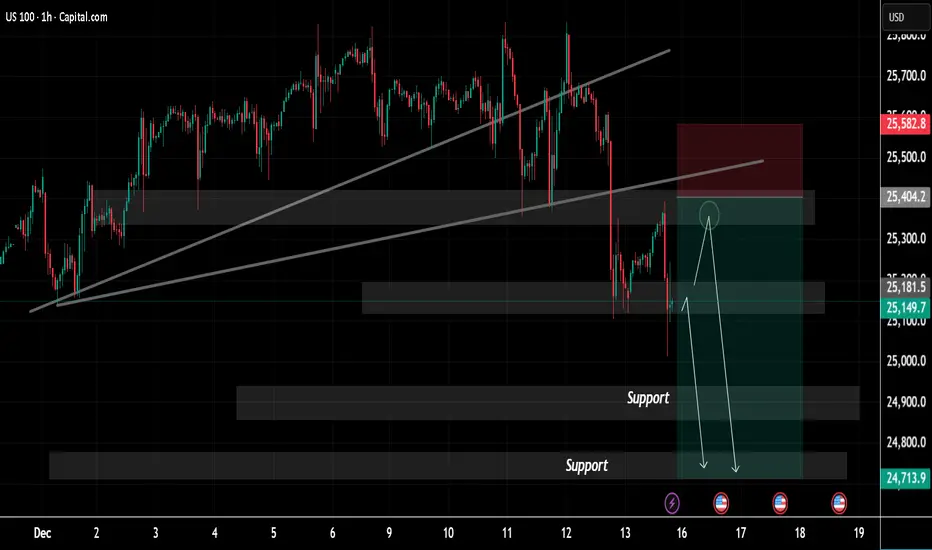
USNAS100 Price Update Clean Clear ExplanationUS100 on the 1-hour timeframe, highlighting a shift in market structure from bullish to bearish Price was previously moving within an ascending channel, respecting higher highs and higher low a strong bearish breakdown occurred, with price decisively breaking below the rising trendline, indicating a loss of bullish momentum the sharp sell-off suggests institutional distribution and a potential trend reversal.
Resistance Zone (≈ 25,400 – 25,580)
Immediate Support (≈ 25,150 – 25,200)
These are marked demand/support areas and are likely downside targets if bearish momentum continues we could see support 24,900 to 24,700
The projected arrows indicate a possible retracement toward resistance, followed by continuation to the downside as long as price remains below the broken trendline and resistance zone, the bearish bias remains valid buyers appear weak, while sellers maintain control.
If you find it helpful please like and comments for this post and share thanks.
Market insights
Nasdaq-100: Lower Low and Lower High?The Nasdaq-100 made a lower low, and now it might have made a lower high.
The first pattern on today’s chart is the November 21 low of 23,854, some 353 points below the October trough. That broke a series of higher lows since April.
Second, the tech-heavy index peaked at 25,835 on December 10. That was 347 points under the all-time record on October 29. That could represent a lower high after the lower low, potentially breaking seven months of uptrend.
Third, NDX stalled last week near October 31’s weekly close. That could suggest resistance has developed below the recent high.
Next, stochastics are dipping from an overbought condition.
Finally, prices are sliding below their 21-day exponential moving average and 50-day simple moving average. Those signals may reflect emerging weakness in the short- and intermediate-term timeframes.
TradeStation has, for decades, advanced the trading industry, providing access to stocks, options and futures. If you're born to trade, we could be for you. See our Overview for more.
Past performance, whether actual or indicated by historical tests of strategies, is no guarantee of future performance or success. There is a possibility that you may sustain a loss equal to or greater than your entire investment regardless of which asset class you trade (equities, options or futures); therefore, you should not invest or risk money that you cannot afford to lose. Online trading is not suitable for all investors. View the document titled Characteristics and Risks of Standardized Options at www.TradeStation.com . Before trading any asset class, customers must read the relevant risk disclosure statements on www.TradeStation.com . System access and trade placement and execution may be delayed or fail due to market volatility and volume, quote delays, system and software errors, Internet traffic, outages and other factors.
Securities and futures trading is offered to self-directed customers by TradeStation Securities, Inc., a broker-dealer registered with the Securities and Exchange Commission and a futures commission merchant licensed with the Commodity Futures Trading Commission). TradeStation Securities is a member of the Financial Industry Regulatory Authority, the National Futures Association, and a number of exchanges.
TradeStation Securities, Inc. and TradeStation Technologies, Inc. are each wholly owned subsidiaries of TradeStation Group, Inc., both operating, and providing products and services, under the TradeStation brand and trademark. When applying for, or purchasing, accounts, subscriptions, products and services, it is important that you know which company you will be dealing with. Visit www.TradeStation.com for further important information explaining what this means.

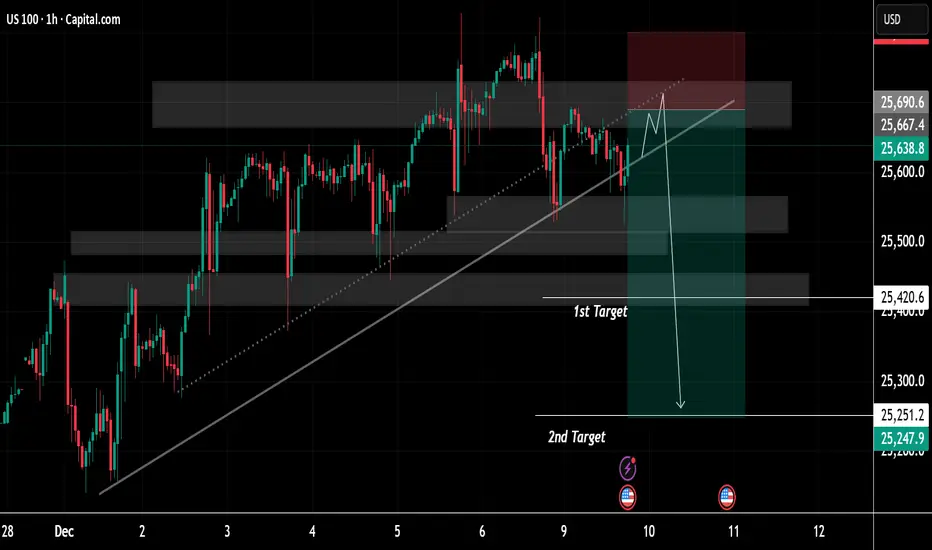
US100 Price Update – Clean & Clear ExplanationUS100 is moving within a broad ascending channel, defined by a long-term diagonal support line that has guided the market’s bullish momentum since late November. Multiple interaction points along this trendline show it has historically acted as a reliable dynamic support zone.
Several shaded horizontal regions highlight key supply and demand zones. These zones reflect areas of repeated institutional activity where price has previously paused, consolidated, or reversed. The upper shaded region represents a resistance cluster where bullish momentum has struggled to sustain continuation, resulting in repeated rejections and wicks to the upside.
The most recent price movement shows the index pushing upward into this resistance band once again, followed by signs of exhaustion. A projected schematic drawn on the chart suggests a potential final liquidity grab—where price may sweep the highs near resistance before reversing. The marked red zone indicates the anticipated rejection area, implying traders may be monitoring this region for a potential bearish shift.
Below, two targets are outlined:
1st Target: Positioned near a mid-range demand zone, aligning with a previous consolidation block. This zone represents the first probable area where price may stabilize or react after a breakdown from the trendline.
2nd Target: A deeper level aligned with a broader structural demand zone. This region marks a significant liquidity pool and a potential magnet for price if bearish momentum continues.
The downward arrow illustrates the conceptual path of a scenario where the ascending trendline is broken decisively, potentially triggering a momentum-driven decline toward these target levels. This depiction emphasizes the importance of trendline integrity and the reaction at the overhead supply zone.
Overall, the chart presents a clean confluence-based structure combining trendline dynamics, supply-demand mapping, and liquidity behaviour—offering a well-organized visualization of a possible medium-term market reversal scenario within a prevailing upward trend.
If You find it helpful please like and comments for this post and share thanks.
Major correctionI'm targetting a drop to 11 000 around Aug to Dec next year and back to more reasonable valuations than currently. This would also arrive at the very long term lower trend line on the log chart. The area around 11 000 looks to me like it need retesting. And it would need to be in this sort of time frame, before we run out of time to get back to such levels on this lower log trend line.
Ok possible, but far fetched, so it still needs a reason.
So why should that happen?
A confluence of factors:
- I believe inflation will stay elevated for some time and even potentially resurge. Trumps tariffs are not helping with disruptions and inefficiency on supply chains.
- I think its unavoidable that AI will destroy jobs. Long term it will balance out, as it always does. But in the interim this will be faster than the labour market can adapt. So a lot of job losses
- Due to the inflation backdrop, the fed's hands will be tied, regarding dropping rates. So they wont be able to rescue markets on this occasion with their Ponzi scheme. THAT will be a big problem. Or if that's not the case, the job losses may still be too much anyway, for their fiddling to prevent.
My only reservation with this analysis, is that the jobs losses may be a bit slower to start showing up, than the this time frame will allow. If so, then it may not make it as far down as11 000, due to missing the window of opportunity to reach this level before it becomes below the lower log trend line. Although if it gets near, i cant believe it will not target it. If it misses by this date, its still possible to break the trend line to reach this area, if conditions became bad enough. But that would be quite extreme. But maybe it will be so.
The final factor is contracting money supply. This could cause the above scenario alone anyway. As ballooning supply is mostly how we got where we are. But certainly if combined with any of the others, it could be nasty. So be very vigilant on this.
Note, that the chart posted is a monthly chart. So this is a longer term view. So dont expect this to happen imminently or on a particular day/week/month. But keep an eye out for the signs.
Lastly, potential labels for the 3 up waves of an elliot wave. The first and third are similar in terms of % gain. Less do in terms of time duration, but still more similar to each other than compared to the middle wave. Elliot waves are extremely discretional however and vary according to time frame. So much variation in delineation is possible. And it could still continue for some time. Mentioned more as a possible point of interest than a useful tool.

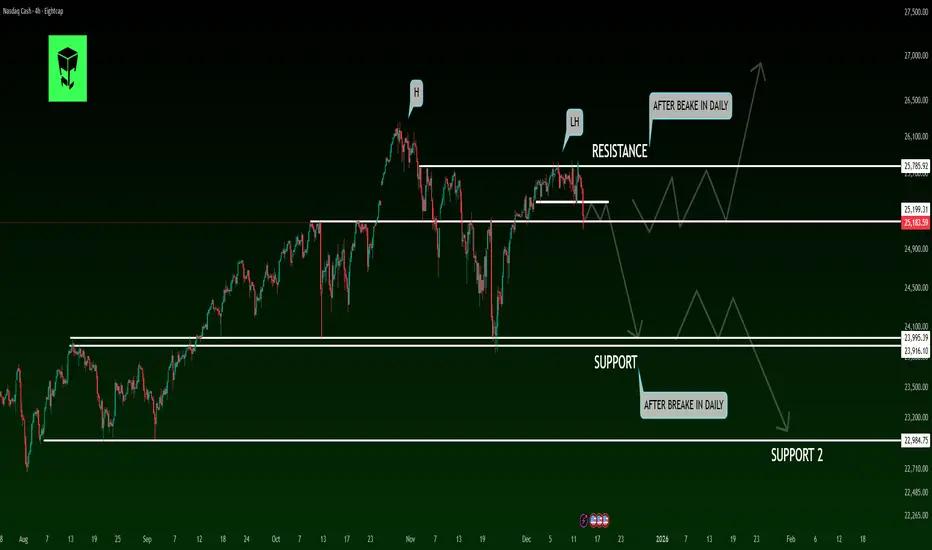
Calm Before the Storm?A Potential Crash Is Forming in US STOCKSHello, I hope you're doing well today. We are going to analyze the Nasdaq index together. The Nasdaq is one of the key U.S. stock indices and consistently offers promising trading opportunities. If you're ready, let's dive into the analysis.
Timeframe: 4H / Daily
🔍 Market Structure Overview
After forming a major High (H) followed by a clear Lower High (LH) near a key resistance zone, the NASDAQ index is showing signs of bullish momentum weakness. Failure to hold and stabilize above this resistance increases the probability of a market phase shift from bullish/ranging to corrective or bearish.
🧱 Key Supply & Demand Zones
🔴 Major Resistance:
Area around 25,750 – 25,900
This zone has rejected price multiple times and is acting as a strong supply area.
🟢 First Support:
Area around 23,950 – 24,050
A daily close below this support would strengthen the bearish scenario.
🟢 Second Support (Support 2):
Area around 22,900 – 23,000
A potential downside target if the first support breaks and weakness continues.
⚠️ Probable Market Scenario
As long as price remains below the main resistance,
the corrective / bearish scenario remains dominant.
A confirmed daily break below the first support could trigger
accelerated selling toward Support 2.
Any bullish moves at this stage may be considered pullbacks into resistance,
rather than the start of a new uptrend.
🧠 Summary
📌 Market structure suggests a weak trend
📌 Sellers are showing strength near highs
📌 Extra caution is required for long positions
📌 Short trades are more favorable only after confirmed breaks
🛑 Disclaimer
⚠️ This analysis is for educational purposes only
⚠️ It is NOT financial advice
⚠️ All trading decisions are made at your own risk
⚠️ Always apply proper risk and capital management
📊 Poll – What’s your outlook?
❓ What do you expect next for NASDAQ?
🔘 Further decline toward lower supports 📉
🔘 Range-bound movement between support & resistance 🔄
🔘 Strong rebound and breakout above resistance 🚀
👇 Share your view in the comments

NAS100 Looking to continue HigherPrice is trading within a broader bullish environment. Notice where price is sitting now. Right above support, right above the rising trendline.
After the recent push up, price pulled back into the zone that aligns perfectly with the Golden pocket on the Fibonacci retracement. This level can act as an reaction area.
What I’m watching for here is buyer behavior. If price starts to show reaction, that signals buyers are stepping back in.
A hold of this zone can lead to a rotation higher, back toward the prior highs at around 25,800.
But if price fails to hold this zone and falls below it, then the bullish idea is invalidated. I would then wait for the reaction at the lower trendline.
Until then, this is a wait-for-confirmation area.

BUY STOP (NAS100) - SWING TRADEEish, I do not want to talk much. Just set a buy stop, hold the trade to 27000. Swing trade for the next 3 weeks. Take partial profits on the way up. This is money for your January.
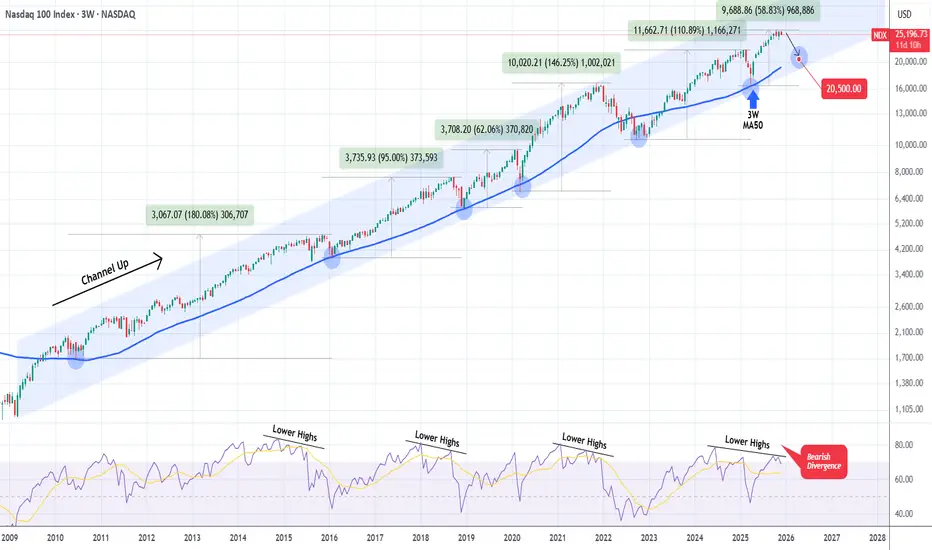
NASDAQ Time to correct hard until it reaches this level again.Exactly 6 months ago (June 20, see chart below), we posted the following analysis on Nasdaq (NDX), which helped us ride the rally following the April 07 2025 market low:
The reasoning behind this was that Nasdaq's low was on its 3W MA50 (blue trend-line), a key Support level which since 2009 and the start of the market's dominant multi-year Channel Up following the 2008 Housing Crisis, has offered 5 perfect long-term buy entries upon contact, only breaking once during the 2022 Inflation Crisis.
Now that the 3W RSI is displaying a Lower Highs Bearish Divergence (against the price's Higher Highs) that has been formed on another 3 prior Cycle Tops, we expect the market to start reversing soon for another cyclical correction. Technically another Bearish Leg for the dominant Channel Up.
Naturally, we expect it to reach at least the 3W MA50 again. Based on its trajectory, it is possible for contact to be made around 20500. Keep in mind again that absolute pricing isn't the important thing here, timing is. The most optimal time to buy based on this high accuracy model, is upon contact with the 3W MA50, regardless of the price it is at, so don't get fixed on 20500, but it is a fair projection based on the trend.
---
** Please LIKE 👍, FOLLOW ✅, SHARE 🙌 and COMMENT ✍ if you enjoy this idea! Also share your ideas and charts in the comments section below! This is best way to keep it relevant, support us, keep the content here free and allow the idea to reach as many people as possible. **
---
💸💸💸💸💸💸
👇 👇 👇 👇 👇 👇
Another bad day for price action in the Nasdaq
BAD DAY TO TRADE
Nasdaq is very choppy today just as it has been for the entire year. London session already dealt with very high FOMC push so if it went more Bearish on the day I wouldn't be surprised. However the price action for December has been absolutely abysmal. Pre-Market stocks are looking overall Bearish as of 1 Hour before open however that doesn't mean much with how many reversals have been happening lately. London session also broke sellside liquidity but not buyside so that could mean a bullish break of structure but FOMC messed up liquidity bad and it is still recovering so I am overall neutral on the day.
US100 intraday overviewThis is a simple market overview based on basic price action.
Sharing my personal view, not financial advice.

NASDAQ SHORT VERY BEARISHTri-star doji printed, a rare and strong reversal pattern - extremely bearish.

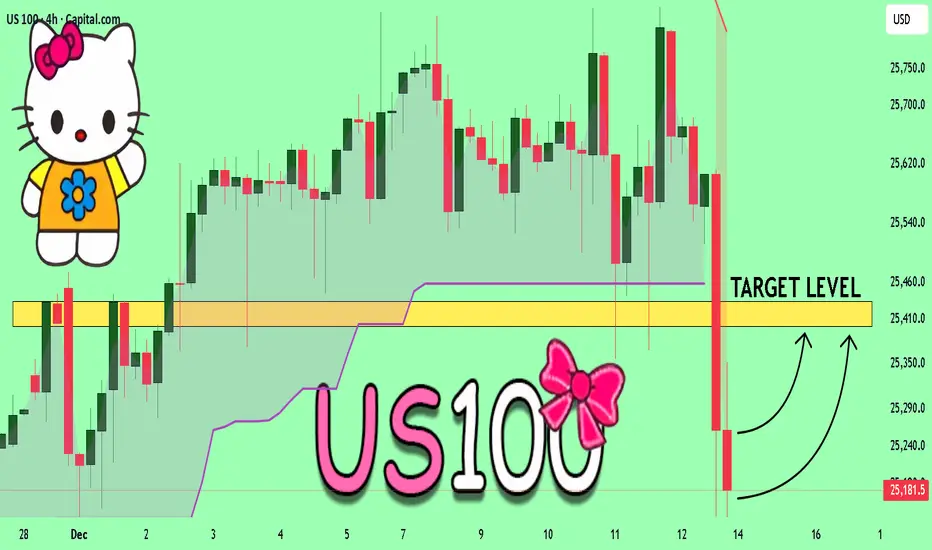
US100 Will Explode! BUY!
My dear subscribers,
My technical analysis for US100 is below:
The price is coiling around a solid key level -25181
Bias - Bullish
Technical Indicators: Pivot Points High anticipates a potential price reversal.
Super trend shows a clear buy, giving a perfect indicators' convergence.
Goal - 25400
About Used Indicators:
By the very nature of the supertrend indicator, it offers firm support and resistance levels for traders to enter and exit trades. Additionally, it also provides signals for setting stop losses
Disclosure: I am part of Trade Nation's Influencer program and receive a monthly fee for using their TradingView charts in my analysis.
———————————
WISH YOU ALL LUCK
Nasdaq: To bleed or not to bleed?
STRUCTURE CONTEXT:
Strength Context: Sellers Dominating
RSI Divergence: Present
Control Variant: Sellers Have Full Control
EMA Confluence: 400EMA Reversion
Balance Context: Bearish
Psychology Levels: $24,000 and $25,000
STRUCTURE ANALYSIS:
For the last 10 months we have seen a constant rise in price. Now interrupted in November and momentum now confirmed in December.
Price rejected 4 times when buyers attempted to reclaim price structure. Since then sellers have been dominating for 10 days with no signs of stopping.
With two retracements and an indecision in price on the Daily TF at $23,800, plus a crossover of the 9EMA and the 400EMA with reversion, and the lower lows and lower highs printed, we see great downwards confluence to claim open orders at $23,800 and most likely reverse to try and reclaim trend.
LONG SCENARIO:
- Price continues to retrace down to $23,800 where price was greatly rejected twice.
- Sellers then reach exhaustion and buyers reclaim price and attempt to push price to new highs.
SHORT SCENARIO:
- After price failing to make a new higher high sellers take control once more after exhausting buyers.
- Mitigating 50% of the imbalance in price we see a hard rejection to a new lower low using the strength of the 400 EMA reversion to the downside.

NAS100 H4 | Bearish Momentum To ContinueMomentum: Bearish
The price is rising towards the sell entry, which is an overlap resistance, and also trading below the Ichimoku cloud.
Sell entry: 24,898.06
Overlap resistance
Stop loss: 25,212.78
Overlap resistance
Take profit: 24,441.20
Pullback support
78.6% Fibonacci projection
High Risk Investment Warning
Stratos Markets Limited (tradu.com ), Stratos Europe Ltd (tradu.com ):
CFDs are complex instruments and come with a high risk of losing money rapidly due to leverage. 70% of retail investor accounts lose money when trading CFDs with this provider. You should consider whether you understand how CFDs work and whether you can afford to take the high risk of losing your money.
Stratos Global LLC (tradu.com ): Losses can exceed deposits.
Please be advised that the information presented on TradingView is provided to Tradu (‘Company’, ‘we’) by a third-party provider (‘TFA Global Pte Ltd’). Please be reminded that you are solely responsible for the trading decisions on your account. Any information and/or content is intended entirely for research, educational and informational purposes only and does not constitute investment or consultation advice or investment strategy. The information is not tailored to the investment needs of any specific person and therefore does not involve a consideration of any of the investment objectives, financial situation or needs of any viewer that may receive it. Past performance is not a reliable indicator of future results. Actual results may differ materially from those anticipated in forward-looking or past performance statements. We assume no liability as to the accuracy or completeness of any of the information and/or content provided herein and the Company cannot be held responsible for any omission, mistake nor for any loss or damage including without limitation to any loss of profit which may arise from reliance on any information supplied by TFA Global Pte Ltd.

NASDAQ D3Waiting for D3 candle to close to look for next move. Missed small buys yesterday by few points. Life goes on.


NAS100 Preparing for Wave 3 Rally After Healthy PullbackThe NAS100 chart shows that a larger corrective move has likely finished at the (Y) / C low, after which price started a new upward impulsive structure. The recent decline looks like a normal Wave 2 pullback, which has already reacted from the 0.5–0.618 Fibonacci support zone, a common area for corrections to end. This suggests buyers are stepping back in and the market is preparing for Wave 3, which is usually the strongest upward move. As long as price stays above the invalidation level near 23,836, the bullish Elliott Wave setup remains valid. Overall, the structure favors further upside toward new highs once Wave 3 gains momentum.
Stay tuned!
@Money_Dictators
Thank you :)

USNAS100 | Bearish Below 25420 After AI Sector ShakeoutUSNAS100 – Technical Overview
After last week’s sharp AI-driven selloff, U.S. equities and bonds are seeing some relief.
Market attention now turns to Tuesday’s payrolls report and China’s latest batch of disappointing economic data, both of which may influence risk sentiment and volatility in tech-heavy indices like the NASDAQ.
Technical Analysis
USNAS100 maintains a bearish momentum while trading below 25420, with downside targets at:
→ 25210 → 24820 (extended bearish continuation)
A short-term correction toward 25420 remains possible.
However, bullish momentum will only activate if a 1H candle closes above 25420, opening the upside toward: → 25570 → 25835
The 25420–25430 zone remains the key pivot area determining directional bias.
Pivot Line: 25430
Support: 25210 · 25080 · 24810
Resistance: 25570 · 25830

NQ Move This Week 12/15 - 12/19After failing to reclaim all-time highs last week and showing a clear bearish rejection, price has shifted market structure from bullish to bearish. This may mark the beginning of a Market Maker Sell Model forming this week. If price delivers a strong daily close that fully engulfs the bullish Fair Value Gap (FVG), I would expect price to continue repricing lower.

US100 | NASDAQ – 15 Min Price & Time Analysis NASDAQ (US100) is trading inside a critical Price & Time zone based on Gann 144.
Primary scenario (Sell):
Sell is activated only after a clear break below 25150.
SL: 25320
Targets: 24980 – 24880 – 24750
Alternative scenario (Buy correction):
Buy only if price breaks and holds above 25350.
SL: 25150
Targets: 25500 – 25620
Current movement is corrective within a broader bearish structure.
Risk management is required.
US100, NASDAQ, GANN, PRICEACTION, INTRADAY

NASDAQ |CPI Day – Bearish Structure With Correction ExpectationsUSNAS100 | Technical Overview
The price has dropped nearly 500 points, exactly as we mentioned yesterday.
Today’s movement will be heavily influenced by the U.S. CPI release, which is expected to add significant volatility to the Nasdaq.
Technical Outlook
The market appears to be forming a short bullish correction, potentially moving slightly higher before resuming its bearish trend toward 24570.
If the price closes a 1H candle below 24810 without a corrective bounce, this will signal a continuation of the bearish move directly.
Key Levels
Pivot Line: 24940
Support: 24780, 24570, 24360
Resistance: 25100, 25210, 25420

USNAS100 | Bullish Above 25430 Toward 25835USNAS100 – Technical Overview
USNAS100 maintains a bullish momentum while trading above the key support zone at 25430, with the market positioned to extend upward toward the next resistance levels.
Technical Analysis
Above 25430:
The bullish structure remains intact, with upside targets at:
→ 25835
→ 25985
A breakout above 25985 may open the way for a broader continuation toward higher resistance zones.
Below 25430:
A 1H close beneath this level will shift momentum bearish, targeting:
→ 25210
→ 24810
This zone represents the next major liquidity area where buyers may attempt to re-enter.
Key Levels
Pivot Line: 25430
Support: 25220 · 24820
Resistance: 25835 · 25985
