$VET Pullback As in my previous chart the white dotted arrow is clearly showing my proyected path for NYSE:VET price action and it looks like it is falling into place as predicted. Invalidation will happen if shorts continue getting squeezed but 0.05 was a strong resistancec so we should see a much needed pullback before continuing to upside. Market is extremely Bullish and our Crypto Fear & Greed index is showing us in Extreme Greed levels so i would be very cautious but the trend is still your friend.
Going against the Bull trend is highly risky due to the strong sharp pullbacks, DCA'n is always the best option in this type of bullish environment. Between 0.05 & 0.06 should be the next target in the short time frame but i will update as needed. 🫡
Market insights

$VET Break Time I have a 4hr chart showing VeChain in what it seems to be a pullback after some days of Bullish momentum. NYSE:VET looks very positive & strong for this Bull cycle and continuation to the upside will happen but there will be a pullback for the crypto market. Vet should be pulling back to test the previous resistance of $0.055 followed by consolidation before the next leg up. Dont sleep on this Gem 💎 we have much more to go guys 💪🏼🤑🔥🚀🚀🌒
Short Term Target = 0.055

Vechain attempting to flip inverse h&s neckline to supportCan see here on the weekly timeframe chart how it’s already closed one weekly candl above the neckline.there have been many daily chart candles recently battling to main support on that neckline as well and also an impending golden cross on the daily chart time frame set to occur in tthe next 1-2 daily candles as seen here —-> blob:https://www.tradingview.com/e00ebf4c-9780-485c-a37a-9d603aec6fd4blob:https://www.tradingview.com/e00ebf4c-9780-485c-a37a-9d603aec6fd4 Since btcoin is still in the midst of it’s first correction since it has entered the parabolic phase of the bull run and we are so close to Black Friday which is often a time of year one can scoop up cryptos at a discount, this impending daily chart golden cross may be one of the few exceptions atelier where price action doesn’t immediately hav a big pump the same day as the cross. Vechain could always break apart from the pack though at that point as well and pump while most things are still correcting. Also a slight chance the market correction is over before Black Friday too. Whatever the situation may be, if we see Vechain correct here as well but also hold support on the daily timeframes 50ma,I will likely add a little bit to my Vechain stack *not financial advice*

VeChain: Let’s go! Last week, VET managed to move further away from our blue Target Zone (between $0.0179 and $0.0292). As a result, we now consider the low of the same-colored wave (ii) as established. In the short term, the substructure of the blue wave (iii) could prompt a temporary return into our Zone, which is why we are keeping it active for now. However, the primary trajectory remains upward. Once the blue wave (iii) concludes clearly above the resistance at $0.055, a brief interim correction should follow before another upward move completes the magenta wave (i).

$VET Ready to Explode?Weekly TF showing NYSE:VET ready for breakout once it breaks above 0.05 Resistance which is very likely to happen in the upcoming weeks. Price action is showing a steady uptrend within a small apex, pack up your bags, put on your space suit and get on this rocket ship not much time left for takeoff 💥🔥🔥🚀🌒

VeChain 2024-25 Bullrun targets VET is looking to have found a nice bottom here, and waiting to see if we can get out of this in short time. VET is another utility driven token leading the way in supply chain efficiency. Let's see how the charts play out into summer 2025.

VeChain, VET, Golden pocket sets up 29x Algo TargetGolden pocket special...
to avoid being repetitive & to save time I'll just give the trade and spare you the write up. See linked BTC chart for more details.
The Trade:
Preferred Entry: $0.02275 or 0.618 retrace of this impulse wave (if we get one)
Ape Entry: $0.0284
Stop: $0.0213
Target: $0.858
D.Y.O.R. DO NOT BLINDLY TAKE THESE TRADES.
Never Trust. Verify. PLEASE DO YOUR OWN ANALYSIS.
This is not financial advice. These are just my observations.
Technical Analysis is not about being right, it's about increasing your odds.
Be prepared to be wrong. Risk management is key. Capital preservation above all else.

VECHAIN another failed blockchainThis chart is of #VET priced in #BTC
A massively hyped supply chain project.
Another problem that didn't need solving by cryptography.
The chart has a massive head and shoulders is below a major previous low
and after this bull run, I can envisage losing more value.
#FinancialDamage

VET VeChain Breakout with Price Targets (LONG)IF VET gets a volume increase soon, we will start breaking trough resistance. We have just broken out of a 6 month resistance trend line after finding a bottom. If we can get through the .702 fib re-tracement at 0.402, the we are heading straight to the higher targets towards the top of the channel with the dotted line 0.074 & 0.107
Spot buy and ride this one all the way up!

VET bullishOn higher timeframe it seems that altcoinseason is confirmed.
We are in accumulation zone, VET will go higher, I expect 4x-5x from here.
Wyckoff is confirmed on HTF that means a lot, secure bag at 5x.

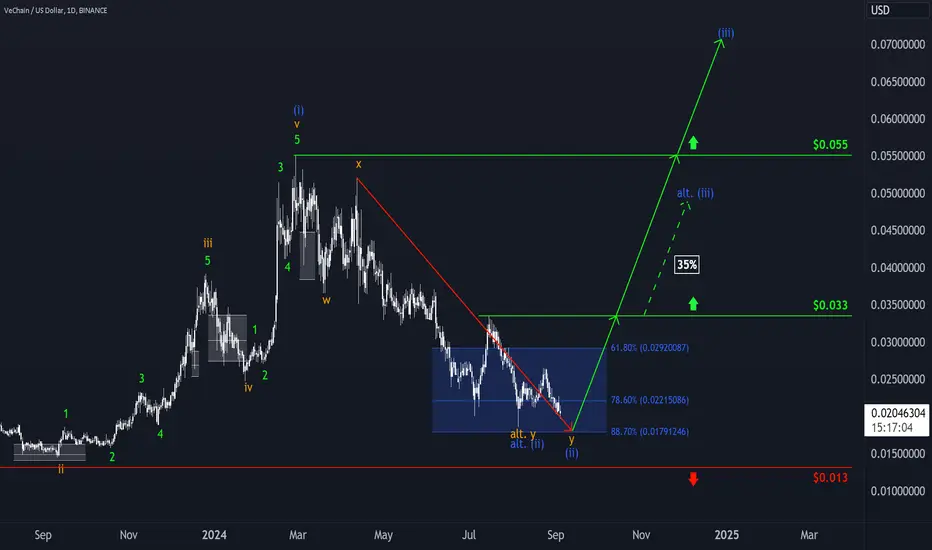
VeChain: ReboundedVET was pulled back to the 78.60% retracement (at $0.0221) of our blue Target Zone (between $0.0292 and $0.0179) after our last update. From a technical perspective, the low of the blue wave alt.(ii) could now already be established and a recovery could begin. However, this scenario (35%) will only be activated if the resistance at $0.033 is broken. For the time being, we maintain that there should be a further setback to the lower edge of the zone before the coin turns around. With the low in place, a significant increase above the resistance at $0.055 should then set in.

VET - Prime Buy PositionVET #42
If you're looking to buy a solid top tier altcoin that may bring you the volatility that comes only with altcoins but with less downside risk than many others, then VET is a great choice here.
This whole area since June '22 has been very shallow in reflection of the highest time frame trend.
From the bearish "SC" Selling Climax low of '22 we had slightly lower lows "ST" Secondary Tests signalling downside weakness.
From there VET broke out but in the end it form a weak 3 wave 1:0.618 Golden Window correction.
And from that peak we saw further bearish action.
This is the rise and fall of an accumulation.
And it looks very much like we're reaching the end phase of the accumulation here and potentially now at "LPS" Last Point of Support.
The recent slump has pulled back to the ideal retracement Golden Window; 0.618 - 0.786.
And exactly as we like to see; a very significant support of August 2020 is plumb on the 0.618.
So we have double confluence that this can be a significant bullish reversal point here.
Whenever we see the 0.618 retracement and a significant support; that is a bit of a clue.
Notice as high as the week chart, we have a little RSI uptick of bullish divergence.
The RSI source is set to "low" not the default "close" and so it gets a reading from the lowest point.
This means that the wick of the lowest candle is captured in the reading.
But yet it has printed a higher low on the RSI.
This is bullish.
On lower time frame down on the day chart, notice the slightly lower low is likely to be a Wyckoff SC and ST, very similar to what we saw through 2022 and 2023, but in lower time frame.
So we have multiple layers of Wyckoff accumulation here and looking bullish.
Obviously for this to be correct then BTC must not make lower lows or VET will slump lower.
If BTC does slump back to the 0.618 as described in a previous thread then VET may have a minor pull back.
And in my work I am confident Bitcoin does not have another high time frame wave down as many are calling for dreaming of $35K etc.
Thats not happening I think.
Those areas are gone.
And so VET is in prime buy position here with as little downside risk as you could hope for.
See you at the top 😼.
Not advice.

vetusd, , so simple, will longIt is important to draw the line correctly to go long at the support level of two oscillation intervals.. The white oscillation intervals are interspersed reasonably, and the local blue downward channels are also independent and do not interfere with each other


VeChain: Still Some RoomVET experienced a setback last week within our blue Target Zone (between $0.0292 and $0.0179). This development aligns with our primary expectation, as we still grant the blue wave (ii) scope down to the lower edge of the zone. As soon as the low has been established, the price should turn around and be carried above the resistance at $0.055 by the same-colored wave (iii). However, the minimum technical requirement for the low has already been met. Should the coin break through the $0.033 level directly (35% likely), we will already see it in the blue wave alt. (iii).
VeChain: ReturnedVET returned into our blue Target Zone (between $0.0179 and $0.0292) last week. As we consider the blue wave (ii) to have ended, we interpret this development merely as part of the internal substructure of the same-colored wave (iii). Accordingly, we expect further rises and an overcoming of the resistance at $0.055. Investors could therefore open long positions within our Target Zone, whereby stops could be placed about 1% below the lower edge.

VeChain: Turned AroundVET gained sharply last week and left our blue Target Zone (between $0.0179 and $0.0292). In view of this neat turnaround, we now consider the blue wave (ii) to be complete and see the price in the same-colored wave (iii). This movement should reach beyond the resistance at $0.0550. Within the internal substructure, however, it remains possible that our Target Zone could be approached again, which is why we are currently keeping it active. In the event of a further dip, investors can once again cover their positions with long positions, whereby stops could be placed around 1% below the lower edge.

$VET weekly chart giving a buy signal!COINBASE:VETUSD weekly chart is showing a big green dot on the trading indicator. This is a signal of direction shifting from bear to bull. Long over .022. Sell target will be when the RSI (light blue line) hits the white dotted line or we get a red dot!
👇

VET Set for Major Gains: Preparing for Alt Season SurgeVeChain (VET) is part of a blockchain platform that enhances supply chain and business processes. It improves transparency, traceability, and efficiency across various industries, including healthcare, agriculture, luxury goods, and logistics. With the VET coin serving as a transactional token, companies can ensure the authenticity and quality of their products.
Currently, VeChain shows significant potential. With a maximum circulating supply of 86.713 billion tokens, about 93.39% already in circulation, VET is poised for growth. The alt season is between Q4 2024 and Q1 or Q4 2025, during which the market is expected to see a substantial increase in volume. This period could present an excellent opportunity for VET to make significant gains.
At present, VETUSD's strong support level is at $0.02443. If this support holds, we could see a significant upward movement. However, if it breaks, the next strong support lies at $0.2028, from where a bounce is expected. We anticipate market volume to start increasing from October 2024 onwards, signaling the beginning of a bullish phase.
Based on our calculations, VET's bull run targets a minimum of $1 by Q1 2025. If VET flips the $1 resistance by Q1 2025, the maximum target could reach $11.2 by Q4 2025. Alt season often brings unexpected price surges, and we might see similar volatility this time. It's crucial to monitor the resistance zones and manage trades accordingly. We recommend exiting long positions around Q1 or Q4 2025 to capitalize on the bull run and alt season's end.
For more detailed analysis like this, follow us on TradingView to stay updated with our latest ideas. Share your thoughts in the comments, and let us know if you need analysis on any specific coins. We're here to provide insights and help you make informed trading decisions.

ALT SEASON IS NEARBuy the fear, alt season is near.
Market is too bearish and boring, that's when big moves happen... when you least expect it.

VeChain: Turning PointVET has dipped into our blue Target Zone (between $0.0292 and $0.0179). Within this range we expect the low of the blue wave (ii) correction and thus the bullish trend reversal. Accordingly, one can use this Zone to open long positions, whereby any stops could be placed around 1% below the lower edge. With the blue wave (iii), we expect an increase above the resistance at $0.055.


Vechain After an inside bar and its inducement was formed yesterday, I had to wait for the opening of a new day to pick a demand zone that will be used for the buy
