Bloom Energy Corporation ($BE) Spike 14% Amidst Earnings Beat The price of Bloom Energy Corporation (NYSE: NYSE:BE ) saw a noteworthy uptick of 14% in early market trading as the asset reported earnings result yesternight after market close.
The stock is gearing a move to the $140 resistant point albeit present market conditions. With the last recorded RSI
Next report date
—
Report period
—
EPS estimate
—
Revenue estimate
—
0.06 EUR
−28.23 M EUR
1.42 B EUR
218.15 M
About Bloom Energy Corporation
Sector
Industry
CEO
K. R. Sridhar
Website
Headquarters
San Jose
Founded
2001
ISIN
US0937121079
FIGI
BBG01C3N9F23
Bloom Energy Corp. engages in the manufacture and installation of a solid oxide fuel-cell based power generation platform. Its product, Bloom Energy Server, converts standard low-pressure natural gas or biogas into electricity through an electrochemical process without combustion. The company was founded by K. R. Sridhar, John Finn, Jim McElroy, Matthias Gottmann, and Dien Nguyen on January 18, 2001, and is headquartered in San Jose, CA.
Related stocks

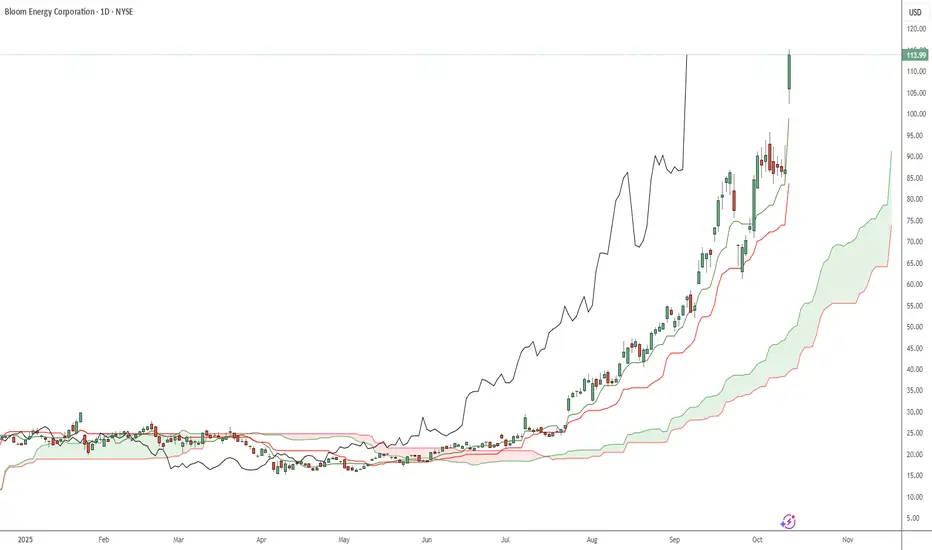
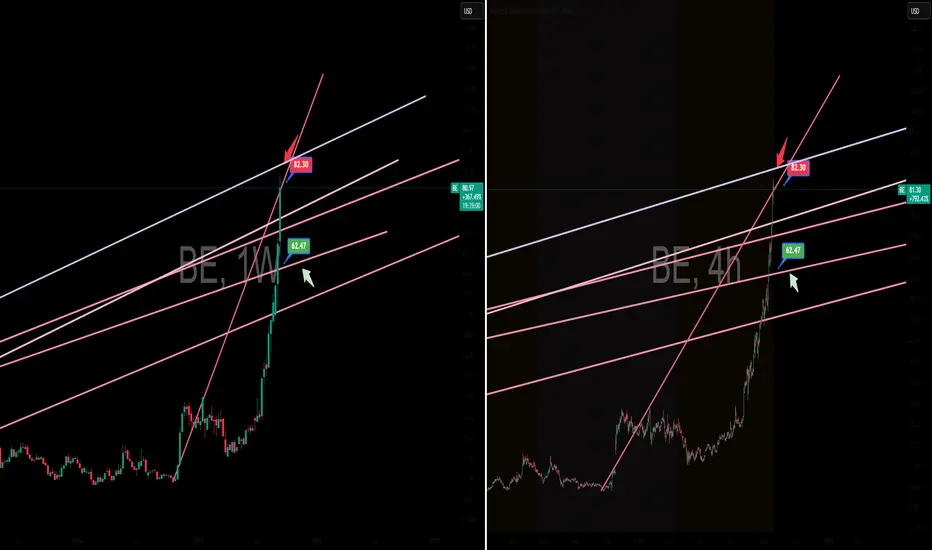
BE: price in important resistance zoneNYSE:BE price is currently trading within an important resistance zone, where a mid-term top formation is likely.
From here, I expect a pullback and consolidation within the 76–56 macro support area before the next potential upside leg toward the 160–190 / 255–310 macro resistance extensions.
Ch

BEBE moves today strongly with +30% . . Luckily, I've been in this trade since 50s so nice profit in percentages- not too much in money terms, but today's volume and trend structure allow me to sit on my hands and wait....
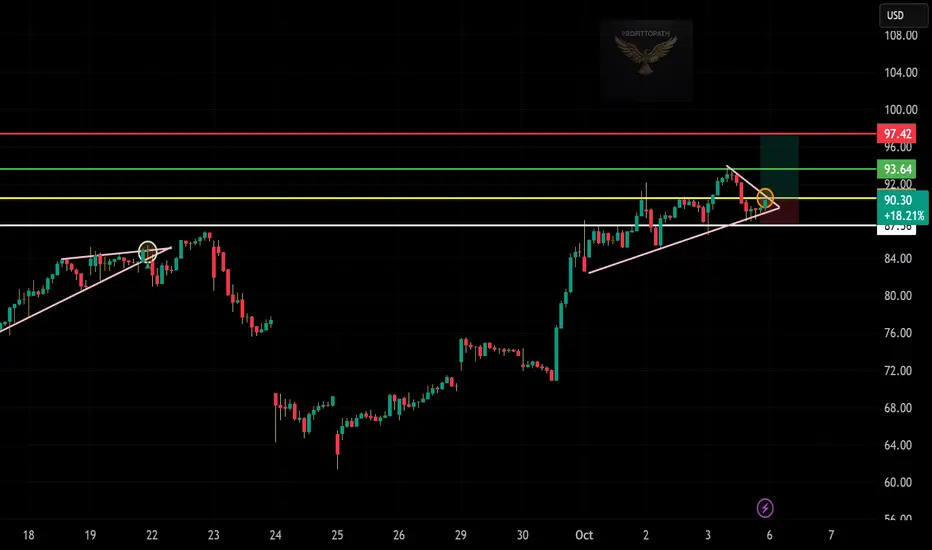
BE – 30M Chart Analysis! 🟢
Price respecting ascending trendline support.
Forming a bullish wedge pattern — possible breakout setup.
Entry zone: around 90.0–90.3 (near wedge support).
Breakout confirmation: above 92.0–93.6 zone.
Target: 97.42
Stop-loss: below 87.56
Risk-Reward Ratio: around 1:2
Bias: Bullish while a
TradeUSAsignals RecommendationsBE - Long (5% of your portfolio) - Order filled @ 72.53
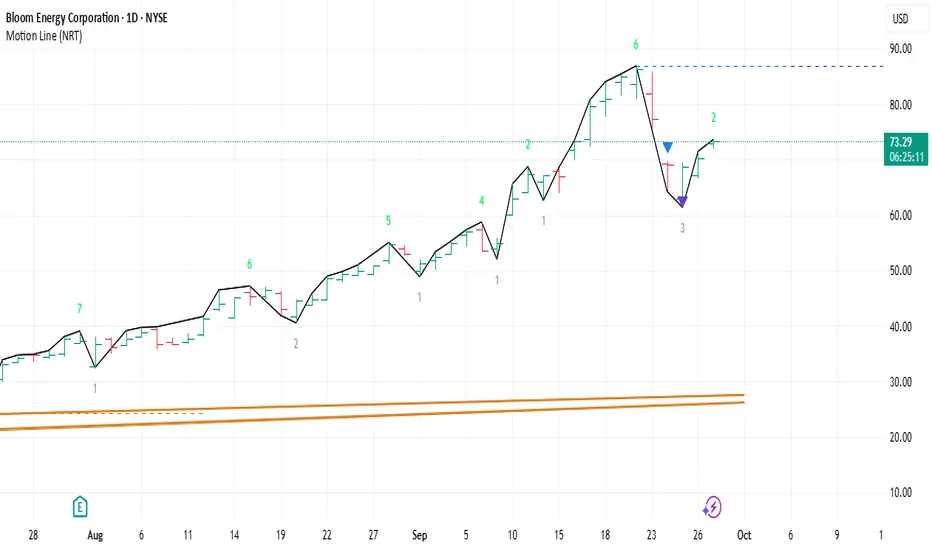
An up trend controlled by Time traders with Bias and Price traders both against the trend witch gives a signal to go long.
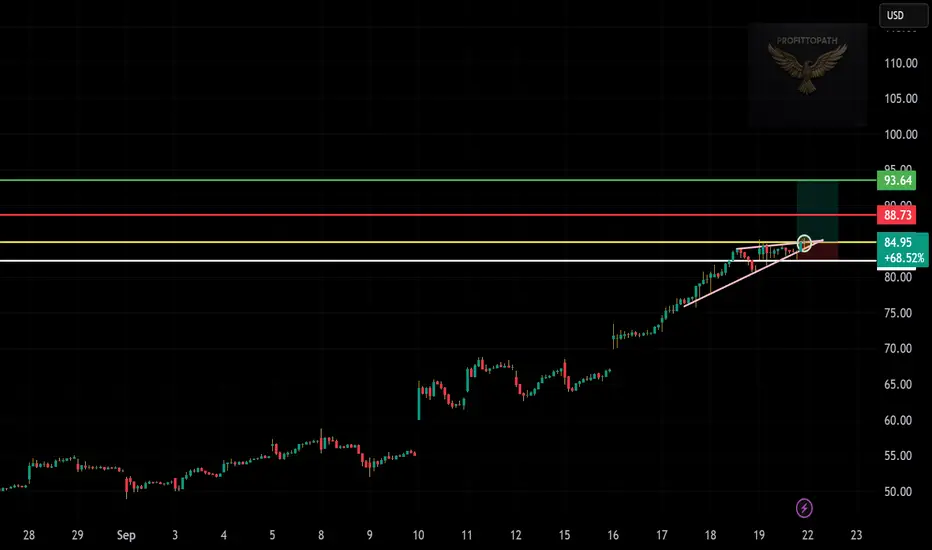
BE – Bullish Continuation Setup Above Support📝 Analysis:
Trend: Strong uptrend, price forming higher highs.
Support: $84.95 (near-term), $80 (trendline zone).
Resistance: $88.73 (first target), $93.64 (second target).
Plan: Stay bullish while above $84.95. If price breaks below, watch $80 as next support.
🎯 Target Zone: $88.73 – $93.64
🛑
To BE or Not to BE... Short!Rationale & Thesis
This is a technical short trade on Bloom Energy (BE), based on a clear rejection of a key resistance level. The thesis is that the upward momentum has exhausted itself, and the price is now positioned to move toward a significant support zone. This trade aims to capture the downw
4-Dimensional Investing: Evolving Beyond News, Charts, and Math 📚 4-Dimensional Investing: Evolving Beyond News, Charts, and Math
Most people start learning about stocks in a 1-dimensional way — by following the news.
But news is noisy.
Some is fake, some is "buy the rumor, sell the fact", and sometimes the price moves the opposite of what the news suggests. So,

Bloom inverse head and shoulderHi guys,
Take all of this with a grain of salt, because I've been terribly wrong on Hydrogen - but, I'm seeing what looks like inverse head and shoulder forming in Bloom, with a landing on top of a prior resistance level. As far as I'm concerned, this ticker, regardless of what it is, is ready t

BE Long. If I’m right follow for moreBeautiful consolidation above the MA. Get ready for higher price

See all ideas
Summarizing what the indicators are suggesting.
Neutral
SellBuy
Strong sellStrong buy
Strong sellSellNeutralBuyStrong buy
Neutral
SellBuy
Strong sellStrong buy
Strong sellSellNeutralBuyStrong buy
Neutral
SellBuy
Strong sellStrong buy
Strong sellSellNeutralBuyStrong buy
An aggregate view of professional's ratings.
Neutral
SellBuy
Strong sellStrong buy
Strong sellSellNeutralBuyStrong buy
Neutral
SellBuy
Strong sellStrong buy
Strong sellSellNeutralBuyStrong buy
Neutral
SellBuy
Strong sellStrong buy
Strong sellSellNeutralBuyStrong buy
Displays a symbol's price movements over previous years to identify recurring trends.
INRA
iShares Global Clean Energy Transition UCITS ETF Accum Shs USDWeight
9.55%
Market value
292.17 M
USD
Explore more ETFs
Frequently Asked Questions
The current price of BE is 92.27 EUR — it has increased by 1.69% in the past 24 hours. Watch Bloom Energy Corporation Class A stock price performance more closely on the chart.
Depending on the exchange, the stock ticker may vary. For instance, on VIE exchange Bloom Energy Corporation Class A stocks are traded under the ticker BE.
BE stock has fallen by −16.13% compared to the previous week, the month change is a −1.07% fall, over the last year Bloom Energy Corporation Class A has showed a 320.27% increase.
We've gathered analysts' opinions on Bloom Energy Corporation Class A future price: according to them, BE price has a max estimate of 136.09 EUR and a min estimate of 22.54 EUR. Watch BE chart and read a more detailed Bloom Energy Corporation Class A stock forecast: see what analysts think of Bloom Energy Corporation Class A and suggest that you do with its stocks.
BE stock is 11.62% volatile and has beta coefficient of 2.32. Track Bloom Energy Corporation Class A stock price on the chart and check out the list of the most volatile stocks — is Bloom Energy Corporation Class A there?
Today Bloom Energy Corporation Class A has the market capitalization of 22.33 B, it has decreased by −23.85% over the last week.
Yes, you can track Bloom Energy Corporation Class A financials in yearly and quarterly reports right on TradingView.
Bloom Energy Corporation Class A is going to release the next earnings report on Feb 5, 2026. Keep track of upcoming events with our Earnings Calendar.
BE earnings for the last quarter are 0.13 EUR per share, whereas the estimation was 0.09 EUR resulting in a 48.96% surprise. The estimated earnings for the next quarter are 0.26 EUR per share. See more details about Bloom Energy Corporation Class A earnings.
Bloom Energy Corporation Class A revenue for the last quarter amounts to 442.33 M EUR, despite the estimated figure of 364.01 M EUR. In the next quarter, revenue is expected to reach 550.83 M EUR.
BE net income for the last quarter is −19.68 M EUR, while the quarter before that showed −36.18 M EUR of net income which accounts for 45.61% change. Track more Bloom Energy Corporation Class A financial stats to get the full picture.
No, BE doesn't pay any dividends to its shareholders. But don't worry, we've prepared a list of high-dividend stocks for you.
As of Nov 20, 2025, the company has 2.13 K employees. See our rating of the largest employees — is Bloom Energy Corporation Class A on this list?
EBITDA measures a company's operating performance, its growth signifies an improvement in the efficiency of a company. Bloom Energy Corporation Class A EBITDA is 152.56 M EUR, and current EBITDA margin is 5.15%. See more stats in Bloom Energy Corporation Class A financial statements.
Like other stocks, BE shares are traded on stock exchanges, e.g. Nasdaq, Nyse, Euronext, and the easiest way to buy them is through an online stock broker. To do this, you need to open an account and follow a broker's procedures, then start trading. You can trade Bloom Energy Corporation Class A stock right from TradingView charts — choose your broker and connect to your account.
Investing in stocks requires a comprehensive research: you should carefully study all the available data, e.g. company's financials, related news, and its technical analysis. So Bloom Energy Corporation Class A technincal analysis shows the neutral today, and its 1 week rating is buy. Since market conditions are prone to changes, it's worth looking a bit further into the future — according to the 1 month rating Bloom Energy Corporation Class A stock shows the buy signal. See more of Bloom Energy Corporation Class A technicals for a more comprehensive analysis.
If you're still not sure, try looking for inspiration in our curated watchlists.
If you're still not sure, try looking for inspiration in our curated watchlists.