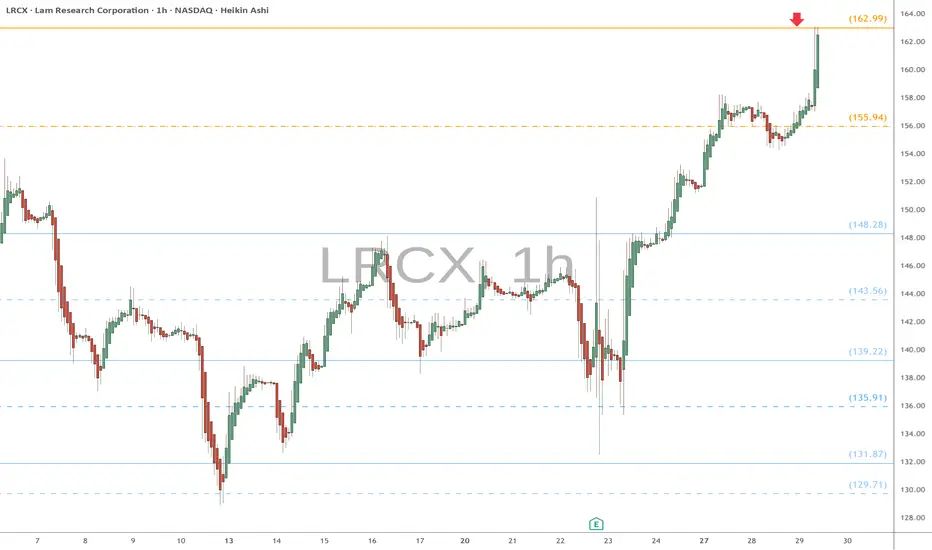
LRCX heads up at $162.99: Golden Genesis fib should give a DIP This is a followup to my previous long call below.
LRCX got a boost from the last Earnings report.
It has just hit a Golden Genesis fib at $162.99
Look for a Break-n-Retest or a Dip-to-Fib to buy.
.
Last Plot that gave a PERFECT LONG:
Hit BOOST and FOLLOW for more such PRECISE and TIMELY charts
Next report date
—
Report period
—
EPS estimate
—
Revenue estimate
—
3.88 EUR
4.55 B EUR
15.65 B EUR
1.25 B
About Lam Research Corporation
Sector
Industry
CEO
Timothy M. Archer
Website
Headquarters
Fremont
Founded
1980
ISIN
US5128073062
FIGI
BBG00GQ6S5S0
Lam Research Corp. engages in the design, manufacture, marketing, refurbishment, and provision of semiconductor processing equipment used in the fabrication of integrated circuits. It operates through the following geographical segments: United States, China, Europe, Japan, Korea, Southeast Asia and Taiwan. The company was founded by David K. Lam in 1980 and is headquartered in Fremont, CA.
Related stocks
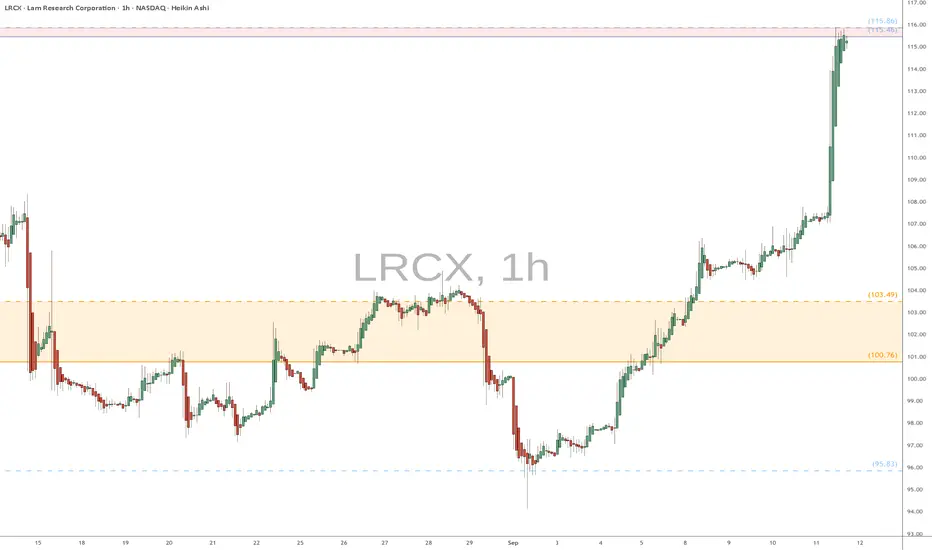
LRCX heads up at $115: Minor but Notable resistance to the SurgeLRCX surged into a minor but significant resistance
Combination of Genesis+Covid fibs at $115.46-115.86
Expecting a pullback from here, or orbit then drop.
.
Previous analysis that caught the PERFECT BreakOut:
Hit BOOST and FOLLOW for more PRECISE and TIMELY charts.
=============================
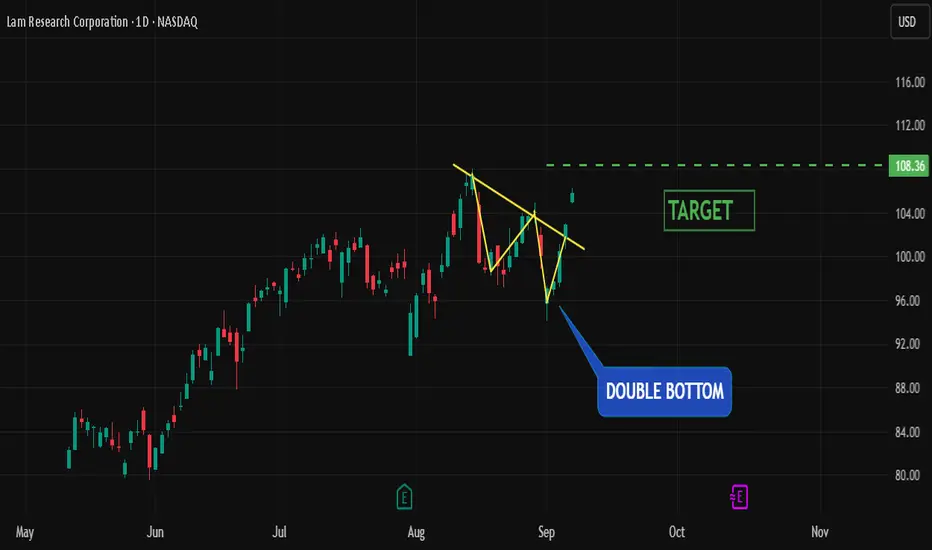
Double Bottom Breakout with Gap-Up — Target 1081) Pattern + Breakout Confirmation
The chart has formed a double bottom structure, a classic reversal setup that signals the end of a downtrend and potential start of an uptrend. After testing the support zone twice and holding firm, price opened with a strong gap-up above the neckline , conf
LRCX Chart Journal
Ticker: \ NASDAQ:LRCX
Process Over Profit
What Did I mIss:
LRCX is sitting right at 117.50 on the 8-hour chart. I spotted what *looks like a double bottom**, which usually tells me buyers are defending this level and trying to step back in.
### Trade Map I Built:
🔼 CALLS Setup:
If price break

LRCX to 117LRCX is bouncing beautifully out of the anchored VWAP channel. I am risking down to VWAP and just below the 0.618 retracement, targeting 117 dollars to the upside.

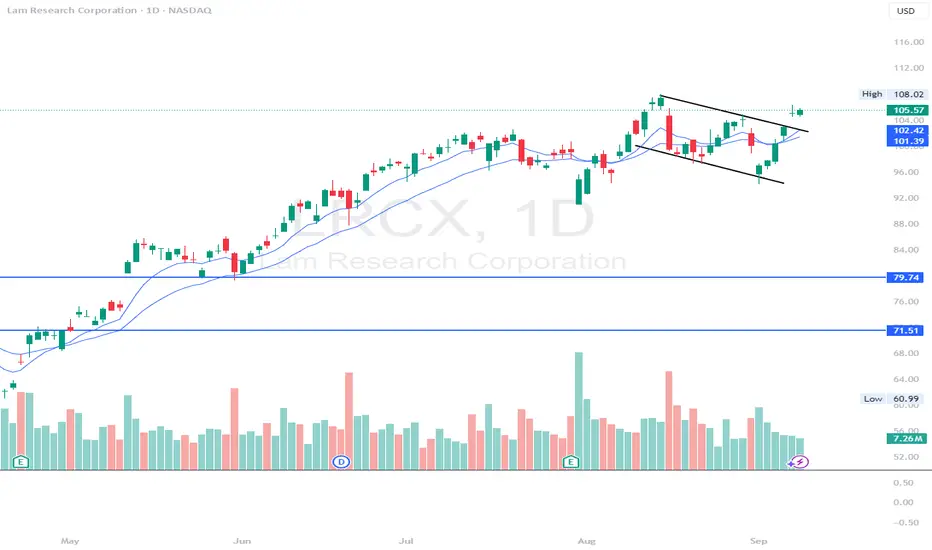
$LRCX - channel breakout here. all time highs at $111LRCX - stock breakout out of the channel on the daily time frame, looking good for calls as long as $105 holds for a move towards $108 and $111. could see a bigger move above $111 all time highs
return to proven buyers provides on trend entry 1->3 : creates a solid major support at number 2 ,
as they surpassed the selling pressure genesis of
number 1 creating high number 2 .
3->4 : we return to number 2 buyers
next ?
* bullish reaction supporting on trend continuation
* bullish divergence rsi and mfi
* obv downtrend seems to be b

LRCX (Lam Research Corporation) – Long Setup Trading Idea: NASDAQ:LRCX (Lam Research) - Long Setup
🎯 Idea: LONG
⏰ Timeframe: Daily + 4H for entry
📊 Pattern: Pullback into Support in a Bullish Trend
Fundamental Catalyst:
Strong Fundamental Score: 7/9
Growth: Strong YoY Revenue & Earnings Growth
Balance Sheet: Excellent Debt Management (De

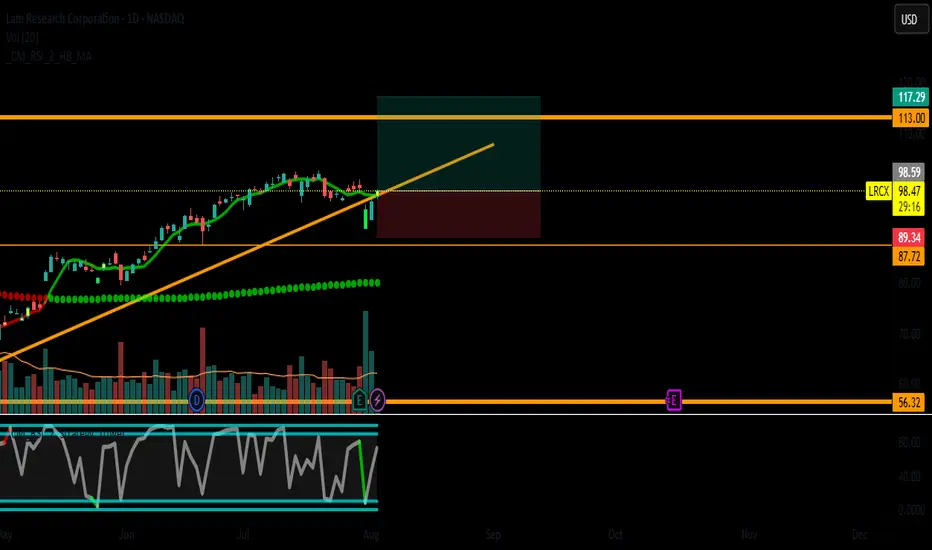
LRCX (Lam Research) - RSI2 Connors Strategy Setup🚀 Trade Idea: LRCX (Lam Research) - RSI2 Connors Strategy Setup
Entry: $98.59
Stop Loss (SL): $89.34 (~9.4% risk)
Take Profit (TP): $117.29 (~19% upside)
Risk-Reward Ratio: 1:2
📈 Trade Rationale
RSI2 Connors Buy Signal Triggered
LRCX hit an RSI2 ≤ 10 (oversold) on July 31, generating a high-proba
Sling shot above trendline If we go above the yellow resistance with good volume, potential target prices are indicated. Practice safe stop loss (-10%) in these speculative moves.

See all ideas
Summarizing what the indicators are suggesting.
Neutral
SellBuy
Strong sellStrong buy
Strong sellSellNeutralBuyStrong buy
Neutral
SellBuy
Strong sellStrong buy
Strong sellSellNeutralBuyStrong buy
Neutral
SellBuy
Strong sellStrong buy
Strong sellSellNeutralBuyStrong buy
An aggregate view of professional's ratings.
Neutral
SellBuy
Strong sellStrong buy
Strong sellSellNeutralBuyStrong buy
Neutral
SellBuy
Strong sellStrong buy
Strong sellSellNeutralBuyStrong buy
Neutral
SellBuy
Strong sellStrong buy
Strong sellSellNeutralBuyStrong buy
Displays a symbol's price movements over previous years to identify recurring trends.
LRCX4803606
Lam Research Corporation 4.875% 15-MAR-2049Yield to maturity
5.52%
Maturity date
Mar 15, 2049
LRCX4983309
Lam Research Corporation 3.125% 15-JUN-2060Yield to maturity
5.48%
Maturity date
Jun 15, 2060
LRCX4983308
Lam Research Corporation 2.875% 15-JUN-2050Yield to maturity
5.44%
Maturity date
Jun 15, 2050
LRCX4803602
Lam Research Corporation 3.75% 15-MAR-2026Yield to maturity
4.42%
Maturity date
Mar 15, 2026
LRCX4983304
Lam Research Corporation 1.9% 15-JUN-2030Yield to maturity
4.18%
Maturity date
Jun 15, 2030
US512807AU2
Lam Research Corporation 4.0% 15-MAR-2029Yield to maturity
4.09%
Maturity date
Mar 15, 2029
See all LRC2 bonds
Curated watchlists where LRC2 is featured.


Frequently Asked Questions
The current price of LRC2 is 125.22 EUR — it has increased by 0.33% in the past 24 hours. Watch Lam Research Corporation stock price performance more closely on the chart.
Depending on the exchange, the stock ticker may vary. For instance, on VIE exchange Lam Research Corporation stocks are traded under the ticker LRC2.
LRC2 stock has fallen by −8.69% compared to the previous week, the month change is a 8.82% rise, over the last year Lam Research Corporation has showed a 86.20% increase.
We've gathered analysts' opinions on Lam Research Corporation future price: according to them, LRC2 price has a max estimate of 172.69 EUR and a min estimate of 109.66 EUR. Watch LRC2 chart and read a more detailed Lam Research Corporation stock forecast: see what analysts think of Lam Research Corporation and suggest that you do with its stocks.
LRC2 reached its all-time high on Nov 6, 2025 with the price of 143.62 EUR, and its all-time low was 48.54 EUR and was reached on Apr 7, 2025. View more price dynamics on LRC2 chart.
See other stocks reaching their highest and lowest prices.
See other stocks reaching their highest and lowest prices.
LRC2 stock is 3.23% volatile and has beta coefficient of 1.98. Track Lam Research Corporation stock price on the chart and check out the list of the most volatile stocks — is Lam Research Corporation there?
Today Lam Research Corporation has the market capitalization of 159.81 B, it has decreased by −4.33% over the last week.
Yes, you can track Lam Research Corporation financials in yearly and quarterly reports right on TradingView.
Lam Research Corporation is going to release the next earnings report on Jan 28, 2026. Keep track of upcoming events with our Earnings Calendar.
LRC2 earnings for the last quarter are 1.07 EUR per share, whereas the estimation was 1.04 EUR resulting in a 3.60% surprise. The estimated earnings for the next quarter are 1.00 EUR per share. See more details about Lam Research Corporation earnings.
Lam Research Corporation revenue for the last quarter amounts to 4.54 B EUR, despite the estimated figure of 4.45 B EUR. In the next quarter, revenue is expected to reach 4.49 B EUR.
LRC2 net income for the last quarter is 1.34 B EUR, while the quarter before that showed 1.46 B EUR of net income which accounts for −8.45% change. Track more Lam Research Corporation financial stats to get the full picture.
Yes, LRC2 dividends are paid quarterly. The last dividend per share was 0.22 EUR. As of today, Dividend Yield (TTM)% is 0.64%. Tracking Lam Research Corporation dividends might help you take more informed decisions.
Lam Research Corporation dividend yield was 0.95% in 2025, and payout ratio reached 22.15%. The year before the numbers were 0.75% and 27.59% correspondingly. See high-dividend stocks and find more opportunities for your portfolio.
As of Nov 19, 2025, the company has 19 K employees. See our rating of the largest employees — is Lam Research Corporation on this list?
EBITDA measures a company's operating performance, its growth signifies an improvement in the efficiency of a company. Lam Research Corporation EBITDA is 5.85 B EUR, and current EBITDA margin is 34.10%. See more stats in Lam Research Corporation financial statements.
Like other stocks, LRC2 shares are traded on stock exchanges, e.g. Nasdaq, Nyse, Euronext, and the easiest way to buy them is through an online stock broker. To do this, you need to open an account and follow a broker's procedures, then start trading. You can trade Lam Research Corporation stock right from TradingView charts — choose your broker and connect to your account.
Investing in stocks requires a comprehensive research: you should carefully study all the available data, e.g. company's financials, related news, and its technical analysis. So Lam Research Corporation technincal analysis shows the sell today, and its 1 week rating is buy. Since market conditions are prone to changes, it's worth looking a bit further into the future — according to the 1 month rating Lam Research Corporation stock shows the sell signal. See more of Lam Research Corporation technicals for a more comprehensive analysis.
If you're still not sure, try looking for inspiration in our curated watchlists.
If you're still not sure, try looking for inspiration in our curated watchlists.