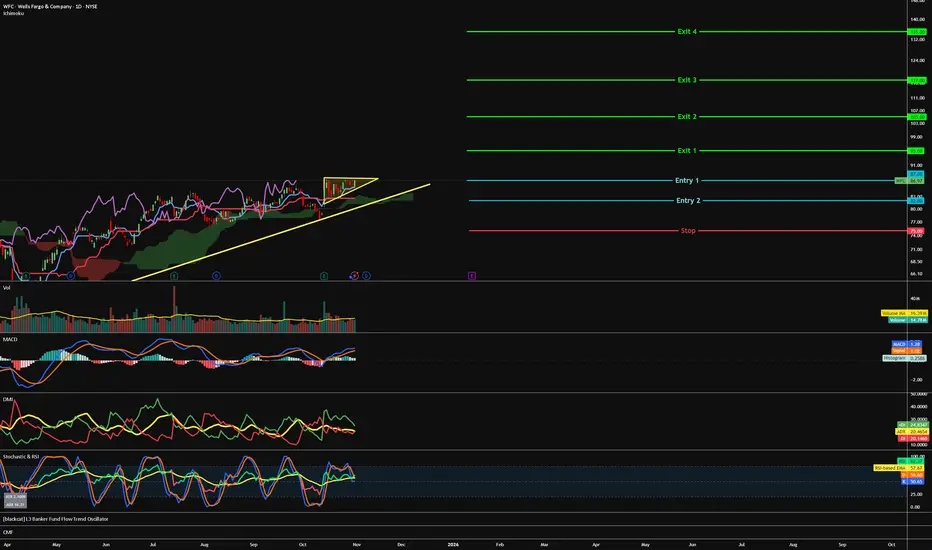
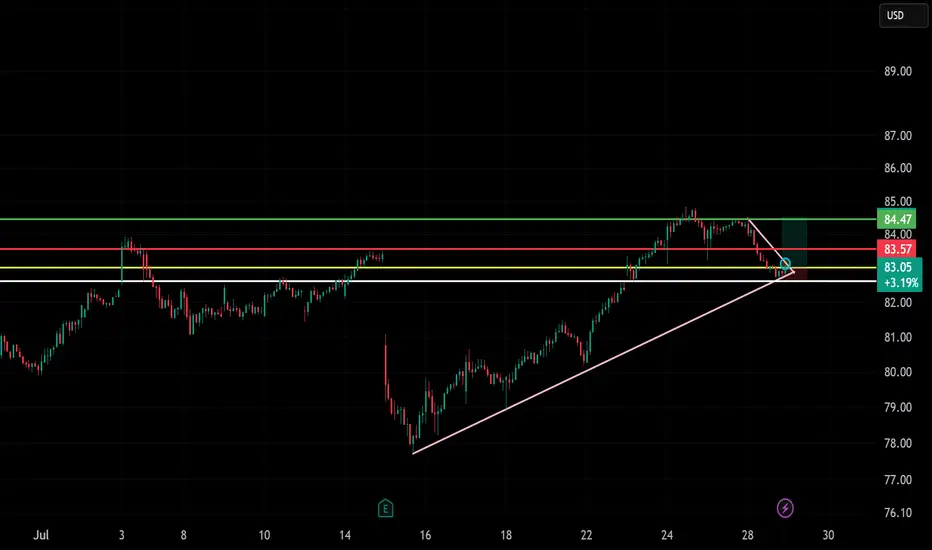
WFC - Ascending to the top=======
Volume
=======
- Neutral
==========
Price Action
==========
- Ascending triangle
- Supported on uptrend line
=================
Technical Indicators
=================
- Ichimoku
>>> price above cloud
>>> Green kumo expanding
>>> Tenken - Above clouds & Lagging & pointing up
>>> Chiku -
Key facts today
Next report date
—
Report period
—
EPS estimate
—
Revenue estimate
—
5.24 EUR
19.05 B EUR
121.98 B EUR
3.13 B
About Wells Fargo & Company
Sector
Industry
CEO
Charles William Scharf
Website
Headquarters
San Francisco
Founded
1852
ISIN
US9497461015
FIGI
BBG00KTP4HT5
Wells Fargo & Company is a bank holding company. The Company is a diversified financial services company. It has three operating segments: Community Banking, Wholesale Banking, and Wealth and Investment Management. The Company offers its services under three categories: personal, small business and commercial. It provides retail, commercial and corporate banking services through banking locations and offices, the Internet and other distribution channels to individuals, businesses and institutions in all 50 states, the District of Columbia and in other countries. It provides other financial services through its subsidiaries engaged in various businesses, including wholesale banking, mortgage banking, consumer finance, equipment leasing, agricultural finance, commercial finance, securities brokerage and investment banking, computer and data processing services, investment advisory services, mortgage-backed securities servicing and venture capital investment.
Related stocks
US banks on shaky ground Macro conditions are turning hostile. The commercial real estate market, especially office, is structurally impaired in certain segments. Vacancy rates in major US metros are above 20%. Office prices are down 30–40% from their 2022 peaks. With over $1.2 trillion in CRE debt maturing by 2027, refinan

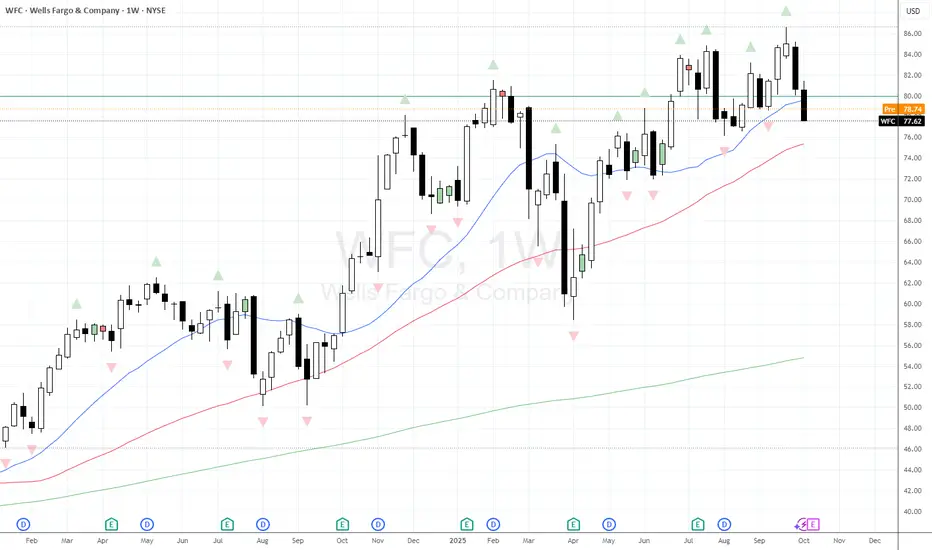
$WFC following through on weekly evening starLike other financial companies the sheen has come off #WFC recent chart. Even before Fridays market tantrums we saw price printing a weekly bearish evening star, and then last week we closed beneath the Weekly 20MA. Will WFC earning tomorrow provide fuel for a move lower, or rescue this decline? Wat
$WFC🚨 Now that the Fed has lifted Wells Fargo’s asset cap, we might see more liquidity enter the markets.
This move could unlock growth & spark bullish momentum for the stock. 📈💵

Wells Fargo Beat the S&P 500 Over 12 Months. What Its Chart SaysWells Fargo NYSE:WFC will report earnings next week at a time when the banking giant's stock recently hit an all-time high and is beating the S&P 500 SP:SPX on a one-year and five-year basis, but trailing more recently. What does the stock's technical and fundamental analysis show?
Let's check

$WFC Call Alert – Oct 31 ’25 $80 Calls | 57% ROI PotentialEnter: NYSE:WFC OCT 31 2025 $80 CALLS
Buy in Price: $2.78 - $2.80
Take Profit: $4.36
Stop Bleeding: $2.45
ROI Potential: 57%
Exit Within: 311 Minutes

WFLWe’re maintaining a bullish outlook on Wells Fargo. After a sustained period of consolidation, the stock has now broken through its RSI trend line to the upside – a classic technical signal indicating strengthening momentum and a potential continuation of the uptrend.
Why we’re bullish on WFC:
Mom

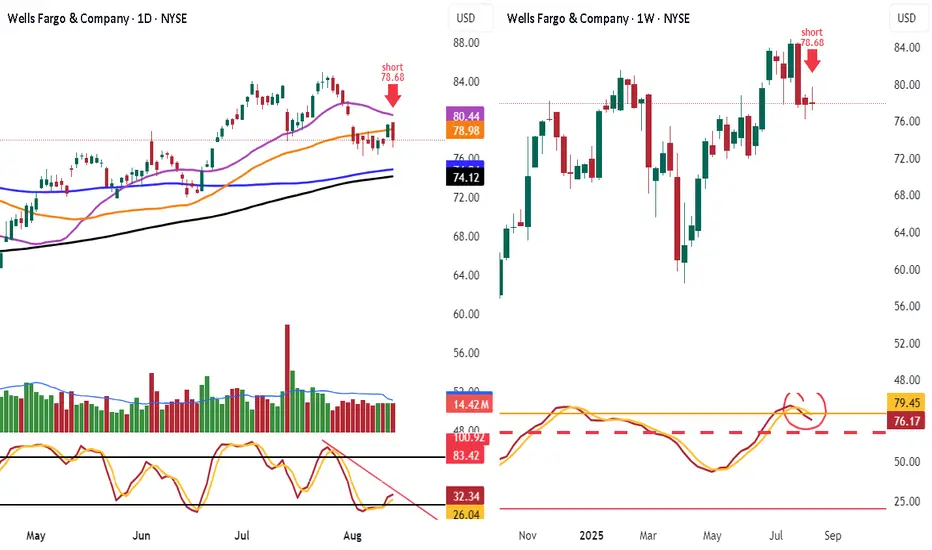
Shorted WFC 78.68 target 74 or lowerLooking at the daily chart u can see we have lower highs, and engulfing candle. Look closely u have 25 day rolling down bottom arrow. We also broke 50 day ma with vol. We have daily stoch heading down.
Also I explain this all time cannot go far in a car with out fuel same with market looking at vo
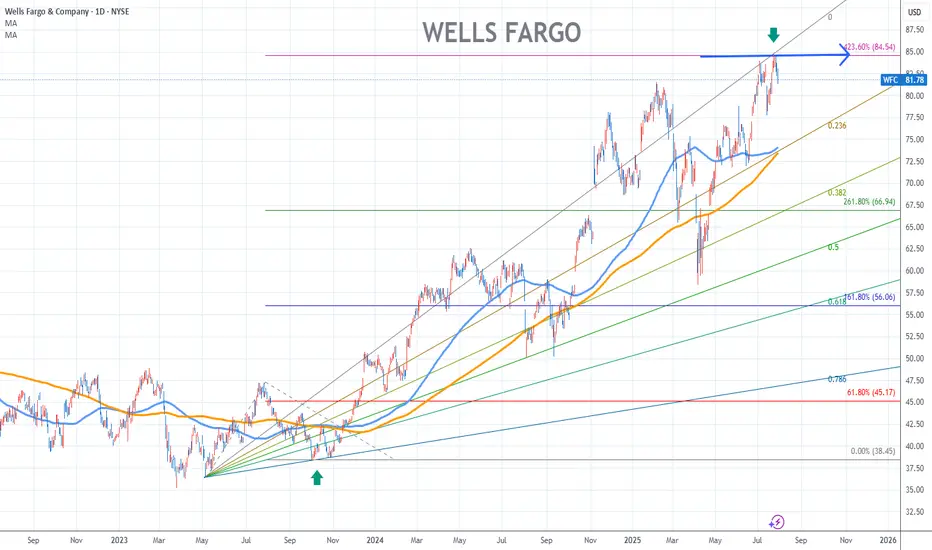
Wells Fargo Stock Chart Fibonacci Analysis 073025Hit the 84.5/423.60% resistance level.
Trading Idea
Chart time frame:D
A) 15 min(1W-3M)
B) 1 hr(3M-6M)
C) 4 hr(6M-1year)
D) 1 day(1-3years)
Stock progress:E
A) Keep rising over 61.80% resistance
B) 61.80% resistance
C) 61.80% support
D) Hit the bottom
E) Hit the top
Stocks rise as they rise fr
Trade Setup: LONG on WFC!📈
🕰️ Timeframe: 30-minute chart
🔍 Pattern: Bull flag / descending channel breakout
📉 Previous Trend: Uptrend with healthy retracement
🧭 Setup: Breakout from short-term correction, aligning with trendline support
🧩 Technical Breakdown:
Support Zones:
$83.00 (holding on ascending trendline)
$82.50
See all ideas
Summarizing what the indicators are suggesting.
Neutral
SellBuy
Strong sellStrong buy
Strong sellSellNeutralBuyStrong buy
Neutral
SellBuy
Strong sellStrong buy
Strong sellSellNeutralBuyStrong buy
Neutral
SellBuy
Strong sellStrong buy
Strong sellSellNeutralBuyStrong buy
An aggregate view of professional's ratings.
Neutral
SellBuy
Strong sellStrong buy
Strong sellSellNeutralBuyStrong buy
Neutral
SellBuy
Strong sellStrong buy
Strong sellSellNeutralBuyStrong buy
Neutral
SellBuy
Strong sellStrong buy
Strong sellSellNeutralBuyStrong buy
Displays a symbol's price movements over previous years to identify recurring trends.
WFC5505680
Wells Fargo & Company 5.5% 23-NOV-2025Yield to maturity
11.38%
Maturity date
Nov 23, 2025
94CY
Wells Fargo & Company 2.5% 02-MAY-2029Yield to maturity
6.83%
Maturity date
May 2, 2029
WFC5429839
Wells Fargo & Company 4.5% 15-DEC-2025Yield to maturity
6.64%
Maturity date
Dec 15, 2025
WFC5679616
Wells Fargo & Company 6.8% 06-NOV-2038Yield to maturity
6.48%
Maturity date
Nov 6, 2038
WFC5707017
Wells Fargo & Company 6.4% 24-NOV-2033Yield to maturity
6.32%
Maturity date
Nov 24, 2033
WFC5643509
Wells Fargo & Company 6.2% 31-AUG-2033Yield to maturity
6.20%
Maturity date
Aug 31, 2033
WFC5711788
Wells Fargo & Company 6.05% 04-DEC-2033Yield to maturity
6.06%
Maturity date
Dec 4, 2033
WFC5804870
Wells Fargo & Company 6.05% 06-MAY-2034Yield to maturity
6.05%
Maturity date
May 6, 2034
WFC5633129
Wells Fargo & Company 5.95% 14-AUG-2033Yield to maturity
6.02%
Maturity date
Aug 14, 2033
WFC5811423
Wells Fargo & Company 5.7% 16-MAY-2034Yield to maturity
6.00%
Maturity date
May 16, 2034
WFC5717269
Wells Fargo & Company 6.0% 13-DEC-2035Yield to maturity
6.00%
Maturity date
Dec 13, 2035
See all WFC bonds
Curated watchlists where WFC is featured.


Frequently Asked Questions
The current price of WFC is 73.36 EUR — it has increased by 0.67% in the past 24 hours. Watch Wells Fargo & Company stock price performance more closely on the chart.
Depending on the exchange, the stock ticker may vary. For instance, on VIE exchange Wells Fargo & Company stocks are traded under the ticker WFC.
WFC stock has fallen by −1.18% compared to the previous week, the month change is a −0.57% fall, over the last year Wells Fargo & Company has showed a 5.21% increase.
We've gathered analysts' opinions on Wells Fargo & Company future price: according to them, WFC price has a max estimate of 87.69 EUR and a min estimate of 72.93 EUR. Watch WFC chart and read a more detailed Wells Fargo & Company stock forecast: see what analysts think of Wells Fargo & Company and suggest that you do with its stocks.
WFC stock is 0.67% volatile and has beta coefficient of 1.37. Track Wells Fargo & Company stock price on the chart and check out the list of the most volatile stocks — is Wells Fargo & Company there?
Today Wells Fargo & Company has the market capitalization of 229.00 B, it has decreased by −2.12% over the last week.
Yes, you can track Wells Fargo & Company financials in yearly and quarterly reports right on TradingView.
Wells Fargo & Company is going to release the next earnings report on Jan 14, 2026. Keep track of upcoming events with our Earnings Calendar.
WFC earnings for the last quarter are 1.41 EUR per share, whereas the estimation was 1.32 EUR resulting in a 7.32% surprise. The estimated earnings for the next quarter are 1.46 EUR per share. See more details about Wells Fargo & Company earnings.
Wells Fargo & Company revenue for the last quarter amounts to 18.27 B EUR, despite the estimated figure of 18.02 B EUR. In the next quarter, revenue is expected to reach 18.75 B EUR.
WFC net income for the last quarter is 4.76 B EUR, while the quarter before that showed 4.66 B EUR of net income which accounts for 2.12% change. Track more Wells Fargo & Company financial stats to get the full picture.
Yes, WFC dividends are paid quarterly. The last dividend per share was 0.39 EUR. As of today, Dividend Yield (TTM)% is 1.96%. Tracking Wells Fargo & Company dividends might help you take more informed decisions.
Wells Fargo & Company dividend yield was 2.14% in 2024, and payout ratio reached 27.96%. The year before the numbers were 2.64% and 26.90% correspondingly. See high-dividend stocks and find more opportunities for your portfolio.
As of Nov 21, 2025, the company has 217 K employees. See our rating of the largest employees — is Wells Fargo & Company on this list?
Like other stocks, WFC shares are traded on stock exchanges, e.g. Nasdaq, Nyse, Euronext, and the easiest way to buy them is through an online stock broker. To do this, you need to open an account and follow a broker's procedures, then start trading. You can trade Wells Fargo & Company stock right from TradingView charts — choose your broker and connect to your account.
Investing in stocks requires a comprehensive research: you should carefully study all the available data, e.g. company's financials, related news, and its technical analysis. So Wells Fargo & Company technincal analysis shows the buy rating today, and its 1 week rating is buy. Since market conditions are prone to changes, it's worth looking a bit further into the future — according to the 1 month rating Wells Fargo & Company stock shows the buy signal. See more of Wells Fargo & Company technicals for a more comprehensive analysis.
If you're still not sure, try looking for inspiration in our curated watchlists.
If you're still not sure, try looking for inspiration in our curated watchlists.