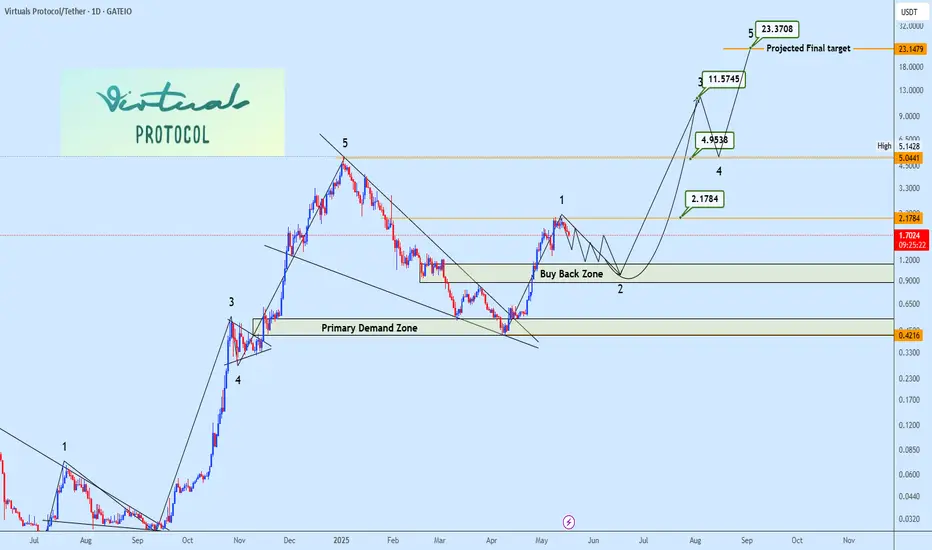
virtual Trade Planhuge wave 1 completion towards the upside making 5 wave of wave 1 complete and now wave 2 is now it's ending Traders can enter this coin slowly for an explosive wave 3 towards ATH
the whole 5 wave target is around 12.62$ making this trade a solid 12 RR

#VIRTUAL #VIRTUALUSD #VIRTUALUSDT #Analysis #Eddy#VIRTUAL #VIRTUALUSD #VIRTUALUSDT #Analysis #Eddy
A reversal structure has formed on the weekly and daily time frames, and the necessary confirmations have been given on the weekly time frame. Considering the structure formed on the above time frame, as well as the behavior of this currency in the

virtual as you see virtual is making great market structure so it will go as high at the point of 1.6 and the dump to 0.5 lets see the market dynamics
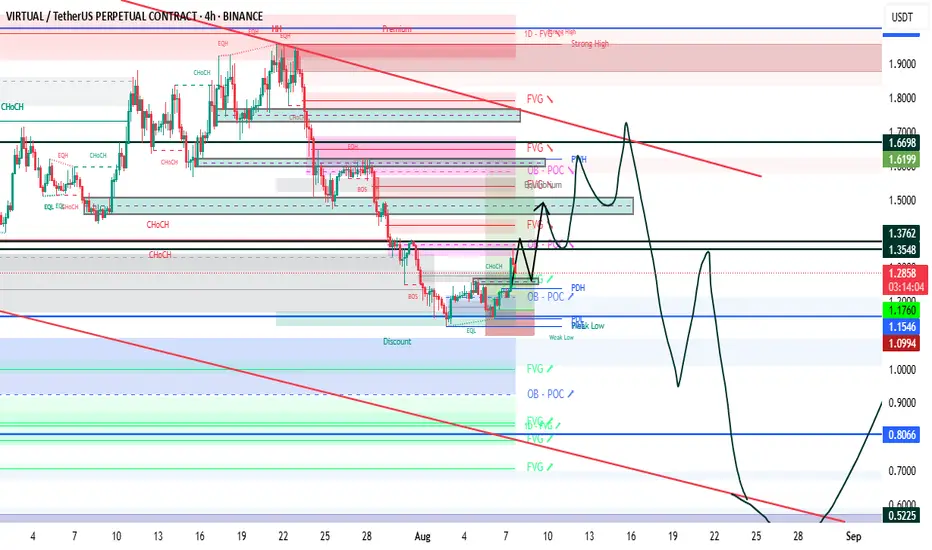
VIRTUAL/USDT – Rebound Incoming or Deeper Collapse?🔍 Overview: Bearish Pressure, But Structure Holds
VIRTUAL/USDT is currently consolidating within a well-defined Descending Channel pattern that has been forming since early May 2025. While the trend is bearish, price action remains within a controlled structure — a potential sign of hidden accumula

VIRTUAL PROTOCOL Wave 2 Correction in Play After 4x ImpulseFollowing the completion of its previous cycle correction, Virtual Protocol confirmed a bullish reversal via a breakout from a falling wedge, initiating Impulse Wave (1) with an impressive ~4x move. Current price action signals the commencement of Wave (2) corrective structure, aligning with standar
$FARTCOIN – Third Time's the Charm?
Back at a solid bid zone—third test of this level, so grabbing a small position here.
A move above $1.60 could trigger a push toward the range high, where I’ll look to offload some as first TP.
Let’s see how this one unfolds. MEXC:FARTCOINUSDT

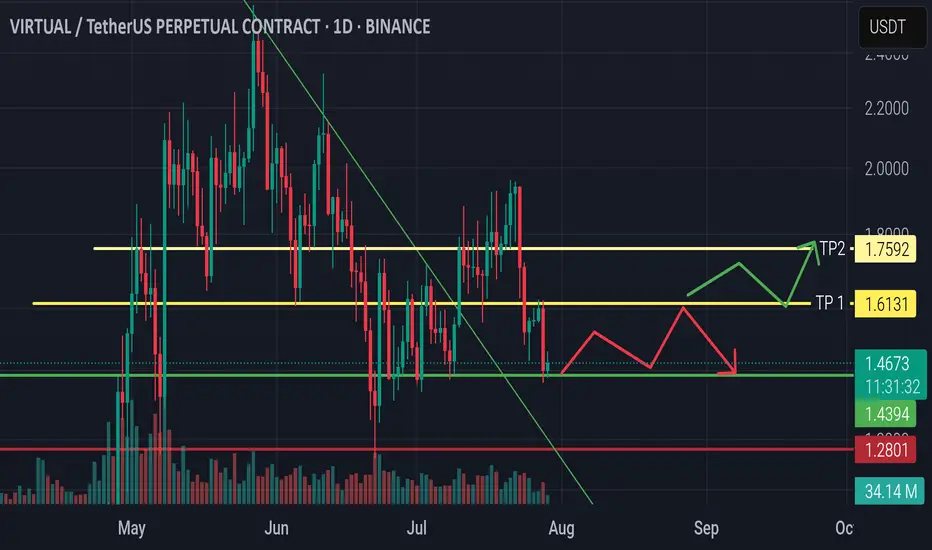
VIRTUAL/USDT – Daily Technical AnalysisThe current price is 1.4578 USDT, showing a slight increase of +0.52%. Here’s what we’re watching:
✅ Potential Entry Point: Near the previous support level at 1.2801 USDT.
🎯 Target Levels: ▪ TP1: 1.6131 ▪ TP2: 1.7592
🔄 Expected Scenarios: If the price holds above the support level, an upward move
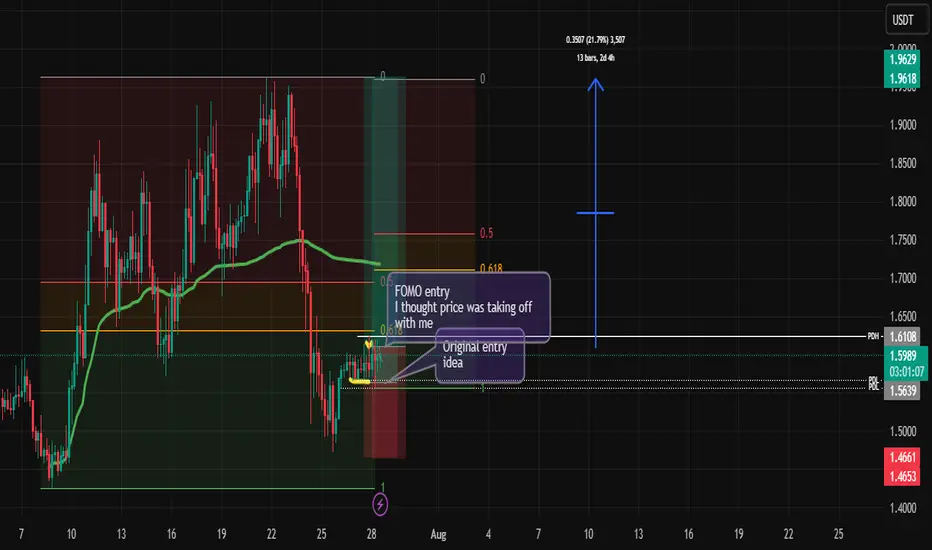
Virtual FOMO and a 20%%????
Like all the others, I am looking for a pump on virtual to grow that spot.
If look closely, I fomo in.
Let's see what happens in by the end of the week.
VIRTUALUSDT – Is the Wedge Nearing Its End? A Breakout Could!⏳ Current Situation:
VIRTUALUSDT is approaching a crucial moment after months of sideways price action. Following a steep decline from its all-time high ($5.25), price action has formed a Falling Wedge pattern — a well-known bullish reversal formation.
Now, as price consolidates toward the wedge's

VIRTUAL – Major Confluence ZoneEntry into 3D S/R and Demand Zone (Blue Box)
The current price action is testing a key 3D support/resistance level, which aligns with a historical demand zone.
Multiple diagonal supports converge here, making it a high-probability zone for a reaction.
Accumulation & Reversal Play
The setup sugge

See all ideas
Summarizing what the indicators are suggesting.
Oscillators
Neutral
SellBuy
Strong sellStrong buy
Strong sellSellNeutralBuyStrong buy
Oscillators
Neutral
SellBuy
Strong sellStrong buy
Strong sellSellNeutralBuyStrong buy
Summary
Neutral
SellBuy
Strong sellStrong buy
Strong sellSellNeutralBuyStrong buy
Summary
Neutral
SellBuy
Strong sellStrong buy
Strong sellSellNeutralBuyStrong buy
Summary
Neutral
SellBuy
Strong sellStrong buy
Strong sellSellNeutralBuyStrong buy
Moving Averages
Neutral
SellBuy
Strong sellStrong buy
Strong sellSellNeutralBuyStrong buy
Moving Averages
Neutral
SellBuy
Strong sellStrong buy
Strong sellSellNeutralBuyStrong buy
Displays a symbol's price movements over previous years to identify recurring trends.