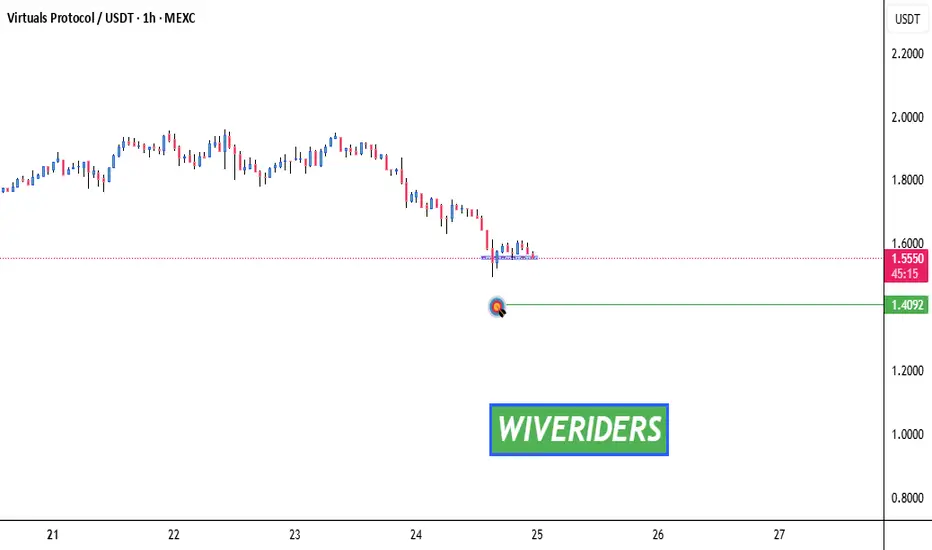
VIRTUAL – Major Confluence ZoneEntry into 3D S/R and Demand Zone (Blue Box)
The current price action is testing a key 3D support/resistance level, which aligns with a historical demand zone.
Multiple diagonal supports converge here, making it a high-probability zone for a reaction.
Accumulation & Reversal Play
The setup suggests that this zone is ideal for building a position.
Expect potential wicks/spikes into the lower blue zone, hunting liquidity before a reversal.
If price holds above ~$1.40 (blue line), look for signs of strength (bullish candles, reclaim of lost support).
Upside Targets
If the zone holds, the first target is the prior local highs ($2.00–2.05).
Further targets are the overhead supply zones (highlighted in red), especially if the momentum persists.
Invalidation
A daily close below $1.40 or sustained trading below the lower blue box invalidates the setup and signals a risk-off environment.
Market insights

Testing Blue Support – Key Level Ahead!🚨 SPARKS:VIRTUAL Testing Blue Support – Key Level Ahead! 📉🔵
SPARKS:VIRTUAL is currently testing the blue support zone.
📊 If a breakdown occurs, we could see a move toward the green line level as the next target.
🛑 Watch for confirmation — this could signal further downside if sellers take control.
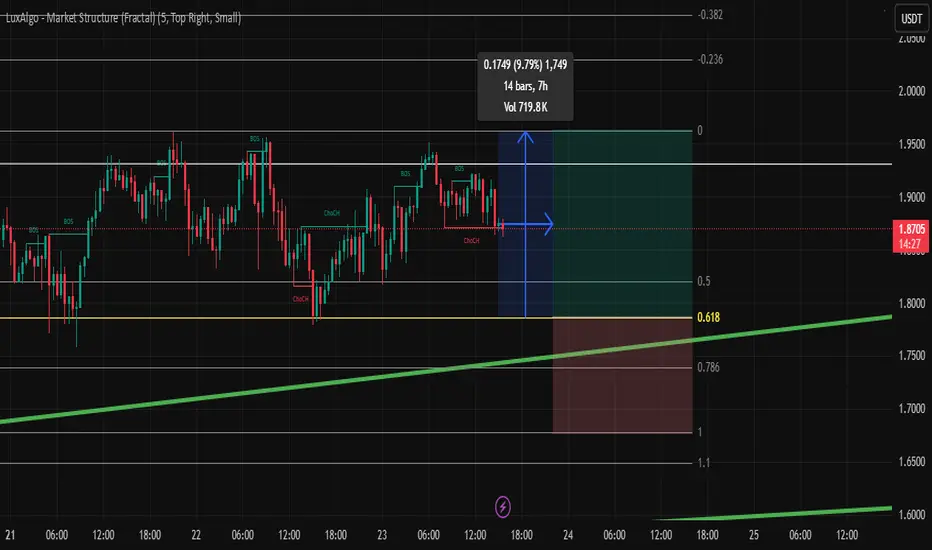
Virtual LongWill London or NY bring Virtual to me at .618, 10PM-Midnight - My trading window?
If it happens, I won't look at any other pairs.
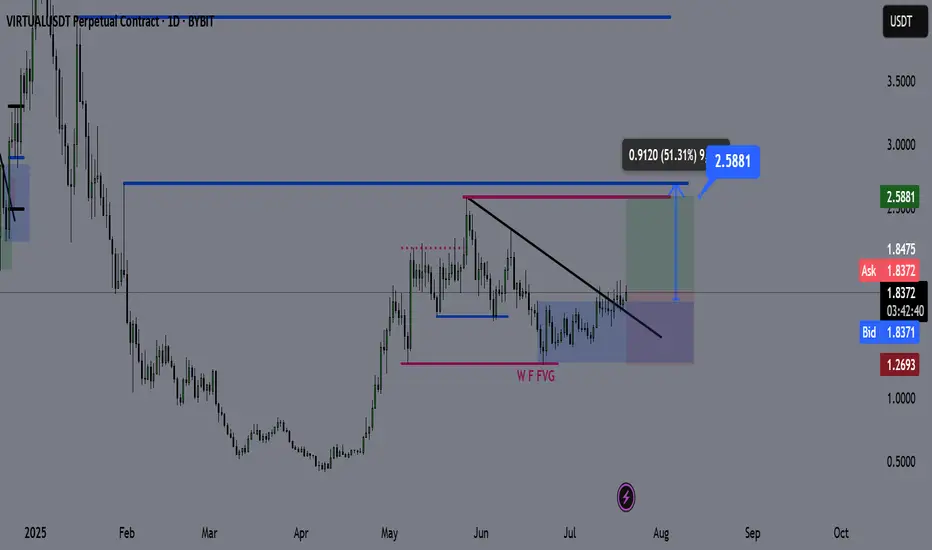
Virtual Coin – Technical Outlook & Trade Plan🔍 Technical Analysis
✅ Price has broken and closed above the bearish trendline, indicating a shift in market structure.
✅ It’s currently consolidating above the trendline, and each retest is showing strong bullish reactions.
✅ The bullish daily demand zone is holding aggressively, reinforcing upward momentum.
I do not expect a significant retracement from here until we reach the purple line (2.59). The current structure suggests price wants to seek higher liquidity.
📌 Trade Plan
Entry: Current market (above trendline + demand zone reaction)
Take Profit (TP): 2.59 (Purple Line)
Stop Loss (SL): 1.26 (Daily Close Below)
📊 Bias: Bullish
🕰️ Timeframe: Daily
📍 Invalidation: Daily close below the demand zone and trendline support
💬 Feel free to share your thoughts or ask questions below!
VIRTUAL LONG IDEA Virtual Long Idea, momentum of ETH is strong and virtual as beta of ETH, might breakout and make good gains
VIRTUAL — Clean MSS+BOS Flip Long | #1D | BULLISH1. Limit order on retest S/R flip (1.65–1.68)
2. Entry after confirmed hold above support
3. Main target: 2.18
4. Stop: Below 1.49

VIRTUALUSDT 12HKeep an eye on the #VIRTUAL 12H timeframe chart. In case of a breakout above the descending resistance and the 12H SMA50, the targets are:
🎯 $1.7682
🎯 $1.9249
🎯 $2.0816
🎯 $2.3048
⚠️ As always, use a tight stop-loss and apply proper risk management.

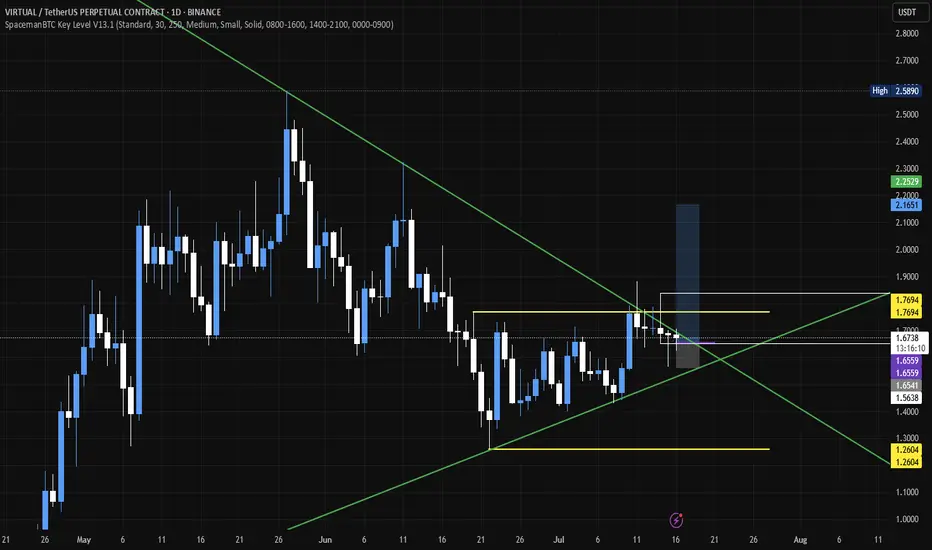
VIRTUAL – Setting Up for a July Breakout - $4 in the Horizon!
Another coin worth bidding on: $VIRTUAL.
It's setting up nicely above the mid-range of the current trading range, with a clean S/R flip off the previous cluster zone.
The 3-day MA is holding well, and the downtrend from the local highs is set to expire on July 6th.
Expecting a strong trend to kick in during the second week of July, with potential to push toward the $4 mark.

VIRTUALUSD WILL BE GO TO MOON On the VirtualUSDT side, most coins are locked, and I’m expecting an increase in price due to the potential of a major project presale.
Hopefully, it works out and you all profit from it.
I’m aiming to generate short-term gains.

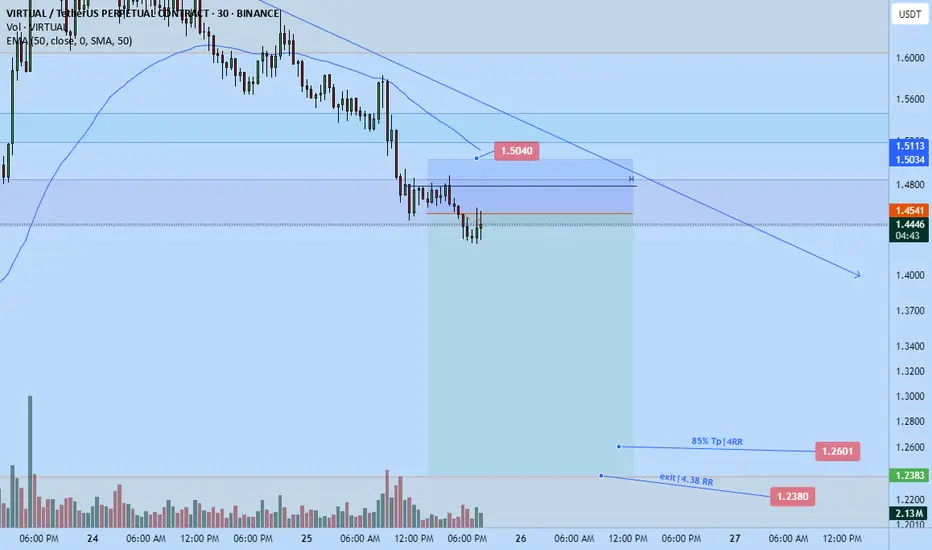
Virtualusdt big shortBig short on Virtualusdt. Just opened it. Roughly 4.38rr. Market looks likely to dump hard. The market started to trend down already as you can see, I expect continuation tonight leading into tomorrow morning
DTT strategy applied- Direction target and timing. It's a topdown analysis approach starting from the monthly and working your way down to the 15 minute tf for alignment
Trade is roughly 4 RR from current entry.
Time sensitive.
Bullish Flag Breakout on VIRTUAL/USDT – Targeting 20%+ Gain! Bullish Flag Breakout on VIRTUAL/USDT – Targeting 20%+ Gain!
After a strong bullish rally, VIRTUAL/USDT is now forming a textbook bullish flag — a continuation pattern that signals potential for another leg upward.
Trend: Clearly bullish on recent impulse
Pattern: Flag forming as a downward-sloping consolidation channel
Volume: Strong volume during impulse, lighter volume during consolidation – perfect textbook setup
Structure: Higher highs and higher lows intact
VIRTUALUSDT #BullishFlag #CryptoBreakout #TechnicalAnalysis #AltcoinSetup #TradingStrategy #CryptoChart #PriceAction #TrendContinuation #SwingTrade #TradingView

Virtualusdt dump continues to $1.655Just recently opened a short position on virtualusdt. Anticipating dump continuation down to $1.6550 today maybe lower.
Looking to take partials along the way.
Tp 1: $1.7045...50% tp or full close depending on price action
Tp 2: $1.6550
Time sensitive, breaking down rn.

VIRTUALUSDT Perpetual – Breakout Long Setup from ConsolidationVIRTUALUSDT has shown signs of accumulation with a series of higher lows followed by a breakout above the local resistance zone around $1.8398, suggesting the potential start of a bullish leg.
Trade Details:
Position: Long
Entry: $1.8398
Stop Loss: $1.7683
Take Profit: $2.0858
Setup Type: Breakout from Range / Early Trend Continuation
Setup Rationale:
Market broke above consolidation range, triggering a long opportunity
Clear bullish momentum supported by consecutive higher lows
Favorable risk/reward ratio for swing or short-term continuation traders
Target aligns with previous resistance zone above $2.08
This setup anticipates a continuation move to the upside following the breakout, with a well-defined stop below the previous swing low.

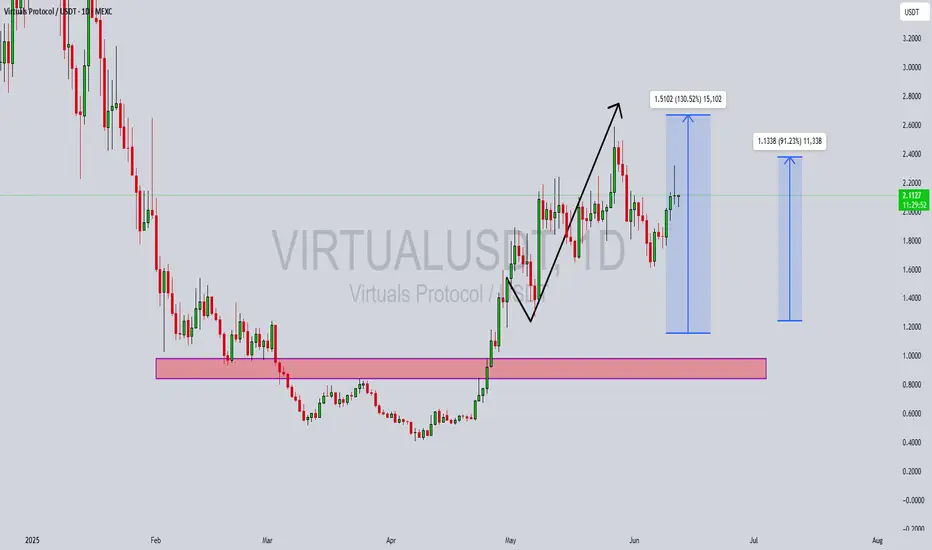
VIRTUALUSDT Forming BullishVIRTUALUSDT is showcasing a powerful bullish structure after a prolonged accumulation phase near the $0.80 to $1.00 support zone. The breakout from this accumulation base has resulted in a parabolic move, confirming a strong shift in trend. Currently, the pair is forming a bullish continuation pattern, with high volume inflows suggesting increasing investor confidence. The recent consolidation above previous resistance is a positive signal for trend continuation, and technical targets show potential for a 120% to 130% upside in the coming sessions.
The setup aligns with classic market psychology, where a strong move is often followed by a period of profit-taking before the next leg higher. The technical projection zones around $2.60 to $3.00 are realistic based on the depth of the prior impulse move. Furthermore, VIRTUALUSDT is gaining traction in the DeFi and virtual asset space, with its protocol generating buzz in 2025's altcoin resurgence. This combination of narrative and chart structure makes it a potential top mover.
From a risk-reward perspective, this pair presents a favorable long entry with minimal downside if stop losses are positioned just below recent swing lows. As the broader market recovers, strong technicals like these could deliver amplified gains compared to average tokens. It's worth noting that smart money often positions itself before explosive runs—and this chart suggests accumulation has already occurred.
Investors and swing traders should keep this pair on their radar as it continues to carve higher highs and higher lows. If momentum persists, VIRTUALUSDT could become one of the standout performers in the altcoin space this quarter.
✅ Show your support by hitting the like button and
✅ Leaving a comment below! (What is You opinion about this Coin)
Your feedback and engagement keep me inspired to share more insightful market analysis with you!
Virtual usdt scalp long to $2.06Just now entered this trade.
Stop: $1.8557
Tp: $2.06
Roughly 2 RR for me
Pa suggest higher prices based on my DTT analysis. Plus there is some fundamental news about this token recently which can help drive demand

Update on VirtualNow we need to break above the red line to form a BOS and then I will look for an OB or FVG on the 15m timeframe as my confirmation entry.
You may market enter now as you wish but not more than 0.25% of capital.

VirtualQuick little demographic showcasing Virtual. With a step by step guide on how I would go over a trade. Please do not copy this, only take notes and later apply on your own trades.

VIRTUAL/USDT Analysis – Looking for a Long Position
This asset is in a strong upward trend.
Currently, price has reached the area of interest at $2.35, which was previously formed by absorption of market sell orders. A reaction is already taking place.
We are considering a long entry:
either from the breakout structure on the lower time frame (marked on the chart),
or after a test and reaction from the stronger volume zone at $2.26–$2.20.
This publication is not financial advice.

VIRTUAL PERPETUAL TRADE, Sold From $2.43VIRTUAL PERPETUAL TRADE
VIRTUAL SELL SETUP
Currently $2.43
Sold From $2.43
(Trading plan If VIRTUAL go up to $2.56
will add more shorts)
Expecting target $2.34 OR DOWN
Incase of early exist will update this anaylsis
Its not a Financial advice

Buy Trade Strategy for VIRTUAL: Backing the Future of Digital WoDescription:
This trading idea is based on VIRTUAL, a cryptocurrency designed to power the next generation of digital environments, including metaverses, virtual reality ecosystems, and decentralized online experiences. As interest in immersive digital spaces continues to grow, VIRTUAL offers a utility-focused solution for transactions, content creation, and governance within these ecosystems. Backed by a visionary roadmap, strategic partnerships, and community-driven development, VIRTUAL aims to play a foundational role in shaping how people interact and transact in online spaces.
The project’s relevance increases as more industries—from gaming to education—explore virtual applications and Web3 integrations. However, the cryptocurrency market is highly speculative, and the success of projects like VIRTUAL depends on adoption rates, technological milestones, and overall market conditions.
Disclaimer:
This trading idea is intended solely for educational purposes and does not constitute financial advice. Investing in cryptocurrencies, including VIRTUAL, involves significant risk and volatility, and may result in the complete loss of capital. Always perform independent research, consider your financial position, and consult a qualified financial advisor before making any investment decisions. Past performance is not a reliable indicator of future results.

VIRTUAL – Ascending Channel and Major Resistance Test on 4H🟢 On the 4H chart, VIRTUAL is moving within an ascending channel and is now testing a strong horizontal resistance near the 2.17 level — a zone it has struggled to break multiple times.
🚀 A confirmed breakout above 2.17 could open the door to a rally toward 2.50+, while a rejection from this level may lead to a retrace toward the 1.80 support zone.
👀 Momentum is building — this next move could define the short-term trend.
CRYPTO:VIRTUALUSD

$VIRTUAL Breakout Alert!!A clean inverse head and shoulders pattern has just triggered, and we’ve already seen a strong breakout above the neckline!
This is a classic bullish reversal signal, and the chart is screaming momentum
🟢 Key Levels:
• Entry around the neckline breakout
• Targets lined up: $2.36, $2.59, and $2.89
• SL below right shoulder: $1.91 for risk control
The 200 EMA is now sloping upward — further confirmation of trend shift!

VIRTUAL TA Masterclass — Elliott Wave Meets Gartley HarmonicVIRTUAL has been on fire! Printing a clean 5-wave Elliott impulse with a +431% run in just 33 days. But after every strong trend comes a healthy correction, and that’s where we likely are now. Trading below key resistance and showing signs of exhaustion. The question: Where is the next high probability trade setup?
Let’s break down what the chart is telling us.
🧠 Structure Overview
Wave 5 peaked at $2.2169
Wave A dropped -25%
Wave B bounced +30%
Currently: VIRTUAL's trading under the $2 psychological level and weekly open ($2.0358) → signs of momentum cooling
A corrective Wave C is likely underway, and all signs point toward a very specific zone.
⚠️ Liquidity Dynamics
The longer VIRTUAL grinds sideways near $2.00 without showing real momentum, the more vulnerable late long positions become:
Retail traders are buying resistance
SLs are likely clustered just below Wave A’s low
This creates a liquidity pocket waiting to be swept — perfect fuel for Wave C
🔍 The $1.58–$1.47 Support Cluster: 14 Layers of Confluence
This zone isn’t guesswork — it’s loaded with technical overlap:
1️⃣ 1:1 Trend-Based Fib Extension of Wave A → $1.573
2️⃣ Monthly Open → $1.5354
3️⃣ 0.382 Fib Retracement of the entire rally → $1.5295
4️⃣ Bullish Fair Value Gap → $1.57–$1.53
5️⃣ Anchored VWAP from ATH → ~$1.46
6️⃣ Anchored VWAP from Wave 3 → ~$1.46
7️⃣ 0.618 Fib Speed Fan Support (~end of May timing)
8️⃣ 4H 233 SMA → ~$1.52
9️⃣ 4H 200 EMA → ~$1.52
🔟 Daily 200 SMA → $1.5251
1️⃣1️⃣ Weekly 21 SMA → $1.462 (reinforces the VWAP zone)
1️⃣2️⃣ Declining Daily Volume → momentum weakening
1️⃣3️⃣ Liquidity Pool below Wave A → likely to be swept
1️⃣4️⃣ $2 = Golden Pocket Resistance + Psychological Barrier
🔴 Short Trade Setup (Active as Long as SFP Holds)
For those favouring downside continuation toward the Wave C target, a short setup is in play:
Entry: Weekly open retest around $2.0358
Stop-loss: Above SFP high at $2.143
Target: 1:1 Trend-Based Fib Extension of Wave A → $1.573 or the Swing Low of Wave A at $1.647
R:R ≈ 1:4 — a solid, well-structured short opportunity
As long as price remains below the SFP and the $2.00 golden pocket resistance, bears maintain control.
🟢 Long Trade Setup
Entry: Ladder between $1.58–$1.47
Avg. Entry: ~$1.53
SL: Below $1.40
TP1: $1.88 (local resistance) → R:R ≈ 1:2.5
TP2: $3.33 (0.618 Fib of entire bear market) → R:R ≈ 1:12
👉 Bonus TP for Harmonic Setup: 0.618 Fib of CD leg
✨ Bonus Confluence: Potential bullish Gartley Harmonic in Play
VIRTUAL is also forming a valid Gartley harmonic pattern — one of the most reliable reversal setups in classical trading theory.
🔸 XA: B retraced to 0.602 → ✅ (criterion: ~0.618)
🔸 AB: C retraced 0.87 → ✅ (valid range: 0.382–0.886)
🔸 CD: Projected to complete at 0.786 of XA → ~$1.474
• CD is a 1.356 expansion of BC
• AB ≈ CD symmetry is valid
• TP = 0.618 retracement of CD leg
This adds even more weight to the $1.47–$1.53 buy zone.
📘 Educational Takeaway
The best setups don’t rely on one method — they align multiple disciplines. Here, we have Elliott Waves, Fibonacci retracements, anchored VWAPs, volume structure, moving averages, time symmetry, and now a harmonic pattern — all pointing to the same opportunity. Most traders never wait for alignment. That’s why most lose.
💬 Final Words
✍️ Smart trading isn’t about always being in a trade — it’s about being in the right one at the right time.
While others FOMO at $2, you wait for the right opportunity to come to you — where structure, liquidity, and probability all shake hands.
The patient are rewarded. Always.
___________________________________
If you found this helpful, leave a like and comment below! Got requests for the next technical analysis? Let me know.
