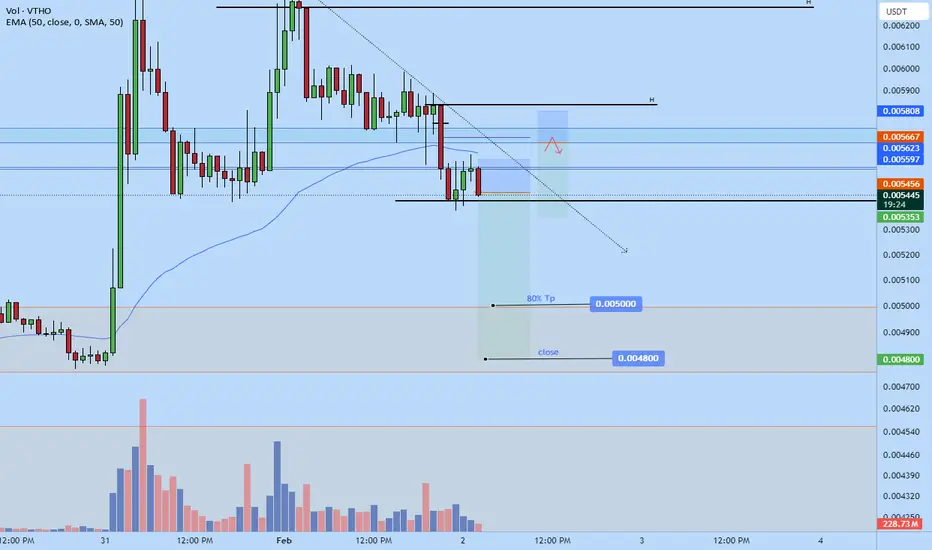
$vtho short ot $0.0048Just now opened a short on $vtho. I anticipate that it will fall down to $0.0048 starting now.
Time senstive
Market insights
I see a bullish movement coming!BINANCE:VTHOUSDT
VTHOUSDT is crafting a rounded bottom which is of course a bullish pattern!
we can expect the price to reach the following prices in the coming days!
⚠️ Disclaimer:
This is not financial advice. Always manage your risks and trade responsibly.
👉 Follow me for daily updates,
💬 Comment and like to share your thoughts,
📌 And check the link in my bio for even more resources!
Let’s navigate the markets together—join the journey today! 💹✨

VTHO could spike 150% VTHO spike roughly 400% last Tuesday because of new token list to Korean exchange which catch my attention. I watched this chart for week and I believe this could spike another 150% if Big whales step in the buy zone or announcements.
I believe .007 is heavy resistance zone worst case if reject at, fail to reach, or BTC/ETH dump occur then I'll cut position and move on from this token.
VTHO must hold at around .005.
Just sharing my ideas. I do not provide financial advice and I am not a qualified licensed investment advisor. I'm just trading here as my side hustle.


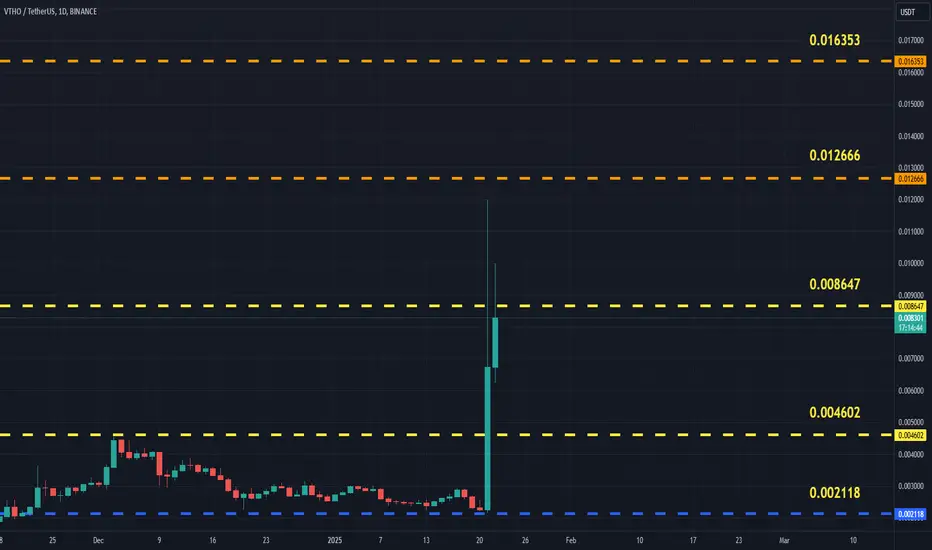
VeThor’s(VTHO)+450% Boom: Fundamentals & Technical Insights!🎂 Today marks the beginning of a new chapter in my life! My biggest wish for this year is to grow stronger together with all of you—my amazing followers. I hope to provide even better insights, share more valuable trading strategies, and help us achieve both profits and health and happiness. 🎂
--------------------------------------------
In the last 24 hours, the VeThor Token ( BINANCE:VTHOUSDT ) project has managed to increase by more than +450% . Let's take a look at the reasons for the VeThor Token(VTHO) increase :
The fundamental reason behind the recent surge in VeThor Token (VTHO) could be attributed to increased network usage and adoption of the VeChain blockchain :
Higher Network Activity : The VeChain( BINANCE:VETUSDT ) ecosystem has seen growing adoption in industries like supply chain, logistics, and sustainability, leading to increased demand for VTHO to pay transaction fees.
New Partnerships and Integrations : Announcements of new collaborations and partnerships involving VeChain have boosted investor confidence, indirectly driving demand for VTHO.
Technical Upgrades : Improvements in the scalability and efficiency of the VeChain network have made it more appealing for developers and businesses, increasing VTHO's utility.
Speculation and Market Sentiment : Positive sentiment and speculation about VeChain's future potential have likely influenced short-term trading volume and price spikes for VTHO.
--------------------------------------------
Let's take a look at the Technical Analysis of the VTHO token :
During the last 24 hours, VTHO seems to have managed to break the Heavy Resistance zone($0.0070-$0.0037) . One of the signs of a valid failure is that it is broken with a large volume of this zone .
Regarding Elliott wave theory , it seems that VTHO has successfully completed the main wave 3 above the Heavy Resistance zone($0.0070-$0.0037) and is currently completing corrective waves . Probably, the structure of corrective waves is Zigzag type(A-B-C/5-3-5) .
I expect VTHO to start increasing again after the -30% decrease from Potential Reversal Zone(PRZ) and at least increase(+40%) to the Resistance line, and if the Resistance line is broken , we can confirm the end of the main wave 4 and wait for further increase of VTHO .
Note: If VTHO goes below the Potential Reversal Zone(PRZ) , we can expect further price reduction of this token.
Please respect each other's ideas and express them politely if you agree or disagree.
VeThor Token Analyze (VTHOUSDT), 1-hour time frame.
Be sure to follow the updated ideas.
Do not forget to put Stop loss for your positions (For every position you want to open).
Please follow your strategy and updates; this is just my Idea, and I will gladly see your ideas in this post.
Please do not forget the ✅' like '✅ button 🙏😊 & Share it with your friends; thanks, and Trade safe.

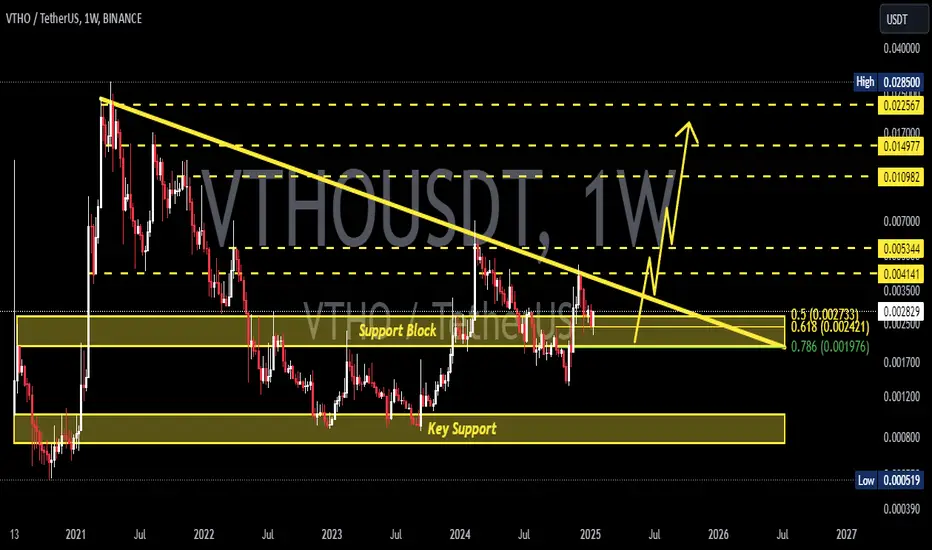
VTHO Token Analysis: Mid-Term TargetsThe main plan for the bull market was shared back in June 2023, but today, let's focus on mid-term targets and refine key points. BINANCE:VTHOUSDT
1. Accumulation Zones
Clear accumulation zones are highlighted on the global chart.
If you accumulated near these zones, it would make sense to take partial profits after the new listing on a Korean exchange.
2. Mid-Term Targets
Mid-term targets are clearly marked on the chart.
The red block represents a logical zone for profit-taking.
If the timeline aligns with spring 2025 and Bitcoin dominance drops to around 40%, it would be a good point to exit the position completely (100%).
3. Belief in ATH
If you believe in a potential all-time high (ATH), you can wait for higher targets. This analysis reflects my personal observations.
4. Weekly Chart Compression
On the weekly chart, we’ve partially removed the compression that formed back in 2022, but not entirely.
5. Market Mood Indicator
My Market Mood indicator perfectly highlighted the accumulation zone during the capitulation phase.
Everyone who wanted to accumulate VTHO had plenty of time to do so.
6. Money Power Indicator
My Money Power indicator shows:
Blue columns represent where large players accumulated VTHO.
Orange columns represent where partial profit-taking occurred.
At this point, I believe we can continue moving toward major targets.
Hope you enjoyed the content I created! You can support this idea with your likes and comments so more people can see it.
✅ Disclaimer: Please be aware of the risks involved in trading. This idea was made for educational purposes only, not for financial investment purposes.
Check out my ideas about interesting altcoins in the related section below ↓
For more ideas, please hit "Like" and "Follow"!

How long #VTHO will make in this bull cycle??
#VTHO had made a great move yesterday ... According to elliott wave micro count, it has completed it's 3rd wave and now will move towards 4th corrective wave into green box region....
It must hold that region and then it will complete it 5th wave which equally matches with the target of 3rd macro count....
After 3rd macro count we can see slight pullback creating 4th corrective wave and then final macro 5th impulse wave will be made by #VTHO

VTHOUSDT (VeThorToken) Updated till 22-01-25VTHOUSDT (VeThorToken) Daily timeframe range. we can see a insane pump from its local low. PA trying to get out of 0.008647 it tried once this will be second try. a cooldown would be more healthy here for next push rather fall directly back to its old low.
VTHOUSDT UPDATEVTHOUSDT is a cryptocurrency trading at $0.002696. Its target price is $0.003800, indicating a potential 45%+ gain. The pattern is a Bullish Falling Wedge, a reversal pattern signaling a trend change. This pattern suggests the downward trend may be ending. A breakout from the wedge could lead to a strong upward move. The Bullish Falling Wedge is a positive signal, indicating a potential price surge. Investors are optimistic about VTHOUSDT's future performance. The current price may be a buying opportunity. Reaching the target price would result in significant returns. VTHOUSDT is poised for a potential breakout and substantial gains.

VTHOUSDT 1WVTHO ~ 1W
#VTHO So far it still maintains its bullish structure. If you still have Conviction on this coin,. Buy gradually within this support block with a minimum target of 20%+
VTHOUSDT trading ideaVTHOUSDT has completed its corrective phase, breaking out of a descending channel to form an initial impulsive wave 1. Subsequently, a corrective falling wedge emerged, followed by another breakout signaling potential continuation.
The immediate buyback zone is critical for re-entry opportunities, while the neckline serves as the next resistance level. A breakout above the neckline will shift focus to the proposed rounding bottom neckline as the primary resistance zone.
The final target for this setup is highlighted on the chart. Share your thoughts on VTHO's potential!


$VTHO LEAVING ACCUMULATION ZONE$VTHO has been in Wyckoff accumulation for a number of months now.
We are now entering SOS (Sign of Strength) where we consolidate before Phase E.
Phase E is set to be explosive and i expect us to move very quickly.
Good luck!

$VTHO CUP AND HANDLE$VTHO has formed a nice cup and handle on the 4hr chart.
I am expecting an explosive move to 0.0032 upon breakout.

$VTHO to 0.0045We are currently trading in a bull pennant.
I am expecting another move to the upside with a target of $0.0045

$VTHO INVERTED H&SGood day traders!
As you can see, VTHO has formed a nice Inverted H&S.
I expect this to break the neckline shortly and result in an explosive move to around 0.0032.
Good luck!

Long Signal of VthoUsdt
⚠️ Disclaimer: This is the Goldsignal team's analysis and the trader is responsible for any trade and any profit or loss.
⚠️ Important note: If you are a beginner and do not have the ability to get approval to enter, do not use the analysis of this page in any way.
🕚 Time: We must close our trade on the date specified in the chart under any circumstances whether the target is selling or not and is in loss.
⚠️ Partial exit in targets (the best and most important target is the first target) and management of entry capital and entry confirmation as well as selection of suitable stop with "Trader".
We hope you will be profitable 🌺

$VTHO 1,000 DAY CONSOLIDATIONVTHO has been consolidating in this range below 4.2c for 1,000 days now.
It is also nearing the end of an even longer resistance.
When this breaks, this coin will EXPLODE.

VTHO.1Ddaily chart of VTHOUSDT, we observe that the asset has been in a prolonged downtrend, followed by periods of sideways consolidation. The price structure suggests that the asset has been trading in a narrow range after experiencing a significant price decline in previous months. This is an indication of diminishing volatility, with potential accumulation taking place.
Support and Resistance Levels:
Support Levels: The primary support level (S1) stands at 0.001658, which has been tested multiple times in the past. This level has held strong, preventing further downside movements and acting as a key level for bullish defense. The next support level, S2 (0.000743), lies significantly lower, representing a critical area in case the price breaks below S1. S2 is the last stronghold for bulls, as a break below this level would signal a continuation of the longer-term bearish trend.
Resistance Levels: The key resistance to watch is R1 (0.003239). This level coincides with the recent swing highs and would be a critical point to break for any substantial bullish momentum. If the price manages to break above R1, it could trigger further upside, with the next potential target being much higher.
Stochastic RSI: The Stochastic RSI is in the neutral zone, providing no clear signals of overbought or oversold conditions. However, it is currently sloping upward, which could indicate a potential bullish reversal in the near term if the momentum continues. A bullish crossover in this region could serve as a confirmation signal for upward price movement.
Conclusion: VTHOUSDT is currently in a consolidation phase, with support at S1 (0.001658) acting as a strong floor for the price. As long as this support holds, there is a possibility of a bullish reversal, especially if the price can break through the key resistance at R1 (0.003239). However, failure to hold above S1 could result in a deeper correction, potentially testing the lower support level at S2 (0.000743).
In conclusion, while the market shows signs of accumulation and a potential recovery, the price needs to clear resistance at R1 to confirm the start of a bullish trend. Until then, the outlook remains cautiously optimistic, with key levels of support and resistance dictating the next price action.

VeThor (VTHO): Trading Between 200EMA and Support ZoneVeThor has formed a nice support zone here while bounching back and forth from this zone to EMAs.
We are now looking for a possible further downward pressure from here and then a possible bounce back towards the EMAs. All that movement will eventually end and result in a very sharp break so eyes on those 2 zones now!
Swallow Team

VeThor (VTHO): Strong Bearish Trend (Possible Buy Zone?)VeThor coin is on a strong bearish trend where price has been forming lower lows and showing good pressure from sellers.
Yet we are looking for any kind of re-test to upper zones here so the best option here of course, would be to trade inside that bearish channel where price bounces from one side to another, but if we see any attempt of breakout from upper resistance, we might see some recovery to happen here so eyes on the channel!
Swallow Team

VTHO BULLISH DIVERGENCE Target 0.009379LOWER LOWS with LOWER LOWS means BULL RUN. My two diamonds have confirmed our next move for VTHO. Compare with history
I've added a smart money trap which is a TRUE PRICE VALUE. The trend will be rejected here but sometime later will continue to move up but if BITCOIN falls, all ALTS will devalue.
Make sure BITCOIN remains BULLISH.

VTHO: Reads BULLPRINT OUT COMPLETION DATE 8/23Whales plot for price guidance. Smart Money contractions for consolidation mean the price to be wavy within the smart money value line.
Whale signal gives evidence for price movement BLAST to happen soon.
Pay close attention:
The bull printout shows the date the BULL gets unleashed with power. Yet does not mean to wait for that date. VTHO will be moving up and wherever the price ends up at by 8/23, the price launches from there.
It's important to know that, the BULL print is ready and completed, and VTHO is held for whatever reason by WHALES. VTHO will make its move slow or fast until 8/23 before the BULL is loose.
Before or after 8/23, from wherever the price is with VTHO, there is usually a dump BEAR TRAP. THIS WILL CAUSE PLENTY OF RETAIL INVESTORS TO PANIC AND SELL BEFORE THE ROCKET LAUNCH
