Can Tech Strength Still Drive Markets Amid Trade Tensions?Macro approach:
The Nasdaq 100 (USTEC) began Jun with strong momentum after its best monthly performance since 2023, fueled by robust tech earnings and a brief lull in tariff concerns.
- However, renewed US-China trade tensions resurfaced early in the week, briefly weighing on sentiment before a market rebound restored cautious optimism.
- Nvidia (NVDA) surged due to the continued demand for AI chips. At the same time, Tesla (TSLA) drew investor focus ahead of its 12 Jun robotaxi launch, helping maintain positive momentum in the face of geopolitical uncertainty.
Technical approach:
- USTEC is now testing the previous swing high near 218000, staying above both EMAs, a sign of ongoing bullish strength.
- A clear break above 21800 would likely open the path toward the record-high zone near 22200.
- Failure to do so may trigger a pullback toward the nearest support of around 20700.
Analysis by: Dat Tong, Senior Financial Markets Strategist at Exness
USTECH100CFD trade ideas

[NAS100] Range Breakout Retest – Is Upside Continuation in Play?The NAS100 (US100) on the 4H chart is exhibiting a bullish structure following a recent breakout and retest of the 21,000.0 key resistance level, now acting as support. After forming a local high near 21,777.3, price retraced and is now attempting a second push higher, suggesting buyer strength.
Currently trading at 21,450.0, with
Support at: 21,000.0 🔽
Resistance at: 21,777.3 🔼 and 22,230.7 🔼
🔎 Bias:
🔼 Bullish: If price holds above 21,000.0 and breaks cleanly above 21,777.3, next upside target is 22,230.7.
🔽 Bearish: A drop back below 21,000.0 could open the door for a deeper retracement toward 20,200.0.
📛 Disclaimer: This is not financial advice. Trade at your own risk.

NASDAQ - SellsHey fellow traders - did you see the sells today on the US100?
Same as a few other pairs - had very good signal alerts to have take.
As per instructions - you always enter on the label print with SL above or below the signal bar - depending on buys or sells.
Hope you are enjoying the indicators we made available.

Hanzo / Nas100 15 Min Path ( Confirmed Break Out Zones )🔥 NAS100 – 15 Min Scalping Analysis (Bearish Setup)
Bias: Waiting For Break Out
Time Frame: 15 Min
Entry Type: Confirmed Entry After Break Out
👌Bullish After Break : 21310
Price must break liquidity with high volume to confirm the move.
👌Bearish After Break : 21125
Price must break liquidity with high volume to confirm the move.
☄️ Hanzo Protocol: Dual-Direction Entry Intel
➕ Zone Activated: Strategic Reaction from Refined Liquidity Layer
Marked volatility from a high-precision supply/demand zone. System detects potential for both long and short operations.
🩸 Momentum Signature Detected:
Displacement candle confirms directional intent — AI pattern scan active.
— If upward: Bullish momentum burst.
— If downward: Aggressive bearish rejection.
💯 Market Zone: Transition Phase
Asset in premium-to-discount (or vice versa) range — valid for both reversal and continuation trades. Execute with precision.

US 100 – Further Moves Await NVIDIA Earnings UpdateGlobal stock indices have reacted positively at the start of this new trading week to President Trump’s decision to extend a deadline which would impose a tariff of 50% on EU goods imported into the US from June 1st to July 9th.
Taken alongside a new willingness being signalled from the EU side to speed the negotiating process along in key areas, means trader hopes have increased that a deal between the first and third largest of the world’s economies can be agreed in principle within the allotted time.
Focusing on US stock indices, the US 100 has risen 2.4% this week, taking it only a small step away from its recent highs at 21493 seen on May 20th. However, later today, the rally is about to face possibly its biggest challenge of the week in the form of earnings from the second biggest company on the planet ($3.3 trillion mkt cap) and AI bellwether NVIDIA, which are released after the market close.
Traders will not only be looking to judge company’s actual performance against expectations but will be eager to receive updates on the impact of President Trump’s tariffs on future revenue, chip deals with the Middle East, competition and its outlook for AI demand moving forward.
Answers to these questions and others may well impact sentiment towards technology stocks and the US 100 moving into the end of the week, and month, on Friday.
With increased volatility a possibility, knowing the technical outlook can also be helpful.
Technical Update: Focus on the May Highs at 21493
While last week did see correction themes develop within the US 100 index, there appears to be no clear-cut signs of a negative sentiment shift yet, as fresh buying developed above support provided by the rising Bollinger mid-average, currently at 20772 (see chart below).
However, looking forward, if the NVIDIA earnings prompt an increase in US 100 price volatility, what are the levels traders may be watching for clues to the next directional themes?
Potential Support Levels:
It is possible the rising Bollinger mid-average, currently at 20772, represents a first support for traders, and as such, closing breaks below this level might lead to a more extended phase of price weakness.
Such moves while not a guarantee of declines, could lead to a deeper sell-off towards 20001, which is equal to the 38.2% Fibonacci retracement of April 21st to May 20th 2025 price strength.
Potential Resistance Levels:
With this week seeing fresh price strength emerge from above the rising Bollinger mid-average, a positive price pattern of higher highs and higher lows, may still be evident. This reflects buyers currently being willing to pay higher prices, each time a setback materialises.
However, to maintain this uptrend pattern in price, the focus could now be on resistance provided by the May high at 21493 (May 20th), with closing breaks above this level required to suggest further strength might then be on the cards, towards what could prove to be the next potential resistance level at 22226, which is the February 18th 2025 all-time high.
The material provided here has not been prepared in accordance with legal requirements designed to promote the independence of investment research and as such is considered to be a marketing communication. Whilst it is not subject to any prohibition on dealing ahead of the dissemination of investment research, we will not seek to take any advantage before providing it to our clients.
Pepperstone doesn’t represent that the material provided here is accurate, current or complete, and therefore shouldn’t be relied upon as such. The information, whether from a third party or not, isn’t to be considered as a recommendation; or an offer to buy or sell; or the solicitation of an offer to buy or sell any security, financial product or instrument; or to participate in any particular trading strategy. It does not take into account readers’ financial situation or investment objectives. We advise any readers of this content to seek their own advice. Without the approval of Pepperstone, reproduction or redistribution of this information isn’t permitted.

US100 - Bullish Momentum Favors Upside ContinuationThe US Tech 100 is displaying strong bullish momentum after successfully breaking above the critical resistance level at 20,659.8, which had previously acted as a significant barrier. Currently trading at 21,316 the index has demonstrated impressive upward trajectory following what appears to be a healthy consolidation phase around the key resistance-turned-support zone. The technical setup strongly favors continuation to the upside as the higher probability scenario, with the breakout above 20,659.8 potentially opening the door for further gains toward higher resistance levels. However, prudent risk management suggests taking this rally piece by piece, monitoring how price action develops at each significant level while watching for any signs of exhaustion or pullback that might offer better entry opportunities. The bullish bias remains intact as long as the index maintains its position above the former resistance level, which should now serve as dynamic support for any potential retracements.
Disclosure: I am part of Trade Nation's Influencer program and receive a monthly fee for using their TradingView charts in my analysis.

Recession post #9778Trial and error describes my past calls considering there was resistance and pullbacks on the daily tf but this time I'm certain
abso-tut-ely
Posi-tively
Demise
Trumps attempts have played out like a witty protagonist of a finance suspense thriller but that has nothing to do with the historical alignments of boom and bust systems. I think he intended to crash markets so it could recover but I'm not convinced this tank is greater than this

Falling towards pullback support?NAS100 is falling towards the support level which is a pullback support that lines up with the 23.6% Fibonacci retracement and could bounce from this level to our take profit.
Entry: 20,809.93
Why we like it:
There is a pullback support level that aligns with the 23.6% Fibonacci retracement.
Stop loss: 20,352.24
Why we like it:
There is a pullback support level that is slightly above the 38.2% Fibonacci retracement.
Take profit: 21,779.63
Why we like it:
There is a pullback resistance level.
Enjoying your TradingView experience? Review us!
Please be advised that the information presented on TradingView is provided to Vantage (‘Vantage Global Limited’, ‘we’) by a third-party provider (‘Everest Fortune Group’). Please be reminded that you are solely responsible for the trading decisions on your account. There is a very high degree of risk involved in trading. Any information and/or content is intended entirely for research, educational and informational purposes only and does not constitute investment or consultation advice or investment strategy. The information is not tailored to the investment needs of any specific person and therefore does not involve a consideration of any of the investment objectives, financial situation or needs of any viewer that may receive it. Kindly also note that past performance is not a reliable indicator of future results. Actual results may differ materially from those anticipated in forward-looking or past performance statements. We assume no liability as to the accuracy or completeness of any of the information and/or content provided herein and the Company cannot be held responsible for any omission, mistake nor for any loss or damage including without limitation to any loss of profit which may arise from reliance on any information supplied by Everest Fortune Group.

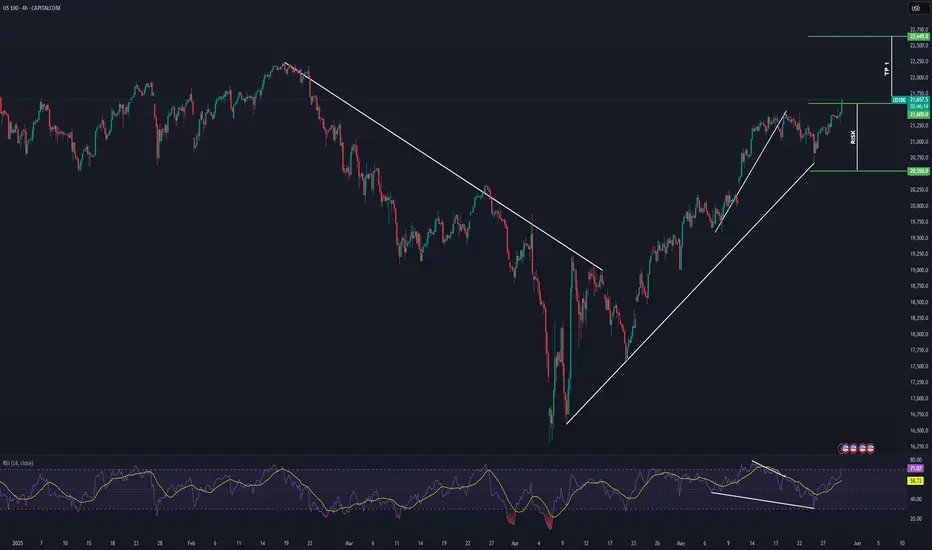
NASDAQ Potential Bullish ContinuationNASDAQ price action seems to exhibit signs of potential Bullish momentum as the price action may form a credible Higher High (after tarriff delays on the EU) with multiple confluences through key Fibonacci and Support levels which presents us with a potential long opportunity.
Trade Plan:
Entry : 21600
Stop Loss : 20550
TP 1: 22649

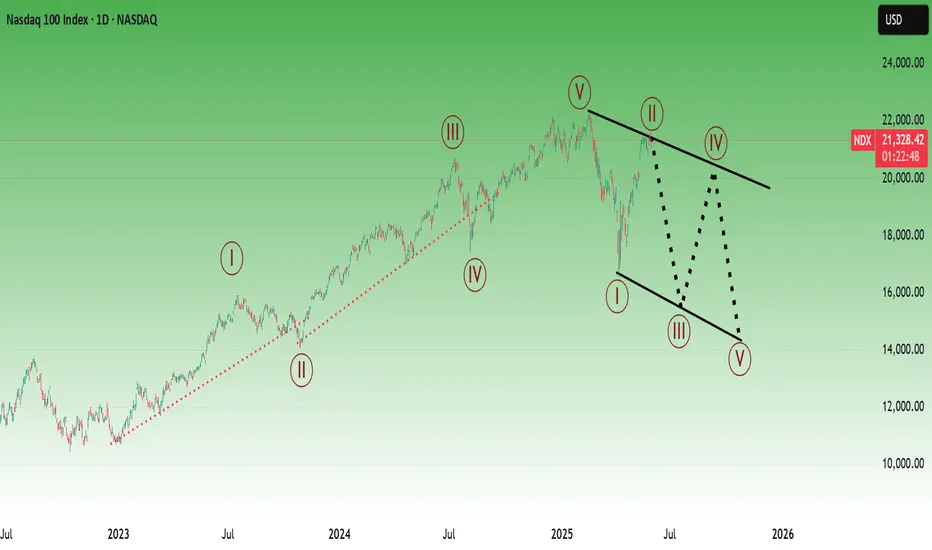
US100 Not yet ready for ATH - Structural BreakdownHere’s a detailed breakdown of the US Tech 100 - NASDAQ on the daily chart and why a lift off to ATHs may not be in play just yet.
✅ Key imbalance zones mapped out
🔻 Expecting downside clean-up before upside continuation
📊 FVGs & inefficiencies stacked below = high-probability revisit zones
If you’re trading NASDAQ, this map could be your cheat sheet before price makes its real move.
The market is respecting the ascending channel, but I’m expecting a cleanup of inefficiencies stacked below before any major continuation. Keep an eye on the key zones marked — price may revisit these areas for liquidity.
📉 Possible short-term correction
📈 Bias still bullish, but not without some pain first
Happy Trading !


H&S Watch! Pullback Toward 18.4K Likely, POC at 15K is Critical!This chart presents a comprehensive technical and macro assessment of the NASDAQ 100 (US100) using the daily timeframe. The focal point is a developing Head & Shoulders (H&S) pattern, currently unconfirmed, but well-formed with strong structural and momentum confluence.
🧠 Thought Process & Structure
The chart reveals a potential H&S pattern with the right shoulder forming just below 22,200. While the neckline at 18,400 has not broken yet, several signals support the idea of a short-term pullback:
Bearish RSI divergence from the recent high
Stochastic crossovers on both daily and weekly timeframes from overbought levels
A large unfilled gap near 18,400 that is likely to act as a magnet
Rather than predicting an immediate collapse, this analysis takes a probability-weighted approach and lays out both bullish and bearish outcomes clearly.
📉 Current Expectation: Pullback Toward 18,400
A move toward 18,400 is the base case. This level represents:
The neckline of the H&S structure
The location of Gap Fill Target 2
A prior demand zone from April 2025
A bounce here would not invalidate the pattern but could delay its confirmation. It’s also a valid level for a short-term long trade setup if buyers defend it strongly.
⚠️ Break Below 18,400: POC Zone Becomes Critical
Should 18,400 break decisively, the market could test the Point of Control (POC) around 15,000. This zone:
Has the highest historical volume concentration
Aligns with the 0.618 Fibonacci retracement
Marks the new measured move target of the Head & Shoulders pattern
In short, 15,000 becomes the most critical structural and psychological support. If it fails, deeper risk reopens.
🔻 Deeper Move Scenarios (Now Less Likely)
Previous versions of this chart targeted 10,500. That level is now considered outside the measured move and only becomes viable if:
15,000 fails to hold
Macro conditions deteriorate sharply (e.g., inflation remains sticky, Fed turns hawkish, or recession triggers a risk-off rotation)
At this time, such an extended move is low probability.
📈 Bullish Invalidation
A breakout above 22,200 with strong volume would invalidate the entire bearish pattern. This would suggest bullish continuation and open the door to 24,000 and beyond. This scenario is also plotted on the chart and clearly labeled.
🧭 Trading Plan
Monitor for rejection or bounce at 18,400
If it holds, long opportunity may develop
If it fails, prepare for POC test at 15,000
Only consider deeper targets if breakdown volume is strong
Invalidate bearish outlook if price closes decisively above 22,200
📅 Macro Events to Watch (June–July 2025)
June 6 – Non-Farm Payrolls (NFP)
June 11 – CPI Report (May)
June 17–18 – FOMC Meeting
June 26 – Final Q1 GDP
June 27 – PCE Inflation
July 3 – June Employment Report
July 15 – June CPI
July 30 – FOMC Meeting #5 & Q2 GDP Advance Estimate
These events could act as triggers for either confirming or invalidating the current technical setup.
✅ Summary
This is a developing setup — not a confirmed breakdown. The current expectation is a pullback toward 18,400, with a potential bounce. If that support fails, the 15,000 POC becomes the key level to watch. The measured move of the H&S pattern now targets 15,000 — not 10,500. Deeper downside should only be considered if strong macro or volume-based catalysts emerge.
This approach allows for flexibility, clarity, and trade planning without bias. Let the chart prove itself — and be ready either way.

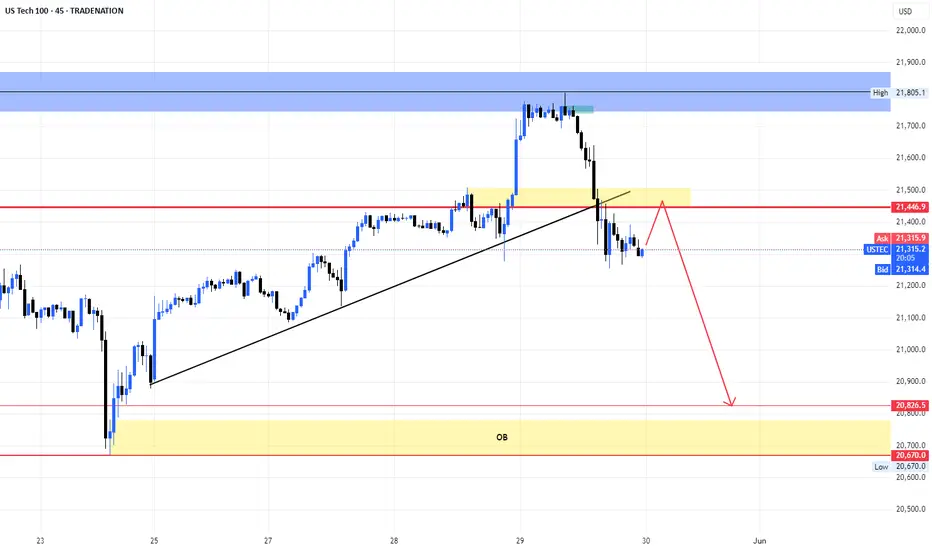
NASDAQ100 Analysis – Key S/R Zones & Price Reaction Incoming! NASDAQ100 Analysis – Key S/R Zones & Price Reaction Incoming! 🚨
🔍 Chart Breakdown:
This is a technical chart analysis of NASDAQ100 (NAS100) with defined Support and Resistance zones. The price is currently at 21,314.50, sitting below a critical decision area.
🧱 Key Zones:
🔵 Resistance Zone:
‣ 21,640 – 21,800
‣ Strong supply area where price sharply reversed previously.
‣ If price breaks above the mid resistance zone, a bullish move towards this level is likely.
🟩 Support + Resistance Flip Zone:
‣ 21,280 – 21,420
‣ Former support, now acting as resistance.
‣ Price is struggling to reclaim this zone.
‣ Acts as a key decision level.
🟢 Support Zone:
‣ 20,630 – 20,750
‣ Strong demand zone from which previous rallies initiated.
‣ Target if bearish rejection continues.
🔄 Price Action Insight:
Price is currently rejecting the Support-turned-Resistance zone.
There’s a clear bearish rejection at the mid-zone (S/R flip), forming a lower high structure.
📉 A breakdown from current levels could lead to a retest of the support zone at 20,700 area.
🟢 However, a successful reclaim and bullish confirmation above 21,420 could see price target the upper resistance at 21,800.
📌 Outlook:
🔽 Bearish Bias if price fails to break above 21,420 – possible drop to 20,700.
🔼 Bullish Reversal above 21,420 could drive price to 21,800.
📅 Date: June 1, 2025
🕒 Timeframe: Likely 1H or 4H chart
💬 “Respect the levels, not the noise.”
Trade safe! ✅

nasdaq : waiting for take the sell stopsThere’s an FVG on the 4H timeframe in Nasdaq,
which indicates strong momentum—likely aiming to hunt some lows.
If the price takes out the specific low I’ve marked,
I’ll watch how the candles react around that area.
If the reaction isn’t strong,
then I’ll start considering a bullish scenario
and look for a potential long setup.

NAS100 4H | Fibonacci Bounce or Break? Key Trendline Test Incomi📈 Description:
Price is currently testing a key ascending trendline on the 4H, sitting just below the 38.2% Fib retracement after rejecting near the 0% level. I’m watching this area closely for either:
✅ A bullish bounce from the 38.2%–50% zone with confluence from EMA 20 and trendline support — targeting 0% then -27% extensions (around 21,750 to 22,200),
or
❌ A clean break and close below the trendline + 61.8% level that could shift short bias toward deeper Fib zones like 78.6% or even 100%.
Indicators Used:
• EMA 20 / EMA 68 for dynamic S/R
• Fibonacci retracement (swing low to recent high)
• Trendline (4H structure support)
🧠 I’ll wait for clear structure before entering — no early entries here. Looking for a strong engulfing candle, MA crossover, or lower-timeframe breakout confirmation depending on the direction.
📍Will update if we get confluence on the 15min/1hr to support entry.


NAS100 at Risk of Breaking Lower Amid Mixed Signals and End-of-MThe NAS100 is showing signs of weakness, with a clear daily pinbar candle signaling potential downside reversal. After a strong rally, the index appears overextended and vulnerable to a technical retracement. End-of-month profit-taking is likely adding pressure, as traders lock in gains and rebalance portfolios.
Uncertainty around reciprocal tariffs is also weighing on sentiment. Comments from U.S. officials, including Bessent, emphasize the need for renewed dialogue with China—highlighting unresolved tensions that could escalate. These trade concerns are surfacing just as the market is priced for optimism, increasing the risk of a pullback.
From a technical perspective, the daily pinbar near recent highs indicates a rejection of upward momentum. If confirmed with a break below the recent low, a move toward 20,400 or even the 50-day moving average could follow.
Seasonal flows and shifting sentiment may further limit upside in the short term. Any risk-off tone from global headlines or softer macro data could accelerate the move lower. Until the index clears resistance with conviction, the bias may now tilt to the downside. Traders should watch for follow-through signals and consider tightening stops.


