BUY/LONG WIFUSDT FOLLOWING D1 PEAKBUY/LONG WIFUSDT FOLLOWING D1 PEAK
By the way, someone asked about spot trading WIF to try averaging down (DCA) since they bought at a relatively high price for WIF’s current level.
If you have a system for identifying bottoms and buy signals for WIF spot trading, then April 14, 2025, was a D1 BUY signal. The entry price was $0.46175, which would have yielded roughly 190% profit. If you bought higher, let’s see if we can fix it.
Now, we wait for the H4 to correct, and it’ll set up for another BUY leg.
Entry Buy: Look to buy in the $0.8–$0.9 range.
Close Buy: Refer to the three take-profit zones as shown on the chart.
Wishing everyone success!
Market insights

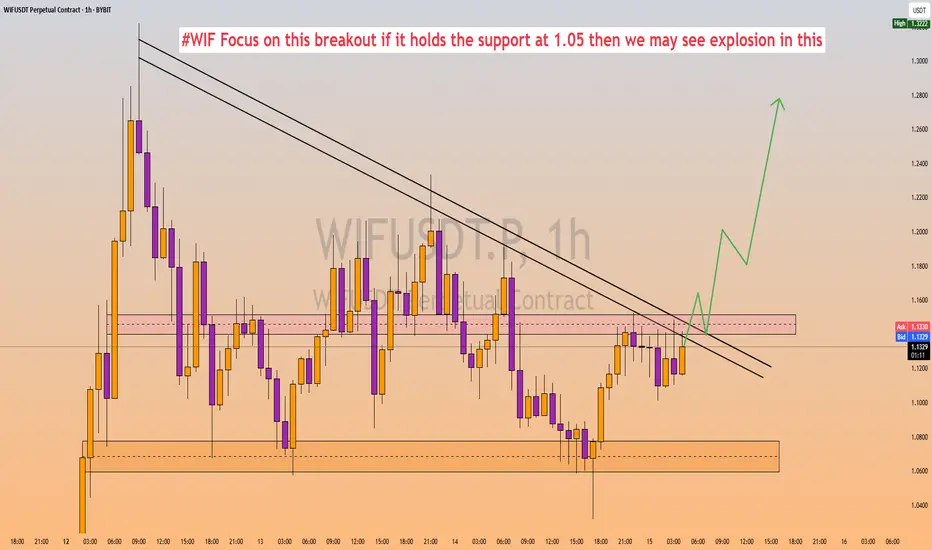
$WIF Breakout Alert – Massive Move Incoming?#WIF is approaching a key breakout zone. If the price holds the $1.05 support, we could see a strong bullish explosion. The breakout of the descending trendline and reclaim of the resistance zone (~$1.15) may push the price toward $1.27+ targets. Keep this on your radar! 📈
🔹 Resistance to watch: $1.15
🔹 Support: $1.05
🔹 Breakout Target: $1.27
📊 Timeframe: 1H (Bybit)
Wif long to $1.39Just recently opened a long position on wif. I attempted a scalp short on it earlier but it failed. Seems market might be gearing up to continue the uptrend. I got multiple confirmation suggesting it will pump soon so just have to see if plays out.
If lost, it'll be a good loss.

Wif scalp short to $1.0718just now opened a short position on wif. anticipating a correction back down to $1.0718 area
More of a scalp position. Roughly 2.3RR
1.1785 stop or higher

Wif pump to $1.48 soonRecently opened a long position on #wif.
Aiming for 1.48 area. Might take partial profit at $1.39 depending on the momentum or full close.
Stop: $1.0825 or lower
6RR

Wif long to $1.48 Recently opened a long position on #wif.
Aiming for 1.48 area. Might take partial profit at $1.39 depending on the momentum or full close.
Stop: $1.0791 or lower
3-4RR

WIFUSDT: The Dog That's Howling at the Moon!🚀 WIFUSDT: The Dog That's Howling at the Moon! 🌕🐕
📊 Key Stats (May 11, 2025)
- Current Price: $0.945 (+11.97% today!)
- Volume: $61.55M (Big moves incoming!)
- Key Levels:
- Support: $0.84 (Today's low)
- Resistance: $0.999 (Break = Moon Mission)
- Take Profit: $1.100 (Next target)
🔥 Technical Breakdown
1. Massive Bounce: Up 11.97% today from $0.844
2. Volume Spike: $61M volume shows strong interest
3. Breakout Potential: Testing key resistance at $0.99
💎 Why This Trade Works
1. Meme Coin Season: Dog-themed coins heating up
2. Liquidity Pool: Deep volume at $0.80-$0.90 zone
3. Technical Setup: Bull flag forming on 4H chart
🎯 Trading Plan
- Aggressive Entry: $0.88
- Ideal Entry: $0.85 pullback
- Targets:
→ $1.100 (18% gain)
→ $1.250 (32% gain)
- Stop Loss: Below $0.80 (Key support)
⚠️ Risk Warning
Meme coins are volatile! Only risk what you can afford to lose.
📈 The Big Picture
WIF is showing strength while other meme coins consolidate. A break above $1 could trigger massive FOMO!
👍 Like/Follow for more hot crypto setups!
#WIF #Memecoin #AltSeason2025
Not financial advice - always DYOR.

#WIF/USDT#WIF
The price is moving in a descending channel on the 1-hour frame and is adhering to it well and is heading to break it strongly upwards and retest it
We have a bounce from the lower limit of the descending channel, this support is at a price of 0.650
We have a downtrend on the RSI indicator that is about to break and retest, which supports the rise
We have a trend to stabilize above the moving average 100
Entry price 0.671
First target 0.716
Second target 0.751
Third target 0.800

Waiting for a Perfect Entry! 🚀 SEED_WANDERIN_JIMZIP900:WIF in Uptrend – Waiting for a Perfect Entry! 📈
SEED_WANDERIN_JIMZIP900:WIF is currently in an uptrend! If you missed the entry, you can wait for a correction. Once the price comes back to the green zone, keep an eye out for confirmation to enter long! 🔥
Let’s catch the next opportunity together! 💼💸

$WIF Bullish Reversal PlayChart Highlights:
• Strong accumulation zone: WIF consolidated in a range (marked in purple box) between ~$0.45 and ~$0.78, showing multiple rejections at the lower boundary — signaling strong buying pressure.
• Breakout from downtrend: The white trendline indicates a break from the major downtrend, suggesting a trend reversal.
• Bollinger Bands Squeeze & Expansion: The price has broken above the mid-band with volume, implying momentum is building up.
• Targets based on key resistance levels:
• TP1: $1.31
• TP2: $1.49
• TP3: $1.99
• TP4: $3.00
• TP5 (near ATH retest): $3.65
Entry Zone: $0.78–$0.83
Stop-Loss: Below $0.62 (just under accumulation zone)
Risk-Reward: Solid R:R potential if it breaks $1.00 with volume

WIFUSDT.P 1H Chart Pattern WIFUSDT.P 1H Time Frame Make A Chart Pattren. We are Waiting For The Bullish Tag To Form on Our CGI Indicator

WIF longWIF is bouncing off the bullish trendline and the support level. The bullish movement to the resistance level at $0.69 is expected to happen

WIF/USDT — Ready to Wake Up?🚀 WIF (Dogwifhat) might be gearing up for a major breakout.
After months of decline, the weekly chart is showing a potential reversal setup directly from the most significant accumulation zone.
🔍 Technical Overview
• Descending Channel (since early 2024):
Price has been respecting a long-term falling wedge/channel.
The recent bounce off the lower boundary could mark the beginning of a trend shift.
• Massive Support at $0.58–$0.60:
This zone aligns with the highest volume node on the VPVR — clear accumulation.
Price is consolidating tightly here, hinting at reduced selling pressure and possible re-accumulation.
• Rounded Bottom in Progress:
The structure is curving gradually upward — a classic "rounded bottom" formation.
Increasing volume confirms growing interest.
📈 Targets
• Primary Target: $2.00–$2.50 — major volume cluster and resistance zone
• Breakout Target: $3.50–$4.20 — upper boundary of the descending channel
• If broken — could lead to price discovery during meme season
⚠️ Risks
• Fakeout and return to the $0.60 range if momentum fades
• Bitcoin dominance rising above 54% could delay altcoin flows
• Lack of meme hype may lead to sideways or stagnant movement
📌 Catalysts to Watch
• Drop in BTC dominance (BTC.D) could trigger rotation into altcoins
• If BOME, PEPE, or FLOKI start pumping — WIF is likely to follow
• Exchange listings, partnerships, or viral buzz can ignite momentum
✅ Trade Setup Summary
• Entry Zone: $0.60–$0.70
• Stop-loss: below $0.58
• Targets: $2.00 → $3.50–$4.20
• Risk/Reward: Highly favorable with strong support beneath
Conclusion:
If meme season returns, WIF could go vertical. The accumulation zone looks mature — now it’s just a matter of ignition timing. Watch for social sentiment and BTC.D rotation triggers.

Wif Short Daily bullish but is correcting
4hr and 1hr already flipped bearish.
Market not at strong support where enough demand is likely to come back in to make new Daily HL
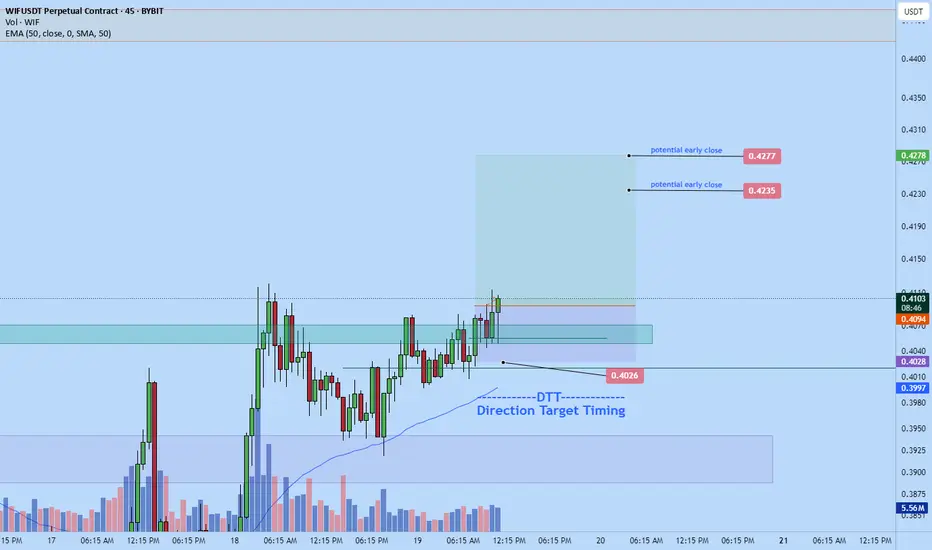
-DTT
See targets and stop on chart

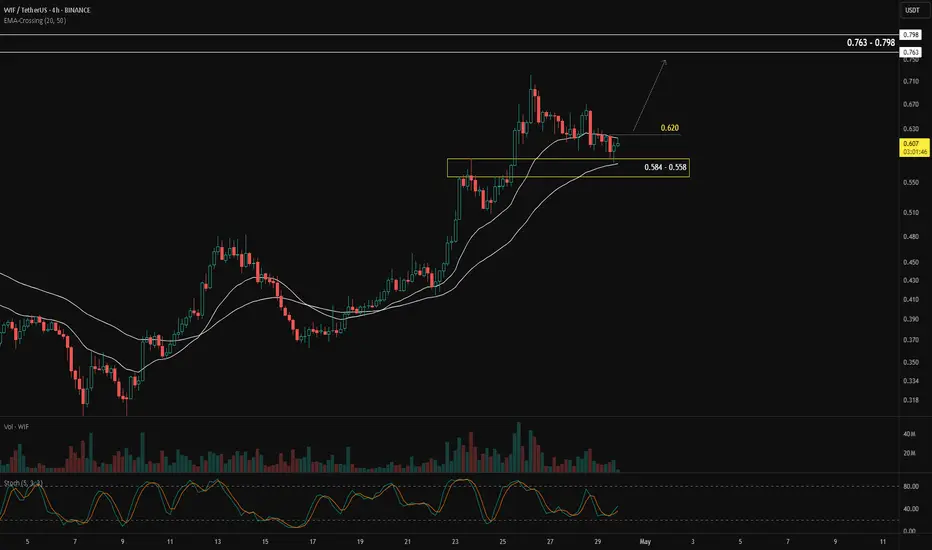
When Moving Averages Meet the Demand ZoneOne of the simplest ways to identify the market trend is by using the moving average (MA) indicator.
When price moves above the MA, it's generally considered an uptrend.
When price moves below the MA, it's seen as a downtrend.
Aside from showing the trend, moving averages can also act as dynamic support and resistance:
In an uptrend, the MA acts as support — meaning if price retraces into the MA, it often bounces back and continues upward.
In a downtrend, the MA acts as resistance — price tends to reject the MA and move lower.
In BINANCE:WIFUSDT , the moving average is currently acting as support, and price is pulling back into a confluence zone between 0.584 – 0.558, where the MA meets a demand zone. This setup increases the probability of the pullback ending and the uptrend continuing.
The confirmation for a bullish continuation would be a break and close above 0.620.
If that happens, the next target zone is between 0.763 – 0.789.
Keep a close eye when price approaches the previous high. The ideal scenario is a strong impulsive breakout. The worst-case scenario would be a rejection or false breakout from that level.
Alright, what's your take on BINANCE:WIFUSDT ?
BEARISH ON WIFUSDTThe bearish confluences are back by the following confluences:
1) Market Structure(BoS), 2) Liquidity, 3) QM-Orderblock(POI).
To target a minimum of 1:2.5RR.
Note: the market is all about probabilities which also makes my analysis a probability.

wif short to $0.57Just now opened a short position on wif. Expecting market to correct down to that area before pushing up to higher prices possibly
Daily correction
See chart

WIFUSDTWIFUSDT
Crypto again show strength that's why I'm bullish in WIFUSDT. It hold good strength to show us upward move. In Crypto, never trade in hurry and always add Qty in layers.
Think about it then make your trade according to your RISK.


WIF Weekly Outlook – Explosive Setup Unfolding!
#WIF has broken out of a falling wedge formation on the weekly timeframe, indicating the start of a major trend reversal. With strong price action and volume picking up, we're eyeing the following bullish targets:
🎯 T1: $1.124
🎯 T2: $2.676
🎯 T3: $4.135

$WIF Breakout Confirmed 🚨 SEED_WANDERIN_JIMZIP900:WIF Breakout Confirmed?
Dogwifhat has officially broken out of the descending channel and is trading above key resistance with strong momentum.
If bulls hold this zone, we could be eyeing major upside moves.
Key targets:-
• $0.774
• $1.474
• $3.006
• $4.659
SL: $0.305 | Entry: CMP
Is this the start of SEED_WANDERIN_JIMZIP900:WIF ’s next moon mission? 🌕
DRYO, NFA

WIF Bulls Charge After Breakout – Can It Hit $2?SEED_WANDERIN_JIMZIP900:WIF has broken above the descending trendline, a key structure that had been capping price for several weeks. This breakout, paired with today’s nearly +10% surge, suggests bullish momentum is building.
The price is now approaching the 50 EMA, which may act as short-term resistance. A clean breakout and close above this level could trigger a strong upside move toward higher zones, as marked on the chart.
Targets remain open toward $0.80, $1.30, and possibly $1.97 if momentum holds.
DYOR, NFA

Wif long to $0.4235 and higherJust now opened long position on wif. Looks likely to break higher today and might go way higher than the target I have on my charts but I might exit there for at lest 2 RR.
Valid DTT setup