WLD (Buy Idea)Worldcoin (WLD)
A setup for the long term.
Buy between:
$2.2 - $2.7
The stoploss is breaking the low 18th of July.
WLDUSDT trade ideas

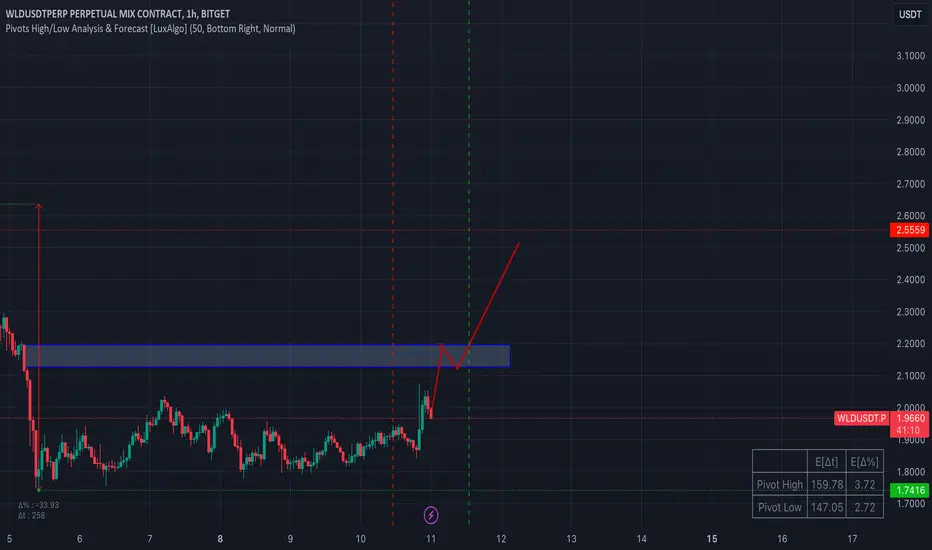
WLDUSDT.P Long - Potential Uptrend ContinuatioRisk Management:
Always practice proper risk management.
Only riska small percentage of your capital per
trade.
Hashtags:
#crypto #cryptotrading #wldusdt
#longbuying
Disclaimer:
This is not financial advice.
Please consult with a qualified financial advisor
before making any investment decisions

Phemex Analysis #7: WLD Explodes! But Stay Rational PHEMEX:WLDUSDT.P has experienced a sharp price appreciation following the company's announcement of an extended token unlock schedule for early investors and team members. While such news typically catalyzes upward price movements, it's essential to approach these pump-driven rallies with a critical eye.
Historically, price increases primarily driven by short-term enthusiasm and speculation have often exhibited limited sustainability. Unlike rallies grounded in substantial project advancements or fundamental improvements, pump-driven movements are more susceptible to rapid corrections.
Given this context, a prudent trading strategy might involve securing profits near key resistance levels at $3.50 and $4.10. These levels represent significant psychological barriers and potential points of profit-taking for short-term traders.
However, a contrary perspective could emerge if the asset encounters strong selling pressure at these resistance points. In such a scenario, a potential buying opportunity may arise closer to the support levels of $2.10 and $1.80. These levels could act as areas of demand and potential price reversal.
It's crucial to emphasize that this analysis is based on current market conditions and historical trends. The cryptocurrency market is highly volatile, and unforeseen events can significantly impact price movements. As such, diligent risk management and a comprehensive trading plan are paramount.
Note: We are excited to announce that our new PULSE 3.0 version has been released! Check it out!
Disclaimer: This is NOT financial or investment advice. Please conduct your own research (DYOR). Phemex is not responsible, directly or indirectly, for any damage or loss incurred or claimed to be caused by or in association with the use of or reliance on any content, goods, or services mentioned in this article.

WLDUSDT Will This Breakout Hold or Collapse? Yello, Paradisers! Are you ready to see if #WLDUSDT's recent breakout will lead to a bullish rally or a sharp decline?
💎#WLD has successfully broken out of its descending resistance with a strong green candle, signaling potential bullish momentum.
💎However, the price hasn't retested yet, and there's a high probability it might pull back to the demand zone at $2.41 before continuing its upward move towards the key supply level at $3.693. A break above this level is crucial for further upward movement toward our target area.
💎But what if WLD fails to break through and faces a hard rejection? In that case, we might see the price fall back into a support-resistance range, leading to sideways movement. Worse still, if WLD breaks below the support line, it could be a bad sign, causing the price to revisit the strong support at $2.066.
💎The bounce at this strong demand area is crucial. If WLD fails to bounce and breaks this support, the bullish scenario will be invalidated, and the price will likely dip further.
If you want to be consistently profitable, you need to be extremely patient and always wait only for the best, highest-probability trading opportunities.
MyCryptoParadise
iFeel the success🌴

#WLD/USDT#WLD
Our price is moving downwards on a 4-hour frame and is about to break through to the upside in 3 stages
We have a bounce from the lower border of the channel from the green support area at 1.67
We have a tendency to stabilize above the Moving Average 100
We have an uptrend on the RSI indicator that is heading up
Entry price 1.73
First goal 2.10
Second goal 2.44
The third goal is 2.85

WLD ( WORLD COIN) CAN ENTER NEW ALL TIME HIGH $8 SOON!Thanks for reading this update.
We expect that there is high chance that WLD will enter $8, since the confirmation between $2,94 - $3
WILD is a new coin that can show unexpected targets.
We will follow this coin for new ATH

WLDUSDT(Worldcoin) Daily tf Range Updated till 17-07-24WLDUSDT(Worldcoin) Daily timeframe range. another cool retrace back here. very close to 3.031 a little bit push can get to it. above that is not really heavy space depend on stuck sellers bags. local support is at 2.290.

WLD looking greatWith Buy and Fbuy prints and substantial volume, we expect the targets of 2.44 and above
DYOR

WLD - Oi increased by 50% - big move is comingWLD - Oi increased by 50% - big move is coming
Pricie dropped so well at this moment it is locally above VAH
good signal for potential rise
Price MUST be above VAH and squeeze up to confirm UP trend
ALso i shared a plan what to do if LONG plan fails

WLDUSDT.PWLDUSDT.P IS in bullish trend.
Bullish divergence also form previously
Printing HH and HL.
we buy at CMP.

WLD - PUMP is going to start!WLD - PUMP is going to start!
Goals
1st - $3.2
2nd - $4.5
3rd - $6.55
Follow the tide until big liquidation can happen

Wld / Usdt MIL:WLD
✨Entry : CMP
🎯Targets : 1.960 - 2.060 - 2.140..++
🎯 2.5$ Also Possible In Midterm
❌SL : 9%Use your own way

Unveiling a New WLD: Charting the Crypto FrontierIn the vibrant and ever-changing cryptocurrency sector, the WLD coin has emerged as a noteworthy entity, particularly due to its meteoric rise from a trading stance of $0.9850 to an impressive peak at $11.
This analysis delves into the intricacies of WLD's market behavior, with a keen focus on a specific 3-hour trading window. It methodically dissects the coin's historical pricing patterns, leverages a spectrum of technical analysis tools, and contemplates the broader market forces that have been instrumental in sculpting WLD's path.
Background Overview:
WLD coin's journey began with its release on July 24, 2024, marked by the innovative introduction of 11 ORB locations across the United States, with an ambitious roadmap extending to 35 more ORBs globally. The coin's debut saw an initial 8.5% price increase, subsequently experiencing a 35% decline from its peak, setting the stage for a complex market trajectory
Analytical Perspective:
This analysis adopts a personal viewpoint, acknowledging the subjective nature of technical analysis and inviting diverse perspectives to enrich the discussion. Despite a bullish outlook on WLD, a potential overvaluation and expected price correction are considered, with analysis extending beyond the 3-hour timeframe to encompass broader market trends.
Technical Analysis:
The technical journey of WLD began post its initial rally and subsequent decline, finding support at the $1.8599 level, which held for approximately 16 days.
A breach of this support level led to a further decline, establishing $0.9850 as a significant support area, indicative of strong buying levels.
A minor Area of Interest (AOI) was identified at $1.2335, with frequent interactions over a month, highlighting its importance in WLD's price dynamics.
The downtrend witnessed on a shorter 1-hour timeframe and the oscillator's indication of a potential reversal at this stage underscored the nuanced interplay of market forces on the 3H timeframe.
The emergence of a new uptrend was marked by a significant pattern on the oscillator, with WLD establishing new AOIs at $2.7365 and $4.3, leading to a remarkable 333% price rally.
However, this rally faced resistance, initiating a corrective phase that saw a 50% price reduction over 36 days, highlighting the cyclical nature of market trends.
A pivotal moment in WLD's trading history was observed around the grey dotted Area of Interest (AOI) line at $2.1850. On February 9, 2024, as the market opened (8:00 AM AUS GMT+8), buyers initiated a strong entry, effectively challenging and breaking through the prevailing downtrend. This bullish momentum was clearly confirmed on the 3-hourly chart, marking a significant turning point in WLD's market dynamics
In the subsequent 30-day trading period, an extraordinary price surge ensued, with WLD's value escalating by over 384%. This period was characterized by the establishment of new AOIs at critical levels: $5.1205, marking the investor's take-profit point, followed by successive peaks at $7.2215, $9.4795, $9.500, and ultimately reaching an all-time high at $11.8954.
This phase not only underscored the robust bullish sentiment in the market but also highlighted the strategic significance of these newly established AOIs in WLD's trading landscape.
Current Market Dynamics:
Diving deeper into the intricate landscape of WLD's price action, we now pivot our focus towards the horizon, contemplating the path that lies ahead based on the meticulous analysis of the 3-hour chart.
Navigating Future Waters: A Detailed Forecast
The symphony of price levels previously highlighted has not only shaped the historical narrative of WLD but now converges to orchestrate a symmetrical triangle pattern on the 3-hour timeframe. This geometric alignment, as observed below,
suggests a delicate balance between bullish hopes and bearish realities, typically indicative of a bullish continuation pattern.
However, the plot thickens as the oscillator reveals signs of capital withdrawal alongside a bearish cross, marked distinctly by a highlighted white dot
This is hinting at potential volatility with a predisposition to break downward before possibly catapulting upwards with renewed vigor, especially around the $6.81 - $6.3455 AOI zones or upon retesting the $8.5 AOI.
Anticipating strategic entry points, the levels at $7.2215 and $6.8101 emerge as beacons for potential investment opportunities, potentially setting the stage for WLD to eclipse its previous zeniths if these levels hold firm.
Leveraging ERAI's Insights:
Employing ERAI, an AI-driven beacon in the tumultuous seas of cryptocurrency trading, we delve into a simulation rich with historical candle data. This predictive odyssey suggests pivotal levels at $15.72, with notable clusters around $11.985, $8.57, $7.78, and $6.81, painting a cautious tapestry of potential downturns, with the minor level at $5.1205 offering a glimmer of optimism to hold price up.
ERAI's bearish posture, amplified by a SELL signal at a power rating of 2.4 on the 3-hour timeframe, further accentuates the narrative of caution.
The Duel of Indicators:
Amidst this analytical maelstrom, the 200 daily EMA and the HODL line stand as sentinels on the chart, their red and white hues demarcating the battleground of buyers and sellers. This dynamic duo suggests a close-knit struggle for dominance, offering a strategic axiom: the positioning of the HODL line relative to the 200 DEMA could signal the opportune moments to buy or sell.
Oscillatory Perspectives:
Lastly, the oscillator, with its HYPER WAVE and MONEY FLOW, warns of negative cash influxes and descending price actions, suggesting a march towards the oversold domain, with eyes keenly set on the $7.2215 and $6.81 levels for potential rebounds.
In Summary:
This foray into WLD's technical realm, grounded in empirical evidence and enriched by predictive analytics, paints a tapestry of cautious optimism, underscored by strategic vigilance.
Will be closely monitoring WLD for the next coming weeks.
~Axie

BE READY FOR THE BEST CYCLE COIN 2024 WLD/USDT This is an update on 2024 (cycle trend)
Depending on our study WLDUSDT has a high chance to go new ATH And target between $8 - $15
The cycle started today on this coin and with this 2024 update, we will save showing high interest for a new cycle.
Check update ideas
We expect that WLD will become the best top coin cycle coin of the known top coins 2024
interesting updates coming by the coin and data shows a new cycle start.

WLD ( WORLD COIN) CAN ENTER NEW ALL TIME HIGH $8 SOON!Thanks for reading this update.
We expect that there is a high chance that WLD will enter $8, since the confirmation
WILD is a great coin that can show unexpected targets.
We will follow this coin for new ATH
WLD can enter for the second time the $8
we did it before with WLD, see before update and this time it shows exactly same signals as before when it did target to $9 - we expect new round coming.

WLDUST OUTLOOKHi in this analysis i'm bullish in WLDUSDT, price will be inclined to this supply area but because the supply area is not brining enough buyer, this supply area will be break through by the buyer, good long opportunity here
Alikze »» WLD | Continue the downward trend🔍 Technical analysis: Continue the downward trend
- The daily frame time is moving in a descending channel.
- Currently, in the PRZ area, which had a 100 -wave fiber in the previous fiber area.
- If this area is preserved, it can first grow up to the middle of the cannon and then to increase demand to the channel ceiling.
-If the area is exposed to sales pressure, it can extend the corrective structure to fibou 1.618 the previous wave.
💎 Alternative scenario: If it is able to break the line and consolidate it on top of it, the descending channel fails to continue its growth area.
»»»«««»»»«««»»»«««
Please support this idea with a LIKE and COMMENT if you find it useful and Click "Follow" on our profile if you'd like these trade ideas delivered straight to your email in the future.
Thanks for your continued support.
Best Regards,❤️
Alikze.
»»»«««»»»«««»»»«««
BINANCE:WLDUSDT
www.radingView.com


WLD bearish ideaWLD and its tokenomics is very bad from my point of view, so I expect bigger drop .
Let's see, NFA.

WLDCurrency #WLD on 1D timeframe
Reached the bottom of the channel and expected to start its upward journey targeting $3.

Worldcoin Price on the Verge: Key Points and Strategies!In the latest 4-hour analysis, BINANCE:WLDUSDT has moved slightly up from $1.836 to $1.899. This gradual increase indicates a short-term recovery attempt within a generally bearish context.
Examining the exponential moving averages (EMA), the 9 EMA currently stands below the 20 EMA. This suggests that the short-term momentum is weaker than the long-term trend. Specifically, the 9 EMA at $1.879 is lower than the 20 EMA at $1.913, reinforcing a bearish sentiment. The alignment often signals potential further declines unless a crossover occurs where the 9 EMA surpasses the 20 EMA, indicating a shift to bullish momentum.
Meanwhile, the Moving Average Convergence Divergence (MACD) also paints a cautious picture. While the MACD histogram has been positive, indicating some bullish divergence, the MACD line remains below the signal line. This suggests that the bullish attempts are weak and might not sustain without stronger buying pressure. The recent narrowing of the MACD and signal lines could also hint at a potential reversal. However, confirmation is required before taking action.
The Relative Strength Index (RSI) has fluctuated between 38.63 and 46.04 over the observed period, currently resting at 45.67. Although RSI is not in the oversold territory, it indicates that the market is nearing a neutral zone from previously being oversold. This implied potential stabilization or a slight bullish correction.
Considering the support and resistance levels, the Worldcoin price faces significant resistance at $2.007, $2.483, and $2.745. These levels are crucial for bulls to break through to signal a strong uptrend. Conversely, immediate support levels are observed at $1.835, $1.821, and $1.812. A breach below these supports could lead to further downside movement.
For those looking to enter long positions, it would be prudent to wait for a clear breakout above the $2.007 resistance level with strong volume. This could signal the beginning of a more sustained upward trend. Entry could be considered around $2.010 with a target towards the next resistance at $2.483. A stop loss slightly below the breakout level at $1.990 can then be set.
For short positions, traders should watch for any signs of rejection at the resistance levels, particularly around $2.007. A failure to break above this could offer a shorting opportunity. Entry could be considered around $1.995 with targets near the immediate support levels at $1.835, and a stop loss just above $2.007.

WLDUSDT - Ready for a bullish rebound?After a challenging few months, WLD has dropped significantly in price and now appears to be undervalued. Let's break down the current market conditions and explore a potential long trade setup with a strong risk-to-reward (R:R)
Current POC: The price should hold at the current Point of Control (POC) to build up bullish strength.
Primary Entry: Enter a long trade at the current price level, focusing on the support at the POC.
Stop-Loss Placement: Set the SL just below the POC to ensure a favorable R:R
ratio.
Target Profit: Aim for a TP at the old trading range, capturing the potential recovery in price.

WLDUSDT | Bear Flag!WLDUSDT is forming bear flag pattern which indicates further downward momentum. Break out and retest is already observed in the coin and further downward is continue currently. The pattern completes at $1 which is the support level of the price. This is just my observation, do your analysis before take long or short position.
