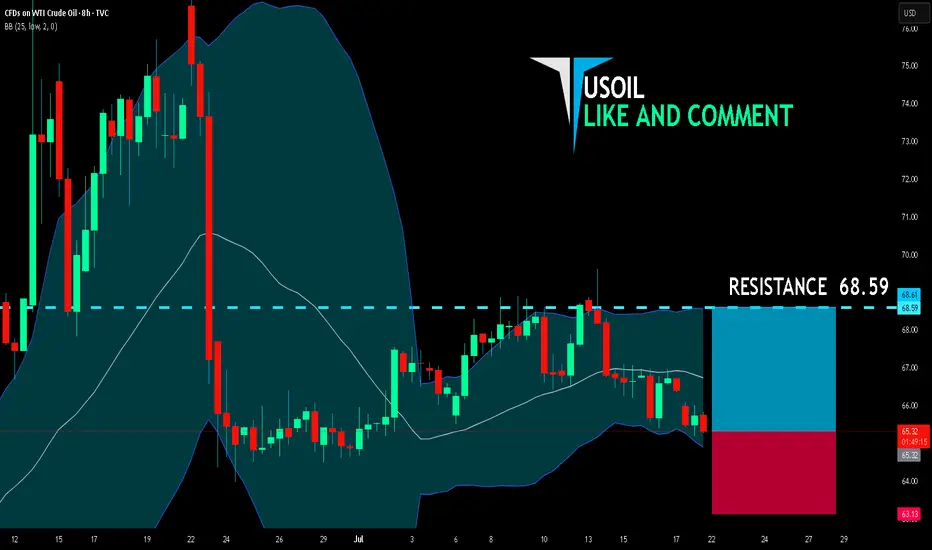
USOIL BULLS ARE STRONG HERE|LONG
USOIL SIGNAL
Trade Direction: long
Entry Level: 65.32
Target Level: 68.59
Stop Loss: 63.13
RISK PROFILE
Risk level: medium
Suggested risk: 1%
Timeframe: 8h
Disclosure: I am part of Trade Nation's Influencer program and receive a monthly fee for using their TradingView charts in my analysis.
✅LIKE AND COMMENT MY IDEAS✅
WTICOUSD trade ideas
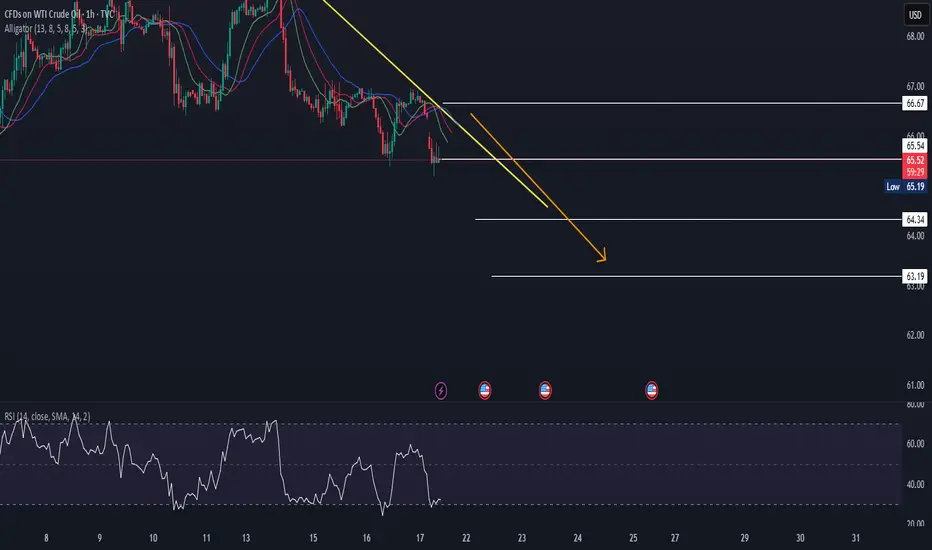
USOILUSOIL is in strongly bearish trend.
Potentially printing LH and LL.
No strong sign of reversal shown.
Alligator mouth is open which indicates trend will continue.
we sell at CMP.
Oil Bulls Watch $67.0 for Breakout ConfirmationFenzoFx—Crude Oil trades slightly above the bullish FVG at $66.5, showing sideways momentum on the 1-hour chart. The $65.5 support is backed by volume interest and could drive prices higher.
If this level holds, bulls may target a retest of the descending trendline. For confirmation, a close above the $67.0 resistance is needed.
Please note that a close below $66.5 would invalidate the bullish outlook.

WILL CRUDE HOLD BEARISH TREND DURING FED CHAIR POWELL SPEECH?!!?CRUDE OIL
Looking for a BEARISH continuation, of last week's Friday Fall.
Take Profit near 2.00 Extension level (64.715)
Stop Loss above the previous Hourly high candlestick (66.103)

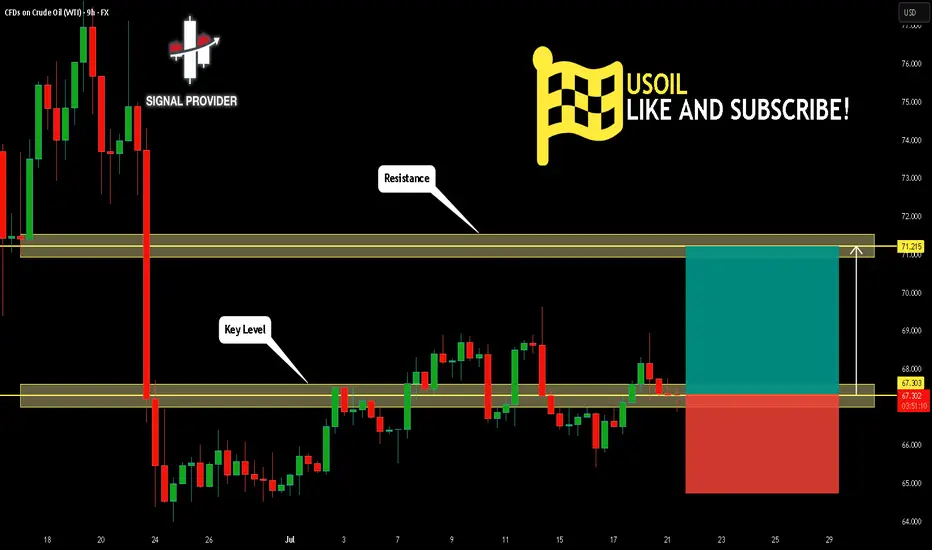
USOIL Will Go Higher! Buy!
Take a look at our analysis for USOIL.
Time Frame: 9h
Current Trend: Bullish
Sentiment: Oversold (based on 7-period RSI)
Forecast: Bullish
The market is approaching a key horizontal level 67.303.
Considering the today's price action, probabilities will be high to see a movement to 71.215.
P.S
We determine oversold/overbought condition with RSI indicator.
When it drops below 30 - the market is considered to be oversold.
When it bounces above 70 - the market is considered to be overbought.
Disclosure: I am part of Trade Nation's Influencer program and receive a monthly fee for using their TradingView charts in my analysis.
Like and subscribe and comment my ideas if you enjoy them!
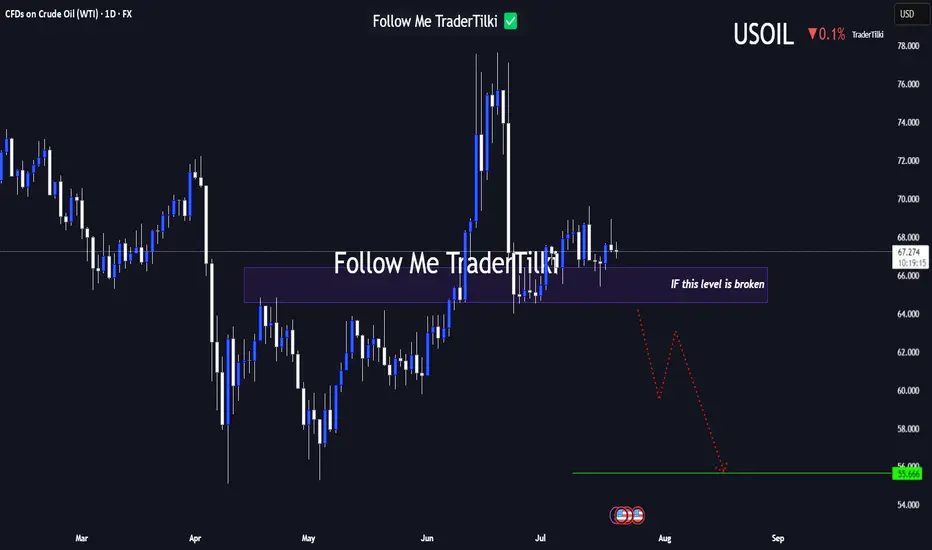
USOIL Under Technical Pressure: 1D Timeframe Breakdown Hey Guys,
The 66.584 level currently stands as the strongest support zone for USOIL. If this level breaks with a candle close, the next major target could drop to 55.666.
This setup is based on the 1-day timeframe. I highly recommend keeping a close watch on that key level.
Every like from you is my biggest motivation to keep sharing these insights. Thanks so much to everyone who’s showing support!
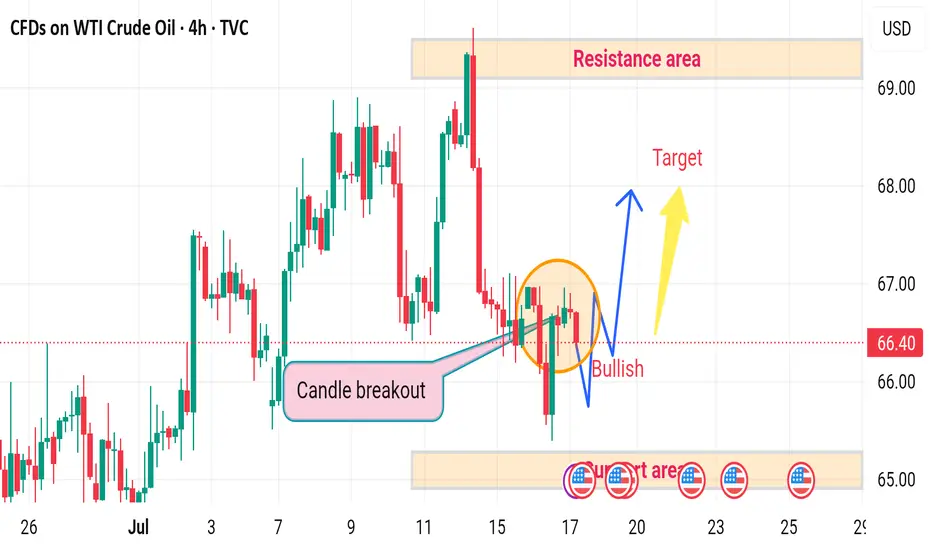
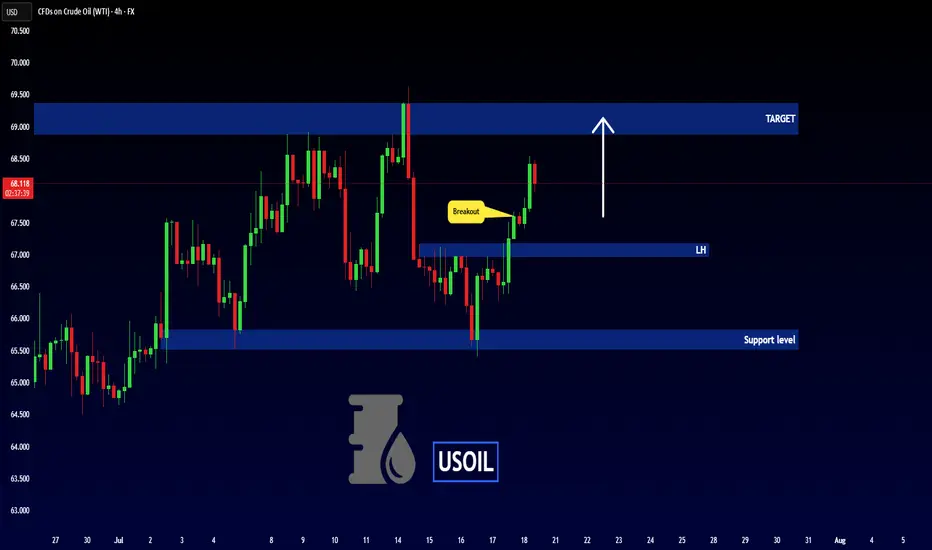
USOIL H4 bullish upward ⚠️ Disrupted Analysis – WTI Crude Oil (4H Chart)
🔻 Bearish Pressure Re-Entering
Despite a temporary candle breakout, the price failed to sustain above the breakout trendline.
The recent price action inside the orange circle shows lower highs and rejection wicks, indicating bullish weakness.
📉 Potential Breakdown Risk
If the price fails to hold above 66.00, there's a high probability of it breaking below the support area around 64.80–65.00, leading to:
Increased bearish momentum
Retesting lower demand zones, possibly around 63.50–64.00
❌ Resistance Area Still Valid
The Resistance area at 68.00–69.00 remains unchallenged.
The "Target" shown is optimistic under current momentum.
Without strong volume and bullish candles, that target remains unlikely in the near term.
🔁 Disruption Summary
The bullish breakout is likely a false breakout.
Market may be forming a bull trap.
Watch for a clean break below 65.00 for confirmation of a bearish reversal.
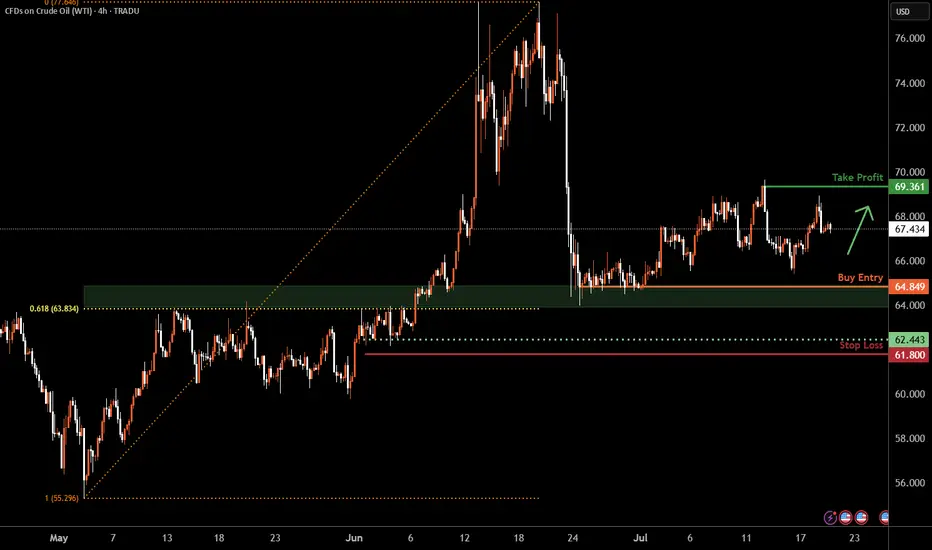
WTI Oil H4 | Falling toward a multi-swing-low supportWTI oil (USOIL) is falling towards a multi-swing-low support and could potentially bounce off this level to climb higher.
Buy entry is at 64.84 which is a multi-swing-low support that aligns closely with the 61.8% Fibonacci retracement.
Stop loss is at 61.80 which is a level that lies underneath a multi-swing-low support.
Take profit is at 69.36 which is a swing-high resistance.
High Risk Investment Warning
Trading Forex/CFDs on margin carries a high level of risk and may not be suitable for all investors. Leverage can work against you.
Stratos Markets Limited (tradu.com ):
CFDs are complex instruments and come with a high risk of losing money rapidly due to leverage. 66% of retail investor accounts lose money when trading CFDs with this provider. You should consider whether you understand how CFDs work and whether you can afford to take the high risk of losing your money.
Stratos Europe Ltd (tradu.com ):
CFDs are complex instruments and come with a high risk of losing money rapidly due to leverage. 66% of retail investor accounts lose money when trading CFDs with this provider. You should consider whether you understand how CFDs work and whether you can afford to take the high risk of losing your money.
Stratos Global LLC (tradu.com ):
Losses can exceed deposits.
Please be advised that the information presented on TradingView is provided to Tradu (‘Company’, ‘we’) by a third-party provider (‘TFA Global Pte Ltd’). Please be reminded that you are solely responsible for the trading decisions on your account. There is a very high degree of risk involved in trading. Any information and/or content is intended entirely for research, educational and informational purposes only and does not constitute investment or consultation advice or investment strategy. The information is not tailored to the investment needs of any specific person and therefore does not involve a consideration of any of the investment objectives, financial situation or needs of any viewer that may receive it. Kindly also note that past performance is not a reliable indicator of future results. Actual results may differ materially from those anticipated in forward-looking or past performance statements. We assume no liability as to the accuracy or completeness of any of the information and/or content provided herein and the Company cannot be held responsible for any omission, mistake nor for any loss or damage including without limitation to any loss of profit which may arise from reliance on any information supplied by TFA Global Pte Ltd.
The speaker(s) is neither an employee, agent nor representative of Tradu and is therefore acting independently. The opinions given are their own, constitute general market commentary, and do not constitute the opinion or advice of Tradu or any form of personal or investment advice. Tradu neither endorses nor guarantees offerings of third-party speakers, nor is Tradu responsible for the content, veracity or opinions of third-party speakers, presenters or participants.
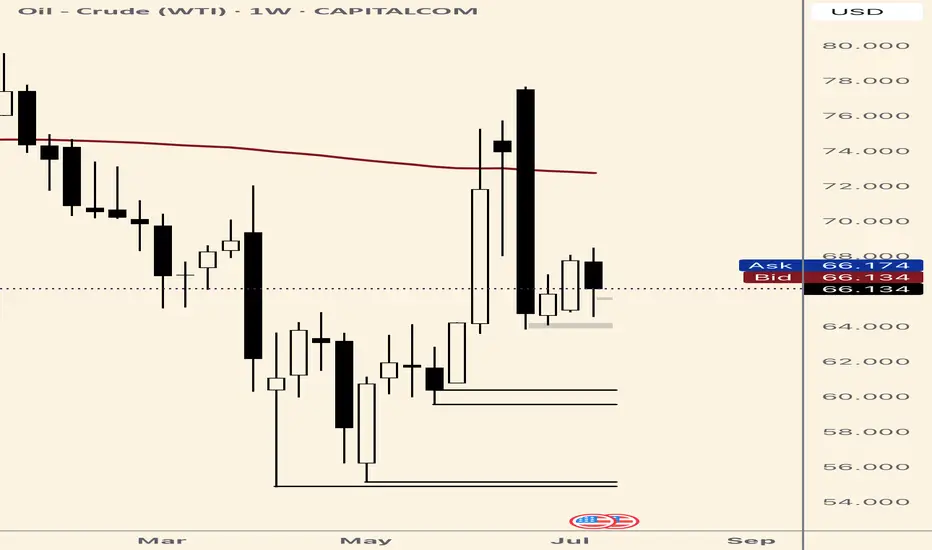
Crude Oil -DAILY- 21.07.2025Oil prices were steady after their first weekly decline this month, as attention shifted to U.S. trade negotiations and the European Union’s push to tighten restrictions on Russian energy exports. The EU is preparing new sanctions, including a lower price cap on Russian crude, limits on fuel refined from Russian oil, banking restrictions, and bans targeting an Indian refinery and Chinese firms. Despite western sanctions, Russian oil continues flowing to China and India. Meanwhile, diesel margins in Europe remain strong, signaling tight supply.
On the technical side, the price of crude oil has failed to break below the major technical support area, which consists of the 50-day simple moving average and the 50% of the weekly Fibonacci retracement level. The Stochastic oscillator has been in the neutral level since last week hinting that there is potential for the price to move to either direction in the near short term. On the other hand, the Bollinger bands have contracted rather massively showing that volatility has dried up therefore, the recent sideways movement might extend in the upcoming sessions.
Disclaimer: The opinions in this article are personal to the writer and do not reflect those of Exness

Bullish bounce?WTI Oil (XTI/USD) has bounced off the pivot and could rise to the 1st resistance that is slightly below the 50% Fibonacci retracement.
Pivot: 65.64
1st Support: 60.22
1st Resistance: 71.20
Risk Warning:
Trading Forex and CFDs carries a high level of risk to your capital and you should only trade with money you can afford to lose. Trading Forex and CFDs may not be suitable for all investors, so please ensure that you fully understand the risks involved and seek independent advice if necessary.
Disclaimer:
The above opinions given constitute general market commentary, and do not constitute the opinion or advice of IC Markets or any form of personal or investment advice.
Any opinions, news, research, analyses, prices, other information, or links to third-party sites contained on this website are provided on an "as-is" basis, are intended only to be informative, is not an advice nor a recommendation, nor research, or a record of our trading prices, or an offer of, or solicitation for a transaction in any financial instrument and thus should not be treated as such. The information provided does not involve any specific investment objectives, financial situation and needs of any specific person who may receive it. Please be aware, that past performance is not a reliable indicator of future performance and/or results. Past Performance or Forward-looking scenarios based upon the reasonable beliefs of the third-party provider are not a guarantee of future performance. Actual results may differ materially from those anticipated in forward-looking or past performance statements. IC Markets makes no representation or warranty and assumes no liability as to the accuracy or completeness of the information provided, nor any loss arising from any investment based on a recommendation, forecast or any information supplied by any third-party.

Oil Bearish for next weekOil will be bearish for next week. Toxic Sell and Calender spread shows the direction.

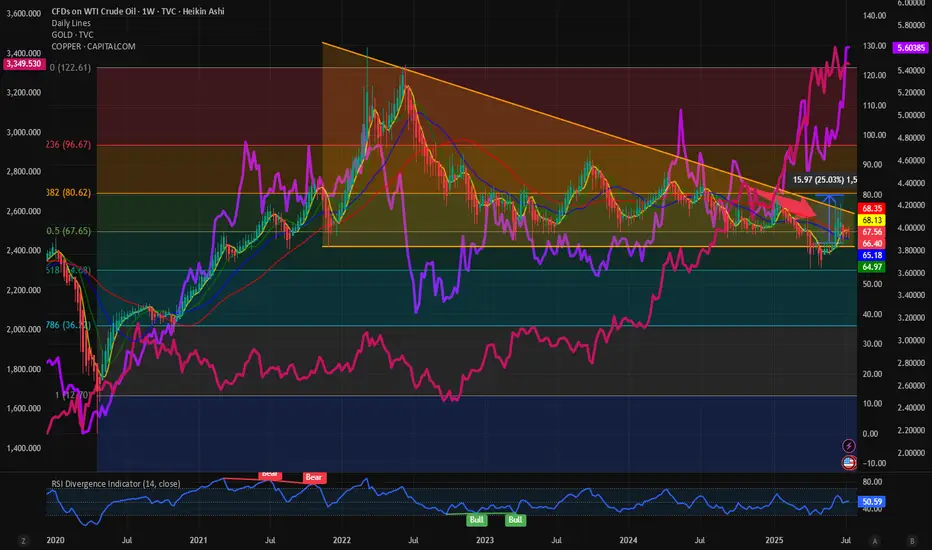
$USOIL: Will we see breakout or breakdown from this wedge? I have been watching the Commodity markets recently keenly to get direction or for market indications. AMEX:GLD , Copper and TVC:USOIL are the big 3 which determines the direction of commodity markets and hence the inflation. Inflation dictates direction of TVC:US10Y , TVC:DXY and hence the Equity markets. So, what are commodity markets telling us? With AMEX:GLD and OANDA:XCUUSD at ATH what does this mean for TVC:USOIL : TVC:USOIL Is in a bearish pattern and no sign of concrete bullish reversal on the commodity. Recently it has shown some signs of strength but still below its 0.5 Fib retracement level which is at 68 and we have time and again said that 0.318 Fib level at 80 $ might prove to be an upper resistance which will be difficult to breakout.
In the recent months whenever TVC:USOIL tries to break out of the 60 RSI sellers came back and pushed the prices down. Currently with RSI at 50 we might have some room for upside. Oil bulls can have a 20% upside in the RSI taking it to 60 which has historically proved to be a resistance. And a 20% upside in price is also possible with price hitting our 0.318 resistance level of 80%. Above that there is limited upside for $USOIL. The downward slopping wedge shown below indicates a breakout might be imminent which might take TVC:USOIL to 80 $ which is our highest target in this range bound market.
In contrast the bull run in other important commodities like AMEX:GLD and COPPER might have some legs as they are showing strength by breaking above the previous ATH. It is always a good idea to buy strength and ATH.
Verdict: TVC:USOIL remains range bound with 55 $ on lower bound and 80 on the upper bound. Commodity bulls can look at AMEX:GLD and OANDA:XCUUSD for better returns.
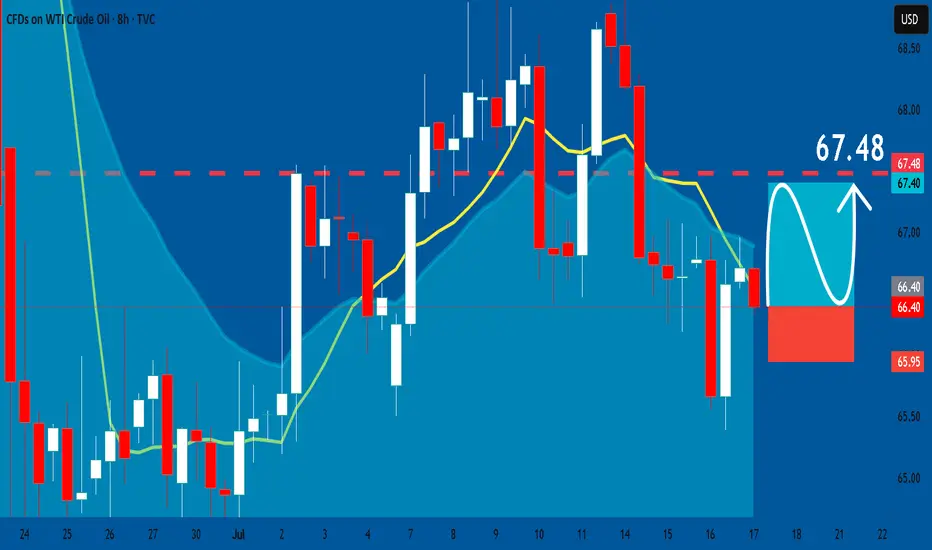
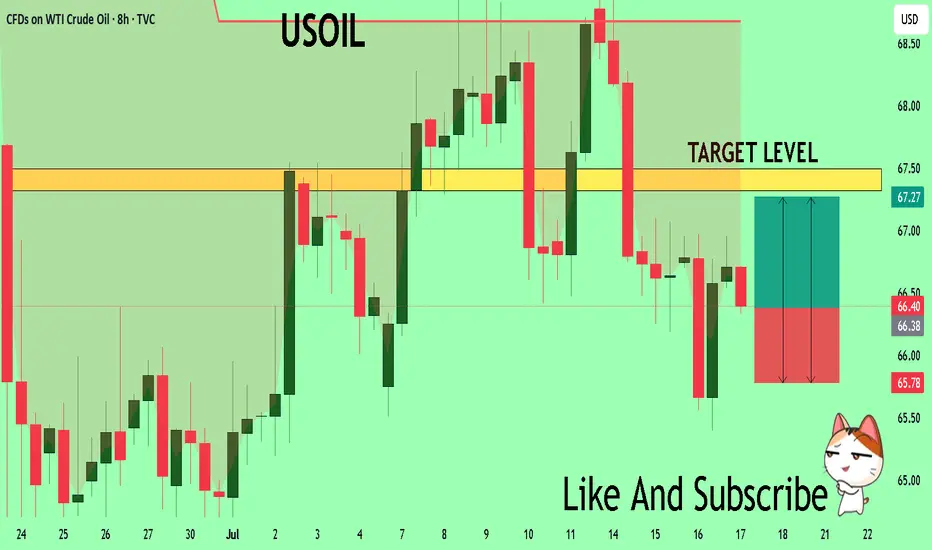
USOIL: Bullish Continuation & Long Trade
USOIL
- Classic bullish pattern
- Our team expects retracement
SUGGESTED TRADE:
Swing Trade
Buy USOIL
Entry - 66.40
Stop - 65.95
Take - 67.48
Our Risk - 1%
Start protection of your profits from lower levels
Disclosure: I am part of Trade Nation's Influencer program and receive a monthly fee for using their TradingView charts in my analysis.
❤️ Please, support our work with like & comment! ❤️
Crude fall - short termI am anticipating crude to fall these marked levels because:
1. Strong Opening Gap which usually closes after some time
2. Liquidity levels are at the same place as the Opening Gap.
3. Oil price has to fallback a bit more and consolidate a bit more to have a healthy patterns to rise until potential 90.
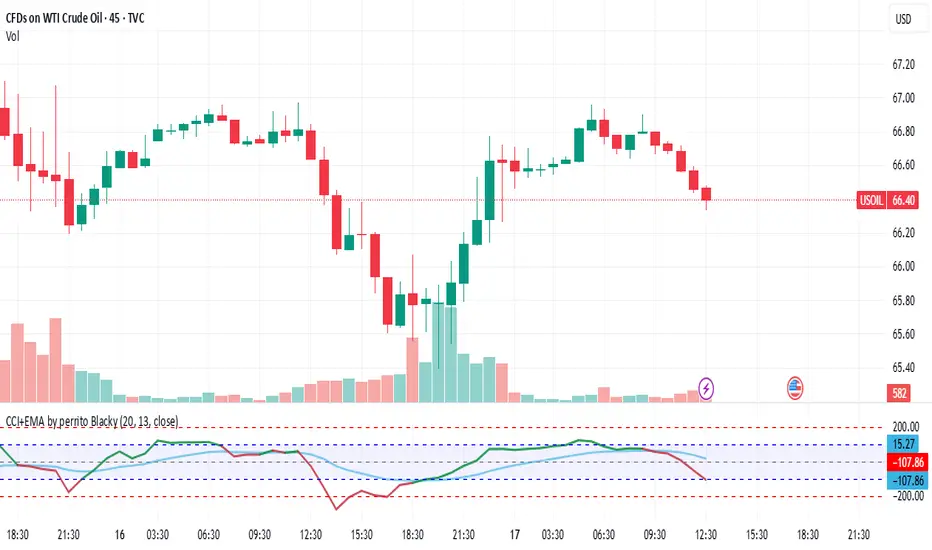
USOIL Technical Analysis! BUY!
My dear followers,
This is my opinion on the USOIL next move:
The asset is approaching an important pivot point 66.40
Bias - Bullish
Safe Stop Loss - 65.78
Technical Indicators: Supper Trend generates a clear long signal while Pivot Point HL is currently determining the overall Bullish trend of the market.
Goal - 67.32
About Used Indicators:
For more efficient signals, super-trend is used in combination with other indicators like Pivot Points.
Disclosure: I am part of Trade Nation's Influencer program and receive a monthly fee for using their TradingView charts in my analysis.
———————————
WISH YOU ALL LUCK
WTI USOIL As of July 19, 2025, the WTI crude oil price is hovering around $67.342 to $68.83 per barrel after attempting 77.52$ per barrel on Israel Iran conflict in the middle east. As a trader Make out time to look into OPEC WORLD OIL OUTLOOK(WOO) REPORT,SPR REPORT , this woo report provide comprehensive industry forecast and strategic petroleum reserve gives insight into united state energy status.
OPEC meetings are usually held in Vienna and involves discussions and agreement on oil production quotas affecting the global crude oil supply and prices.
oil sharply rose during Israel and Iran geopolitical tension and on the supply roof rejected AT 77.52$ PER BARREL ..
Supply remains cautiously controlled because price is influenced by demand and supply system , but global economic uncertainties and trade tensions, especially involving tariffs and sanctions, continue to influence oil demand expectations.
the US Strategic petroleum reserve (SPR) is the united states emergency crude oil stockpile managed by department of energy ,it act as a buffer to protect against significant supply disruption of oil market, the SPR holds hundreds of millions of barrels of crude oil stored in the underground salt caverns along the gulf coast.it can be tapped to stabilize the market during supply crises or emergencies .
the U.S government occasionally release oil from the SPR to ease supply shortage or control fuel prices coordinated with other countries through the international energy agency if need be.the status and release are regularly monitored as they affect global oil prices and energy security
Am holding WTI OIL low buy and will continue until the break of demand floor and might add more buy if the sentiment holds buy idea.
Trading OIL AND GAS is 100% probability , No one can tell the next crisis and global energy supply disruption.
Manage your risk.

CRUDE OIL BEARISH BREAKOUT|SHORT|
✅CRUDE OIL broke the rising
Support line which is now a resistance
And the price made a retest an a pullback
So we we are bearish biased and we
Will be expecting a further
Bearish move down
SHORT🔥
✅Like and subscribe to never miss a new idea!✅
Disclosure: I am part of Trade Nation's Influencer program and receive a monthly fee for using their TradingView charts in my analysis.

USOIL - BULLISH MOVE !Hello Traders !
The USOIL failed to create a new lower low!
The price broke the lower high (choch).
So, I expect a bullish move🚀
______________
TARGET: 68.880🎯
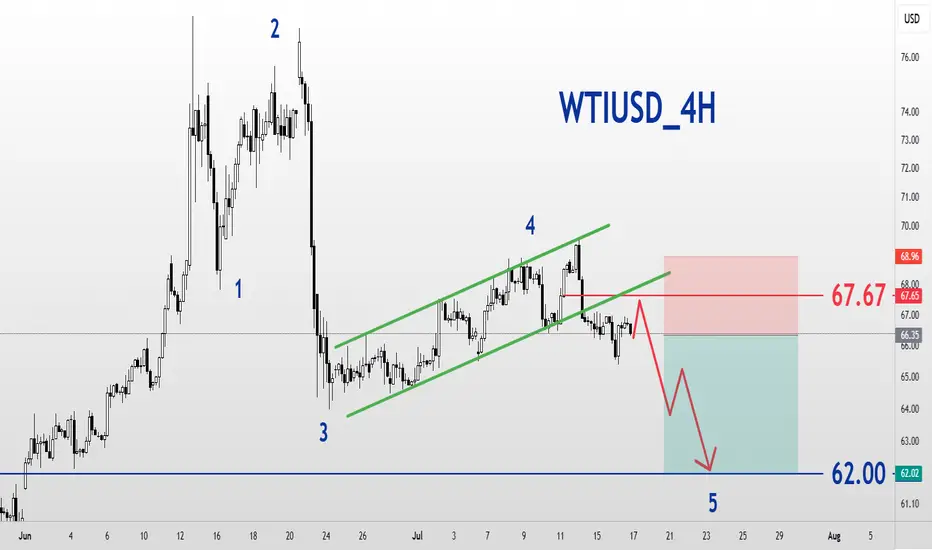
WTIUSD_4H_SellWest Texas Intermediate Oil Analysis
Short-term Time Frame
Elliott Wave Analysis Style
The market can only continue to decline by holding the resistance at 67.67 and moving towards the target of wave 5 at $62.
BRENT CRUDE OIL FORMED A BEARISH WEDGE. ANOTHER POSSIBLE DECLINEBRENT CRUDE OIL FORMED A BEARISH WEDGE. ANOTHER POSSIBLE DECLINE?📉
USOIL has been trading bullish within the last couple of days, supported by prospects of tighter supply and an improved demand outlook. US crude inventories dropped last week, which indicates firm demand despite the rising output.
Still, technically, oil looks bearish. It has formed a bearish wedge and is currently testing the former trendline from below. The most probable scenario is that wee see the bearish impulse towards 6,500.00 with further decline. Another option is that the rise will continue towards 6,900.00 level.

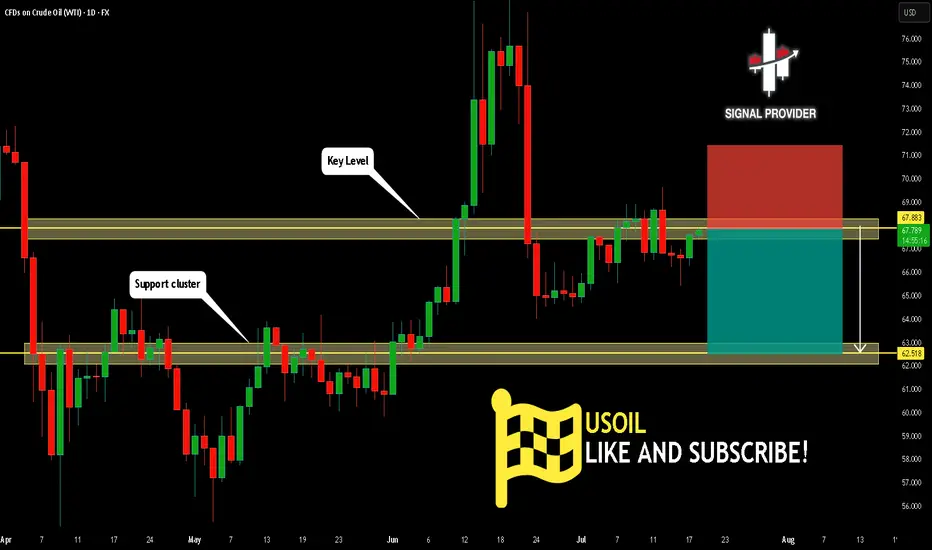
USOIL Will Go Lower! Sell!
Take a look at our analysis for USOIL.
Time Frame: 1D
Current Trend: Bearish
Sentiment: Overbought (based on 7-period RSI)
Forecast: Bearish
The price is testing a key resistance 67.883.
The above-mentioned technicals clearly indicate the dominance of sellers on the market. I recommend shorting the instrument, aiming at 62.518 level.
P.S
Overbought describes a period of time where there has been a significant and consistent upward move in price over a period of time without much pullback.
Disclosure: I am part of Trade Nation's Influencer program and receive a monthly fee for using their TradingView charts in my analysis.
Like and subscribe and comment my ideas if you enjoy them!