WUSDT 1D AnalysisW ~ 1D✅ Analysis
#W Buy after successfully breaking through this resistance line with a short-term target of at least 10%+
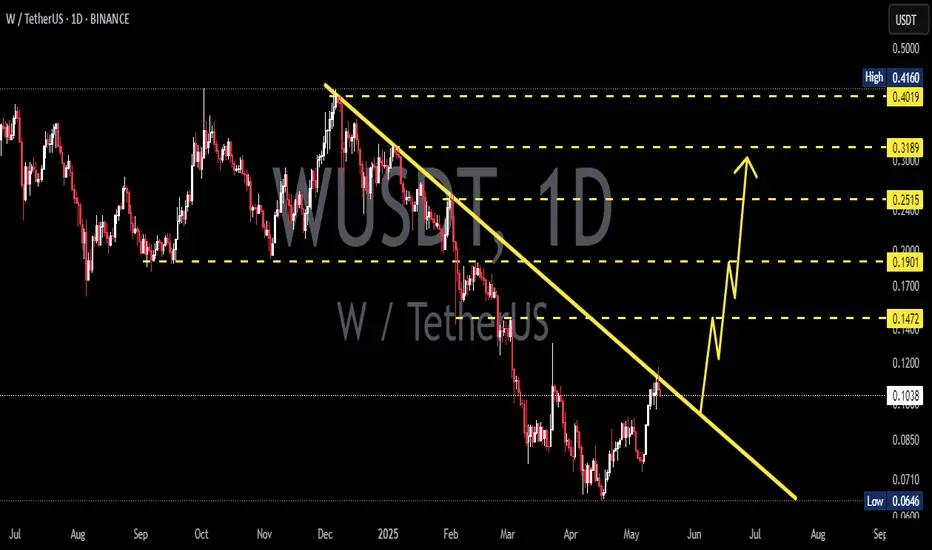
WUSDT 2D#W is approaching the descending resistance on the 2-day timeframe. A breakout above this trendline and the EMA50 could signal the start of a strong bullish wave. Watch for confirmation before entering.
Targets after breakout:
🎯 $0.1474
🎯 $0.1986
🎯 $0.2400
🎯 $0.2813
🎯 $0.3403
🎯 $0.4153
⚠️ Use a t

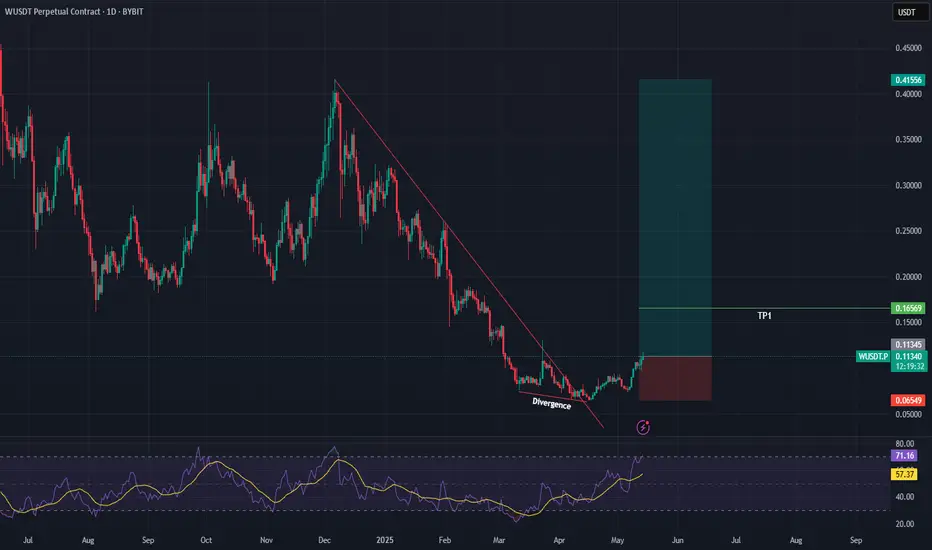
WUSDT – Daily Bullish Divergence WUSDT – Daily Bullish Divergence | Early Reversal Signals In Play 🔄📈
What’s up traders 👋
WUSDT is starting to show some life after a consistent downtrend — and the first real sign of a shift is now visible:
✅ Bullish divergence on the daily chart
This isn’t some noise on a 15-minute scalp — this is
W to longW have broken out of its long term trend. one can open long position.
Entry: 0.07315
Tp1 : 0.13
Tp 2: 0.18
Stoploss: 0.06330

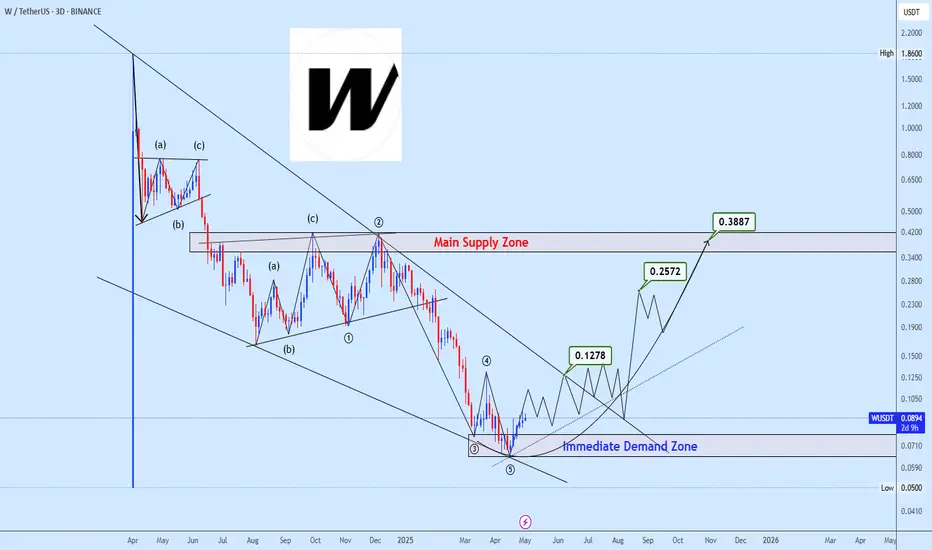
Bullish Setup Spotted on WUSDT Key Demand Zone in PlaySpotted potential falling wedge formation, a classic bullish reversal setup that has now completed its five-wave structure with a breakout from the lower trendline.
Focus remains on the Immediate Demand Zone as a critical area for re-accumulation. The projected path suggests steady bullish progres
Looks positive for a move up.BINANCE:WUSDT
I think the current price is reasonable for an entry.
I’ve set my own targets — planning to sell about 30% at each one, and I’ll keep 10% just in case.
Not encouraging anyone to buy.
Always do your own technical analysis.
I personally only trade new coins that haven’t had a full pu

Strong Breakout on WUSDT: Potential for Major Bullish Move WUSDT has recently completed a strong breakout from a key resistance zone, signaling a potential shift in momentum and attracting significant attention from traders. The technical setup points to a confirmed breakout with increased trading volume, which typically precedes a powerful rally. This move

Trading opportunity for WUSDTBased on technical factors there is a Buy position in :
📊 WUSDT
🔵 Buy Now or Buy Stop by 0.89
🪫Stop loss 0.0740
🔋Target 0.1240
📏 R/R 4,2
💸RISK : 1%
We hope it is profitable for you ❤️
Please support our activity with your likes👍 and comments📝

#WUSDT LONG #WUSDT
Looking good for a quick reversal from here.
Reason:
1. Holding that support area very well. Did couple successful retests of same zone.
2.Retested bullish Trend line breakout.
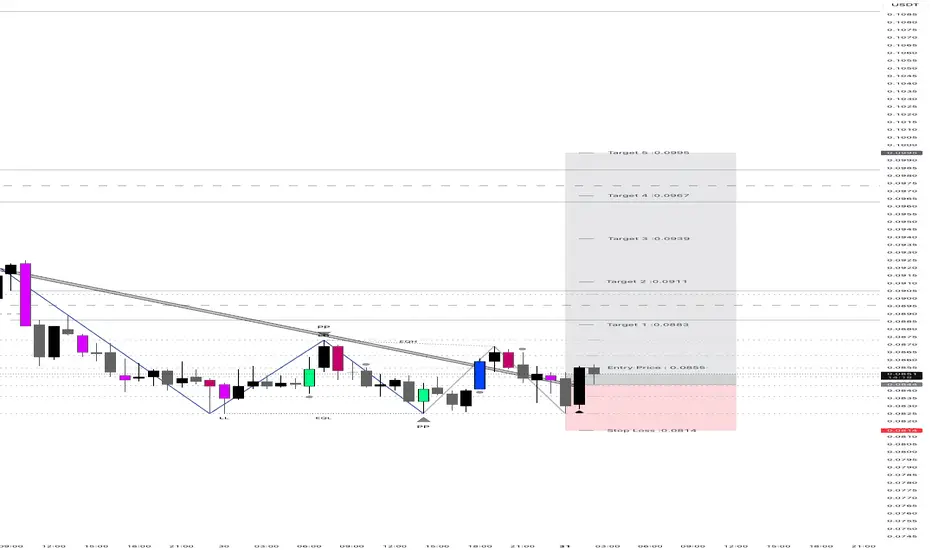
WUSD/T (Wormhole Token/Tether) - 4H Timeframe: Long itKey Observations:
Price at a Critical Support Zone:
The current price is at 0.08320, sitting squarely within a well-defined "Buy Zone" between 0.08320 and 0.09263 (blue shaded area). This zone has acted as a strong support in the past, as evidenced by the price bouncing off this level multiple times

See all ideas
Summarizing what the indicators are suggesting.
Oscillators
Neutral
SellBuy
Strong sellStrong buy
Strong sellSellNeutralBuyStrong buy
Oscillators
Neutral
SellBuy
Strong sellStrong buy
Strong sellSellNeutralBuyStrong buy
Summary
Neutral
SellBuy
Strong sellStrong buy
Strong sellSellNeutralBuyStrong buy
Summary
Neutral
SellBuy
Strong sellStrong buy
Strong sellSellNeutralBuyStrong buy
Summary
Neutral
SellBuy
Strong sellStrong buy
Strong sellSellNeutralBuyStrong buy
Moving Averages
Neutral
SellBuy
Strong sellStrong buy
Strong sellSellNeutralBuyStrong buy
Moving Averages
Neutral
SellBuy
Strong sellStrong buy
Strong sellSellNeutralBuyStrong buy
Displays a symbol's price movements over previous years to identify recurring trends.