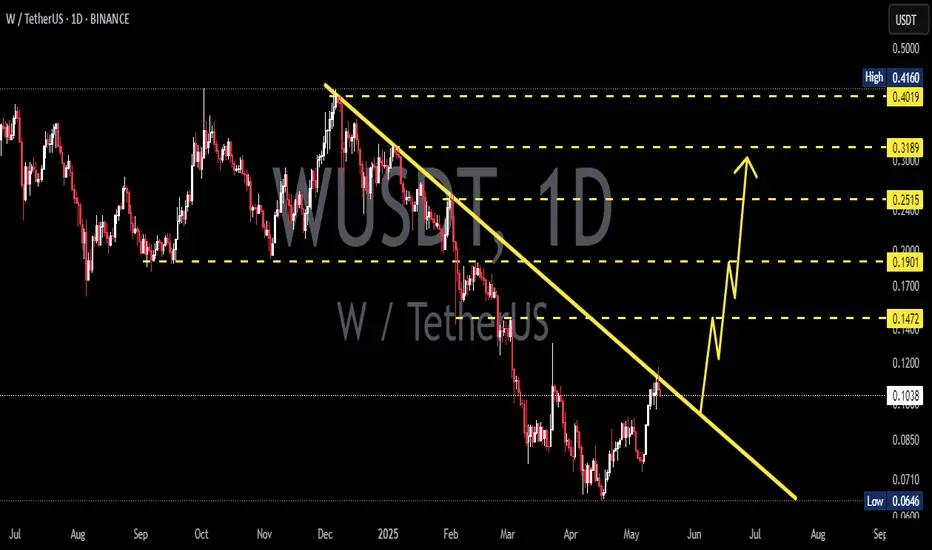
WUSDT 1D AnalysisW ~ 1D✅ Analysis
#W Buy after successfully breaking through this resistance line with a short-term target of at least 10%+
WUSDT.P trade ideas
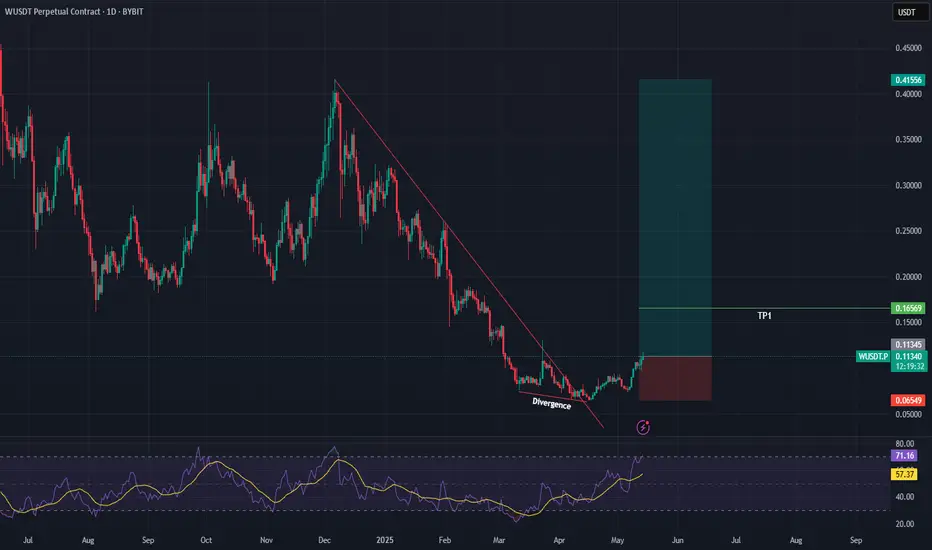
WUSDT – Daily Bullish Divergence WUSDT – Daily Bullish Divergence | Early Reversal Signals In Play 🔄📈
What’s up traders 👋
WUSDT is starting to show some life after a consistent downtrend — and the first real sign of a shift is now visible:
✅ Bullish divergence on the daily chart
This isn’t some noise on a 15-minute scalp — this is daily timeframe divergence, and that’s often the first clue that momentum is quietly turning.
🔍 Bullish Divergence Breakdown
Price: Making lower lows, continuing the downtrend
RSI (or MACD): Making higher lows, indicating loss of bearish momentum
This is the textbook setup where sellers are still pushing price down — but buyers are starting to step in beneath the surface. That’s usually followed by:
A range
A breakout
And often, a sharp bounce
⚡ What to Watch Next
Support zone: Is price bouncing off a previous base?
Volume: Any spike or subtle increase?
Candle strength: Bullish engulfing or long-wick rejections?
If any of those line up with the divergence — we’ve got a high-probability bounce/reversal scenario in motion.
🎯 Trade Strategy Idea
Aggressive Entry: Off the divergence zone + candle confirmation
Conservative Entry: Wait for a break above recent swing high
Stop Loss: Just below the recent low
Targets: Previous resistance levels or fib retracement zones (38.2% / 61.8%)
📌 WUSDT Showing Daily Bullish Divergence – Is Momentum About to Flip?
Time to position early or wait for confirmation? Drop your thoughts & setups 👇
#WUSDT #BullishDivergence #DailyChart #CryptoTrading #Altcoins #ReversalSetup #SmartMoney #TechnicalAnalysis #MomentumShift
WUSDT 2D#W is approaching the descending resistance on the 2-day timeframe. A breakout above this trendline and the EMA50 could signal the start of a strong bullish wave. Watch for confirmation before entering.
Targets after breakout:
🎯 $0.1474
🎯 $0.1986
🎯 $0.2400
🎯 $0.2813
🎯 $0.3403
🎯 $0.4153
⚠️ Use a tight stop-loss.

W to longW have broken out of its long term trend. one can open long position.
Entry: 0.07315
Tp1 : 0.13
Tp 2: 0.18
Stoploss: 0.06330

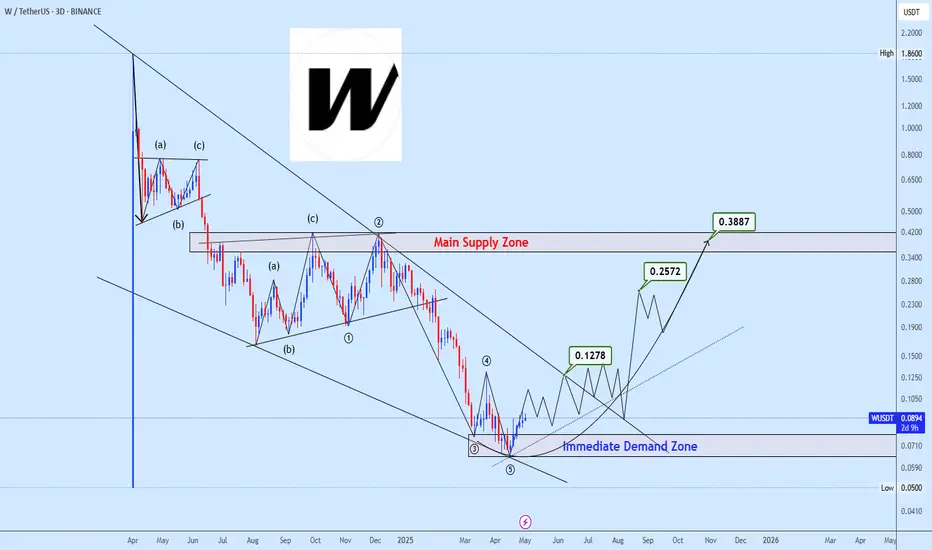
Bullish Setup Spotted on WUSDT Key Demand Zone in PlaySpotted potential falling wedge formation, a classic bullish reversal setup that has now completed its five-wave structure with a breakout from the lower trendline.
Focus remains on the Immediate Demand Zone as a critical area for re-accumulation. The projected path suggests steady bullish progression with price targeting 0.1278, then 0.2572, and ultimately 0.3887.
Main Supply Zone around the final target is the key level to watch for any major trend reversal or breakout continuation.
Looks positive for a move up.BINANCE:WUSDT
I think the current price is reasonable for an entry.
I’ve set my own targets — planning to sell about 30% at each one, and I’ll keep 10% just in case.
Not encouraging anyone to buy.
Always do your own technical analysis.
I personally only trade new coins that haven’t had a full pump yet.
After listing, I wait for a 65–95% pullback and then start averaging in with 3–4 spot buys.
I use Fibonacci and other tools to set my targets.
It’s a good sign if there’s a breakout of the downtrend and a structure shift.
I’m not looking for advice — my own experience is enough.

Strong Breakout on WUSDT: Potential for Major Bullish Move WUSDT has recently completed a strong breakout from a key resistance zone, signaling a potential shift in momentum and attracting significant attention from traders. The technical setup points to a confirmed breakout with increased trading volume, which typically precedes a powerful rally. This move is further supported by market participants showing renewed interest in the project fundamentals, positioning WUSDT for a potential bullish continuation.
With solid volume pouring in post-breakout, WUSDT looks ready to make a major move to the upside. Current market structure indicates a healthy retest of the breakout level, setting the stage for a possible rally of 250% to 300% in the coming sessions. Such gains are within reach, especially if broader market sentiment remains positive and volume continues to climb.
Investor confidence in WUSDT is growing, as many see it as an undervalued gem ready to reclaim higher levels. Its technical strength, combined with strong buying activity, presents an attractive opportunity for both swing traders and long-term holders. Watch for key psychological resistance levels to act as future targets while support holds firm below.
✅ Show your support by hitting the like button and
✅ Leaving a comment below! (What is You opinion about this Coin)
Your feedback and engagement keep me inspired to share more insightful market analysis with you!

Trading opportunity for WUSDTBased on technical factors there is a Buy position in :
📊 WUSDT
🔵 Buy Now or Buy Stop by 0.89
🪫Stop loss 0.0740
🔋Target 0.1240
📏 R/R 4,2
💸RISK : 1%
We hope it is profitable for you ❤️
Please support our activity with your likes👍 and comments📝

#WUSDT LONG #WUSDT
Looking good for a quick reversal from here.
Reason:
1. Holding that support area very well. Did couple successful retests of same zone.
2.Retested bullish Trend line breakout.
WUSD/T (Wormhole Token/Tether) - 4H Timeframe: Long itKey Observations:
Price at a Critical Support Zone:
The current price is at 0.08320, sitting squarely within a well-defined "Buy Zone" between 0.08320 and 0.09263 (blue shaded area). This zone has acted as a strong support in the past, as evidenced by the price bouncing off this level multiple times in mid-March.
The price has just touched the lower boundary of this buy zone, which historically has been a springboard for upward moves, making it an ideal entry point for a long position.
Potential Reversal Setup:
After a significant downtrend from late March (where the price dropped from 0.1400 to 0.08320), the price has consolidated in this buy zone, showing signs of stabilization.
The sharp decline appears to have exhausted selling pressure, and the lack of further breakdown below 0.08320 suggests buyers are stepping in to defend this level.
The chart shows a potential double-bottom pattern forming around 0.08320, a bullish reversal pattern that often signals the end of a downtrend.
Take-Profit Levels (TP) and Risk-Reward:
The chart marks several take-profit levels for a long trade:
TP1: 0.09546 (just above the buy zone, a 14.8% gain from 0.08320)
TP2: 0.1000 (20.2% gain)
TP3: 0.11629 (39.8% gain)
TP4: 0.12438 (49.5% gain)
The stop-loss level is marked at 0.07265 (purple shaded area), which is 12.7% below the current price. This provides an excellent risk-to-reward ratio, especially if targeting TP2 or higher (e.g., 20.2% gain vs. 12.7% risk for TP2, a 1.6:1 R:R).
Volume and Momentum:
While volume isn’t directly shown, the sharp drop in late March likely came with high selling volume, which has since tapered off as the price consolidates in the buy zone. This suggests selling pressure is diminishing.
The consolidation phase in the buy zone, with smaller candlestick ranges, indicates reduced volatility and a potential buildup for a breakout to the upside.
Broader Market Context:
Wormhole Token (W) is a cross-chain protocol token, often influenced by DeFi and interoperability trends in the crypto space. As of March 30, 2025, if the broader crypto market is showing signs of recovery (e.g., Bitcoin or Ethereum trending upward), this could provide a tailwind for smaller altcoins like Wormhole to rally.
The price being at a multi-month low (0.08320) suggests it may be undervalued, attracting value buyers or swing traders looking for a bounce.
Long Trade Recommendation:
Entry: Enter a long position at the current price of 0.08320, as the price is testing a historically strong support level with signs of a potential reversal.
Stop Loss: Place a stop loss just below the marked stop-loss level at 0.07265 to protect against a breakdown. This keeps the risk at 12.7%.
Take Profit:
Conservative Target: Take partial profits at TP1 (0.09546) for a 14.8% gain.
Primary Target: Aim for TP2 (0.1000) for a 20.2% gain, which is a realistic target given the price’s historical resistance at this level.
Stretch Target: If momentum picks up, hold a portion of the position for TP3 (0.11629) or TP4 (0.12438) for gains of 39.8% or 49.5%, respectively.
Risk Management: Risk 1-2% of your account on this trade. For example, with a $10,000 account, risking 1% ($100) means your position size should be adjusted so that a 12.7% drop (from 0.08320 to 0.07265) equals $100. This would allow a position size of approximately $787 (since $787 * 0.127 = $100).
Trade Management: If the price breaks above 0.09263 (upper boundary of the buy zone), this confirms the bullish setup. Consider trailing your stop loss to lock in profits as the price hits each TP level.
Why Long?:
The price is at a strong support level (0.08320–0.09263), with historical evidence of bounces from this zone.
A potential double-bottom reversal pattern is forming, signaling the end of the downtrend.
The risk-to-reward ratio is highly favorable, with a 12.7% risk for a potential 20.2%–49.5% reward.
The consolidation in the buy zone suggests selling pressure is fading, and buyers may step in to push the price higher.
If the broader crypto market is bullish or Wormhole announces positive developments, this could act as a catalyst for a rally.

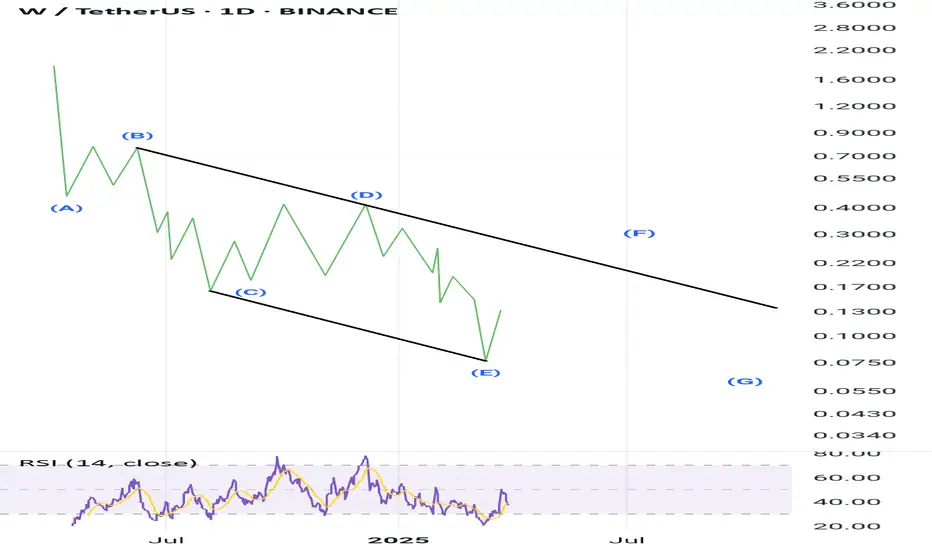
WusdtWusdt
Neowave
This analysis has been drawn using monthly cache data.
It will either form a Diametric or a Symmetric pattern.
In both cases, we can see that an upward move will occur, and a high trading volume over several days could be the trigger for this movement.
W ( SPOT -INVEST)BINANCE:WUSDT
WLD / USDT
(4H + 1D) time frames
analysis tools
____________
SMC
FVG
Trend lines
Fibonacci
Support & resistance
MACD Cross
EMA Cross
______________________________________________________________
Golden Advices.
********************
* Please calculate your losses before any entry.
* Do not enter any trade you find it not suitable for you.
* No FOMO - No Rush , it is a long journey.
Useful Tags.
****************
My total posts
www.tradingview.com

w coin another pump loadingW coin has done CHoCH on major structure with a bullish and big candle. According fib levels, its in buy zone and will pump again. Buy some in spot.

WUSDT – Major Resistance Zones Ahead! “This is where the battle happens—will resistance hold, or are we about to see an explosive breakout?”
🔥 Key Insights:
✅ Red Lines = Strong Resistance – These levels have proven themselves before, and now they are back in play.
✅ Risking 1R on Both – Calculated risk, sniper execution. No random entries, just smart positioning.
✅ LTF Confirmation is Everything – Price touching resistance means nothing—we wait for true weakness or strength before pulling the trigger.
💡 How I’m Trading This Like a Pro:
If Price Rejects Hard: I’ll wait for a clear LTF (5M/15M) breakdown with CDV divergence before shorting.
If We Break Resistance: No panic buys—I’ll wait for a clean breakout, retest, and LTF strength confirmation before considering longs.
Stops? Last swing high. Precision over emotions.
📉 Final Thought:
Retail traders FOMO, real traders wait. Patience, execution, and data-driven decisions win the game. We don’t guess—we react like pros.
“Follow me if you’re tired of chasing bad trades. Let’s trade like the 1%.” 🚀🔥📊
A tiny part of my runners;
💼 STMXUSDT: 2 Buying Areas
🐢 TURBOUSDT: Buy Zones and Buyer Presence
🌍 ICPUSDT.P: Massive Upside Potential | Check the Trade Update For Seeing Results
🟠 IDEXUSDT: Spot Buy Area | %26 Profit if You Trade with MSB
📌 USUALUSDT: Buyers Are Active + %70 Profit in Total
🌟 FORTHUSDT: Sniper Entry +%26 Reaction
🐳 QKCUSDT: Sniper Entry +%57 Reaction
j
A tiny part of my runners:
🎯 ZENUSDT.P: Patience & Profitability | %230 Reaction from the Sniper Entry
🐶 DOGEUSDT.P: Next Move
🎨 RENDERUSDT.P: Opportunity of the Month
💎 ETHUSDT.P: Where to Retrace
🟢 BNBUSDT.P: Potential Surge
📊 BTC Dominance: Reaction Zone
🌊 WAVESUSDT.P: Demand Zone Potential
🟣 UNIUSDT.P: Long-Term Trade
🔵 XRPUSDT.P: Entry Zones
🔗 LINKUSDT.P: Follow The River
📈 BTCUSDT.P: Two Key Demand Zones
🟩 POLUSDT: Bullish Momentum
🌟 PENDLEUSDT.P: Where Opportunity Meets Precision
🔥 BTCUSDT.P: Liquidation of Highly Leveraged Longs
🌊 SOLUSDT.P: SOL's Dip - Your Opportunity
🐸 1000PEPEUSDT.P: Prime Bounce Zone Unlocked
🚀 ETHUSDT.P: Set to Explode - Don't Miss This Game Changer
🤖 IQUSDT: Smart Plan
⚡️ PONDUSDT: A Trade Not Taken Is Better Than a Losing One
💼 STMXUSDT: 2 Buying Areas
🐢 TURBOUSDT: Buy Zones and Buyer Presence
🌍 ICPUSDT.P: Massive Upside Potential | Check the Trade Update For Seeing Results
🟠 IDEXUSDT: Spot Buy Area | %26 Profit if You Trade with MSB
📌 USUALUSDT: Buyers Are Active + %70 Profit in Total
🌟 FORTHUSDT: Sniper Entry +%26 Reaction
🐳 QKCUSDT: Sniper Entry +%57 Reaction
📊 BTC.D: Retest of Key Area Highly Likely
I stopped adding to the list because it's kinda tiring to add 5-10 charts in every move but you can check my profile and see that it goes on..

Wormhole (W): Is the Correction Over? Targeting $0.1700 and $0.2Greetings, fellow traders!
Following a significant rally that reached the $0.1300 resistance zone, Wormhole (W) is currently undergoing a corrective phase. This retracement is finding support near the key 0.50 and 0.618 Fibonacci levels, a common area for price consolidation before a potential trend continuation.
Anticipated Price Action:
Based on the current technical structure, a resumption of the upward trend towards the $0.1700 and $0.2000 resistance levels is anticipated. The timeframe for this projected move is estimated to be within the next 24 hours. However, this is a projection, and market conditions can change rapidly.
Trading Considerations:
Cautious Entry: While a continuation of the uptrend is likely, traders should exercise caution when initiating long positions. Confirmation of bullish momentum, such as a strong bullish candlestick pattern or a break above a short-term resistance level, is recommended before entry. Entering during a retracement carries increased risk.
Fibonacci Support: Monitor price action closely around the 0.50 and 0.618 Fibonacci levels. These levels may act as potential support and provide opportunities for entry, if accompanied by bullish confirmation signals.
Timeframe: Keep the projected 24-hour timeframe in mind, but remain adaptable to changing market dynamics.
Disclaimer:
This analysis is for informational purposes only and should not be considered financial advice. All trading decisions should be made after conducting thorough independent research, including a comprehensive risk assessment. Market conditions can be volatile, and past performance is not indicative of future results.

W token a most interesting and invested W a cross chain based on Solana. A most interesting and invested project on all crypto history. Here a plane to trade futures

W - Memecoin With 15-30x Potential!Hello, Skyrexians!
In the era of memecoins when everyone is talking about PEPE, DOGE and HMSTR we have the quite meme BINANCE:WUSDT which is now at the very low prices with the almost clear Elliott waves structure.
Let's take a look at the weekly chart. The listing pump as usual we can count as the wave 1, after that we can see the wave 2 represented as a zigzag ABC. There are not so many candles on the chart, so using other indicators can't be so efficient. You shall understand that this coin is high risk, I personally have only 2% of deposit in this coin, but it has the huge potential to 1-1.61 Fibonacci Extensions. Final target is $1.9-$3.
Best regards,
Skyrexio Team
___________________________________________________________
Please, boost this article and subscribe our page if you like analysis!

#WUSDT is setting up for a breakout📉 Long BYBIT:WUSDT.P from $0,08897
🛡 Stop loss $0,1985
1h Timeframe
⚡ Plan:
➡️ Waiting for consolidation near resistance and increased buying activity before the breakout.
➡️ Expecting an impulsive upward move as buy orders accumulate.
🎯 TP Targets:
💎 TP 1: $0,09275
💎 TP 2: $0,09465
💎 TP 3: $0,09566
🚀 BYBIT:WUSDT.P is setting up for a breakout—preparing for an upward move!

Trading opportunity for WUSDTBased on technical factors there is a Buy position in :
📊 WUSDT
🔵 Buy Now
🪫Stop loss 0.0820
🔋Target 0.1090
📏 R/R 2,5
💸RISK : 1%
We hope it is profitable for you ❤️
Please support our activity with your likes👍 and comments📝

Wormhole $W expecting ride in upcoming months - Hi 👋🏻 it's me your " Raj_crypt0 " once again back with potential growth coin ..... ✍🏻
• BINANCE:WUSDT / #w ( wormhole ) ... Analysis ⏰
🗝️ $0.45 is an important resistance expecting would be turn future support 💪🏻
🎯 $5 ...... ( Expecting 10X / +1000% from $0.45 confirmation zone )
__________________________________________________
🛑 Pls " DYOR " _ NOT A FINANCIAL ADVISOR 🚏
------------------------------------------------------------------------------
The FDV was sitting SEED_TVCODER77_ETHBTCDATA:4B around compared to present market cap it was 3 times ,
Expecting huge dollar in this project , circulation supply was around 3B / max supply was 10B
Presently they don't have much unlock 🔓 supply to the market....... ‼️
Easily expecting SEED_TVCODER77_ETHBTCDATA:10B - FWB:15B market cap .... Which can complete my target $5 .... 🎯
Hitting new low failure of my analysis ⏰ gradually...... 🛑
👉🏻 Follow me and my analysis for future content and updates ☝🏻

Alikze »» W | Formation of the Double Bottom pattern - 1D🔍 Technical analysis: Formation of a Double Bottom pattern in a descending channel
📣 BINANCE:WUSDT It is moving in a descending channel on the daily time frame.
🟢 In the Buyer Zone, by forming a Double Bottom and a candlestick pattern, it can continue its growth in the first step to the first supply zone.
🟢 If an inverted head and shoulders pattern is formed in the supply zone, it can continue its upward trend to the next supply zone.
🟢 Therefore, if the Buyer Zone is maintained, an upward trend in the form of a three-wave up to the 40 cent range is expected.
»»»«««»»»«««»»»«««
Please support this idea 💡 with a LIKE 👍 and COMMENT 💬 if you find it useful and Click "Follow" on our profile if you'd like these trade ideas delivered straight to your email 📧 in the future.
Thanks for your continued support.🙏
Best Regards,❤️
Alikze.
»»»«««»»»«««»»»«««

W - Wormholestill sidelined? don't know what to do?
Take a look at NYSE:ZK , CSE:ZRO , and NYSE:W
position yourself accordingly, NFA

W/USDT | 1W🩸 NYSE:W ⁀➷
#Wormhole. Macro chart Another
💯 Intermediate Target - $1.23
🚩 Macro Target 1 - $1.90
🚩 Macro Target 2 - $3.40
🚩 Macro Target 3 - $5.60
- Not financial advice, trade with caution.
#Crypto #Wormhole #W #Investment
✅ Stay updated on market news and developments that may influence the price of Wormhole. Positive or negative news can significantly impact the cryptocurrency's value.
✅ Exercise patience and discipline when executing your trading plan. Avoid making impulsive decisions driven by emotions, and adhere to your strategy even during periods of market volatility.
✅ Remember that trading always involves risk, and there are no guarantees of profit. Conduct thorough research, analyze market conditions, and be prepared for various scenarios. Trade only with funds you can afford to lose and avoid excessive risk-taking.
