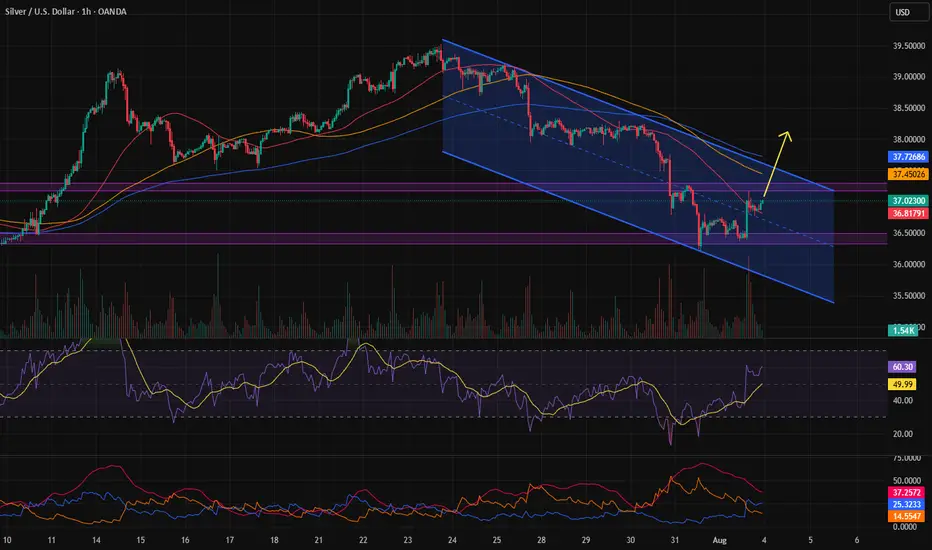
Trend reversal?If the support in the \$37–\$38 range is confirmed, a long position can be taken targeting a new all-time high (ATH).
XAGUSD trade ideas
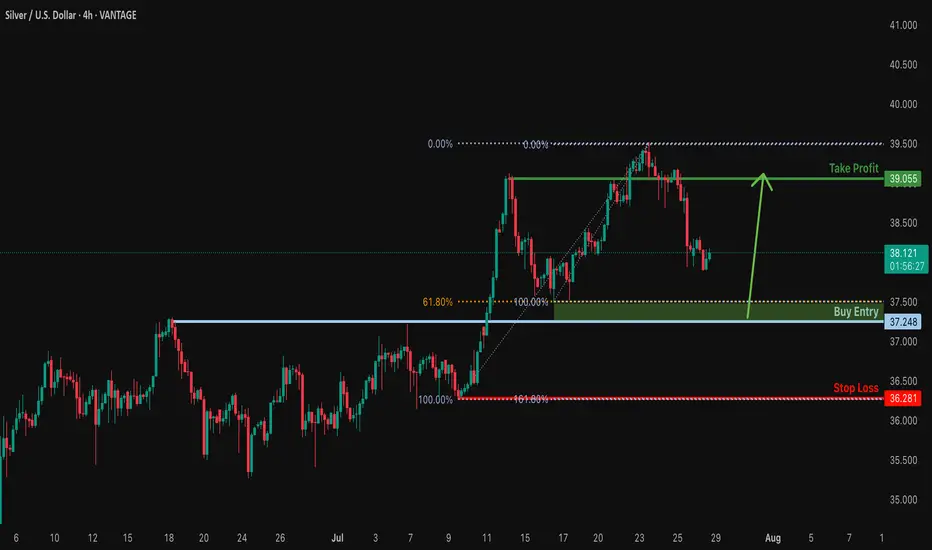
Bullish bounce for the Silver?The price is falling towards the support level whch i anoverlap support that is slighly below the 61.8%Fibonacci retraecment and could bounce from this level to our takeprofit.
Entry: 37.24
Why we like it:
There is an overlap support that is slightly below the 61.8% Fibonacci retracement.
Stop loss: 36.28
Why we like it:
There is a swing low support that aligns with the 161.8% Fibonacci extension.
Take profit: 39.05
Why we like it:
There is a pullback resistance.
Enjoying your TradingView experience? Review us!
Please be advised that the information presented on TradingView is provided to Vantage (‘Vantage Global Limited’, ‘we’) by a third-party provider (‘Everest Fortune Group’). Please be reminded that you are solely responsible for the trading decisions on your account. There is a very high degree of risk involved in trading. Any information and/or content is intended entirely for research, educational and informational purposes only and does not constitute investment or consultation advice or investment strategy. The information is not tailored to the investment needs of any specific person and therefore does not involve a consideration of any of the investment objectives, financial situation or needs of any viewer that may receive it. Kindly also note that past performance is not a reliable indicator of future results. Actual results may differ materially from those anticipated in forward-looking or past performance statements. We assume no liability as to the accuracy or completeness of any of the information and/or content provided herein and the Company cannot be held responsible for any omission, mistake nor for any loss or damage including without limitation to any loss of profit which may arise from reliance on any information supplied by Everest Fortune Group.
XAGUSD Analysis : Bearish Setup 2x Supply to Next Reversal Zone🔍 Market Context & Technical Overview
Silver (XAGUSD) has recently gone through a sharp corrective phase after breaking above a key structural high and retesting previous resistance. The current price action reflects a clean MMC-patterned behavior, including volume absorption, QFL trap, and interaction with a descending trendline that has now become critical for further directional bias.
🧠 Key Observations Based on MMC Principles
🔵 1. Volume Absorption at the Triangle Breakout
After a prolonged consolidation phase inside a triangle pattern, volume absorption took place—indicating hidden accumulation.
A breakout above the structure was confirmed with momentum (also breaking a previously established “High Breaked” level).
This breakout led to a vertical move towards the 2x Channel Supply Interchange Zone, where price reversed sharply.
🟥 2. Supply Interchange Zone (2x Confirmed)
Price encountered resistance at the green supply block, which acted as a 2x supply zone—a critical confluence where previous sellers re-engaged.
This area had previously served as the channel boundary, creating a supply interchange effect.
⚠️ 3. QFL Zone Trap (Fake Momentum)
The price printed a QFL structure, where it created a flat base, faked a move up, and quickly reversed.
The QFL base acted as a trap for late buyers, which aligned with the start of a bearish phase that is still ongoing.
📉 4. Downtrend & Trendline Respect
Price has respected a strong descending trendline since the reversal at supply.
Each retest has resulted in a lower high, confirming the bearish structure is intact for now.
Currently, the price is trading below this trendline, reinforcing short-term bearish sentiment.
📦 Key Levels to Watch
Zone/Level Type Role
38.70 – 39.20 2x Supply Zone Strong resistance, reversal origin
37.40 – 37.60 Minor Level Short-term support turned resistance
36.00 – 35.40 Next Reversal Zone ✅ High-probability long area, MMC expects reaction
Trendline Dynamic Structure control, needs break for bullish shift
🔁 Scenarios Based on Structure
📈 Scenario 1: Bullish Reversal from Green Demand Block
Price is approaching the next MMC reversal zone (green box below 36.00).
MMC logic suggests a 100% probability of bullish reaction based on:
Volume cycle completion
Downward exhaustion
Proximity to previous institutional accumulation zones
Expected move: bounce toward trendline retest and minor resistance at ~37.50.
📉 Scenario 2: Break Below Green Zone = Panic Sell
If the green zone fails to hold:
A panic drop toward 34.80–35.00 is possible.
However, based on MMC mapping, this is less likely without a major macro catalyst.
💡 Strategic Thoughts (MMC Traders’ Lens)
We’re observing a classic MMC Phase 3 correction following Phase 2 expansion.
The current cycle favors reaccumulation, especially if a wick or engulfing candle forms inside the green zone.
Price action traders should wait for confirmation (e.g., break of trendline, bullish structure on 1H) before entering.
📌 Educational Trade Plan (Not Financial Advice)
Setup Entry Zone Stop Loss Target 1 Target 2
Reversal Long 35.80 – 36.20 35.40 37.50 38.70
Trendline Break Long Above 37.10 36.40 38.00 39.00
Bearish Continuation Below 35.40 36.10 34.80 33.90
🧾 Conclusion & Final Note
Silver is trading at a make-or-break point as it approaches a high-probability reversal zone, identified through MMC methodology. Watch the price action near 36.00 closely—it holds the key to whether we begin a new bullish phase or extend this bearish cycle.
✅ MMC traders will stay reactive, not predictive, and align with structure.
🚨 Patience is key—let the market show its hand before commitment.

Silver Remains a Buy on DipsIt seems the precious metals market didn’t mourn the Fed’s decision and subsequent press release for long.
The uptrend remains intact, and the previously supportive factors are still in play.
Even amid the negative news, there was no sharp sell-off — everything stayed within the trend. This clearly signals that rate cuts are on the horizon, and metals are likely to continue their upward move.
We only trade from the long side — nothing has changed.
At the moment, we've seen a pullback, and it feels strange not to take advantage of it and add more silver to the portfolio.
Stop-loss is set below yesterday’s candle low at 36.15.
We’ll see how the position develops. For now, the idea is to hold as long as the stop-loss holds. The long-term target is 48. Obviously, we won't reach it quickly, so I’ll trail the stop as the trade progresses — first to breakeven, and eventually into profit.

XAGUSD | Silver Rebounds from 37.50 After 39.50 RejectionSilver pulled back sharply after failing at the 39.50 resistance zone. Price is currently consolidating just above the 37.50 support area, which has held firm on the initial retest.
Support at: 37.50 / 37.00 🔽
Resistance at: 39.50 🔼
🔎 Bias:
🔼 Bullish: A clean breakout above 39.50 could resume the uptrend.
🔽 Bearish: A break below 37.50 opens room toward 37.00 and 36.00.
📛 Disclaimer: This is not financial advice. Trade at your own risk.

HI GUYShere i have a sneak peak of how i think silver has to play out.
i expect sells now, as we form the daily double bottom.
what do u think

Market Stuck in Limbo? XAGUSD Update & Likely Range AheadLet’s talk silver.
The market's clearly undecided — no real momentum, just hesitation.
We’re approaching overextended RSI levels, so don’t expect fireworks just yet.
Im Skeptic from Skeptic Lab and In this quick update, I’ll show you what I’m watching for both long and short triggers …
and why a range might dominate the next few days.
👉 Watch till the end to avoid getting trapped by fake breakouts.

XAGUSD--SHORT--02-08.25--looking at multime-frame (M,W), short term great short opportunity
--entry around 37.52854 and 37.32500, TP is 35.267

BUY AFTER THE PULLBACK Analyzing the daily time frame of silver, we can see that silver is in a bullish uptrend.
The price of silver is respecting a rising trend line which is acting as support in the past, only for some few times in the past did it exhibit a fake breakout which is indicated with an arrow.
I see the price of silver from its current price actions selling to our required point of interest and looking for buy liquidity to buy at our confluence which is both previous resistance which was broken to the upside which I indicated with a blue rectangle and a rising trend line.
Please look for buys at the previous broken resistance which is indicated with a blue rectangle in confluence with a rising trendline.
.............,...........................................
Please kindly share your thoughts on silver

SILVER: Short Trade with Entry/SL/TP
SILVER
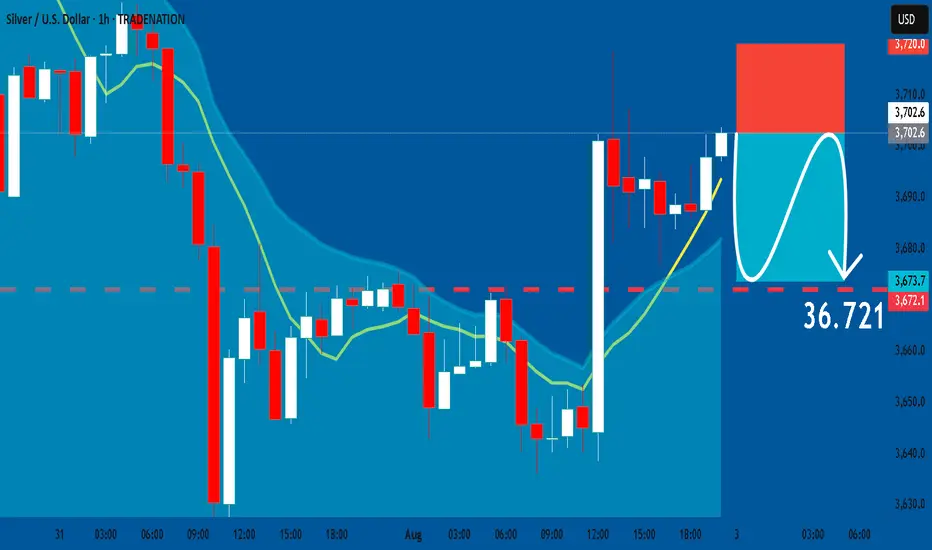
- Classic bearish formation
- Our team expects pullback
SUGGESTED TRADE:
Swing Trade
Short SILVER
Entry - 37.026
Sl - 37.200
Tp - 36.721
Our Risk - 1%
Start protection of your profits from lower levels
Disclosure: I am part of Trade Nation's Influencer program and receive a monthly fee for using their TradingView charts in my analysis.
❤️ Please, support our work with like & comment! ❤️
Silver Signals Pullback Risks From $40 BarrierFrom a fundamental standpoint, the strength seen in both tech and silver markets in 2025 may be supported by the structural integration of AI and innovation into global economic agendas. As AI and technology increasingly become the backbone of global infrastructure and development, demand is likely to remain strong.
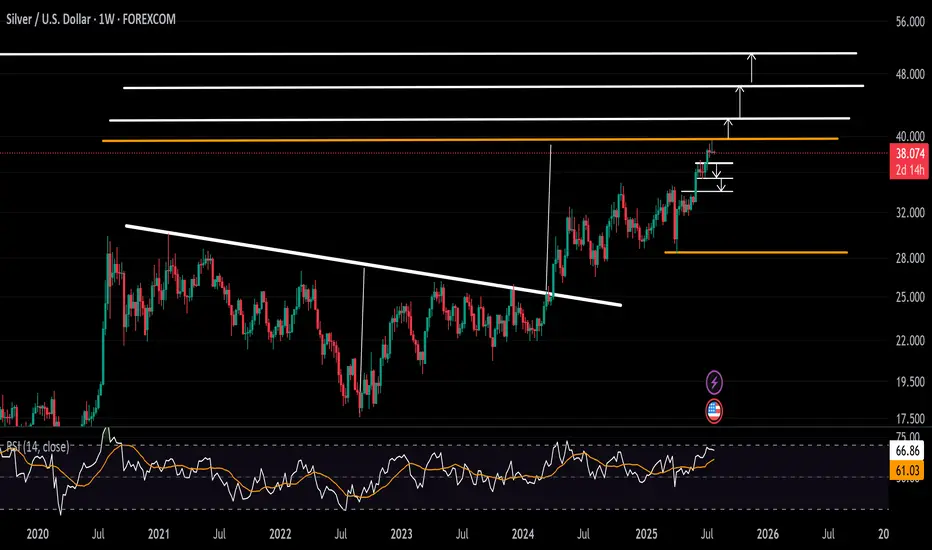
Silver is currently retreating from the $40 psychological zone, the 39.50 high, which aligns with the target of an inverted head and shoulders pattern formed between August 2020 and March 2024.
• Pullback Scenario: In line with weekly overbought momentum as per the RSI indicator, a retracement may target support levels at $37, $36.20, and $35.20 before resuming its broader bullish trend.
• Breakout Scenario: A confirmed close above $40 may open the door to $42, $46, and potentially a move beyond $50.
Written by Razan Hilal, CMT
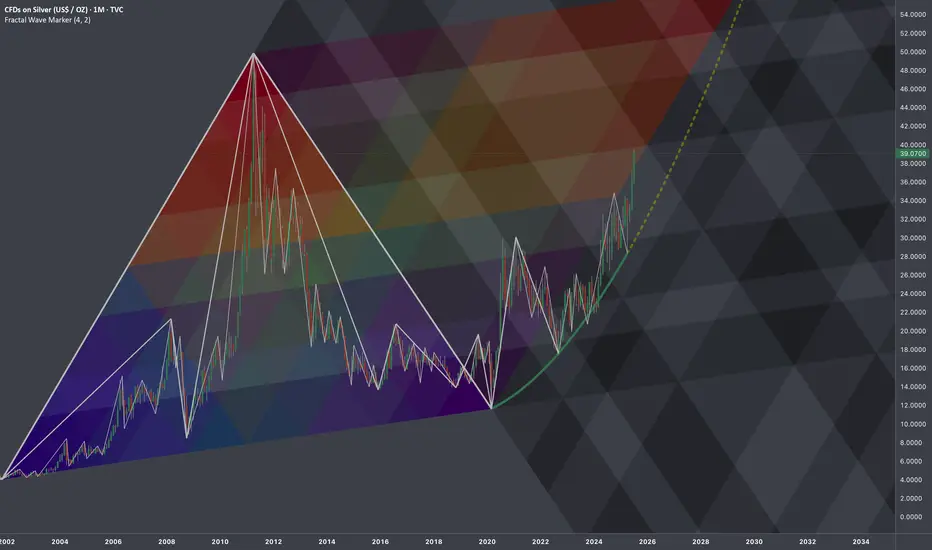
$SILVER: Fractal Geometry (Cycle 2001-2020)Research Notes
Working out probabilistic texture using multiple fibonacci channels on just 3 coordinates of fractal cycle (late 2001 - 2020) on linear scale (on log chart it would still be relevant, so you can switch to view with right click on price scale for selection).
To describe behavior of price and key levels on smaller scale starting from covid we'll use
L-H-L:
Using coordinates to express surface area of broken cycle with fibs mimicking rise, fall and side mapping cycle:
I'd look for patterns of bullish exhaustion only after price crosses the curve.
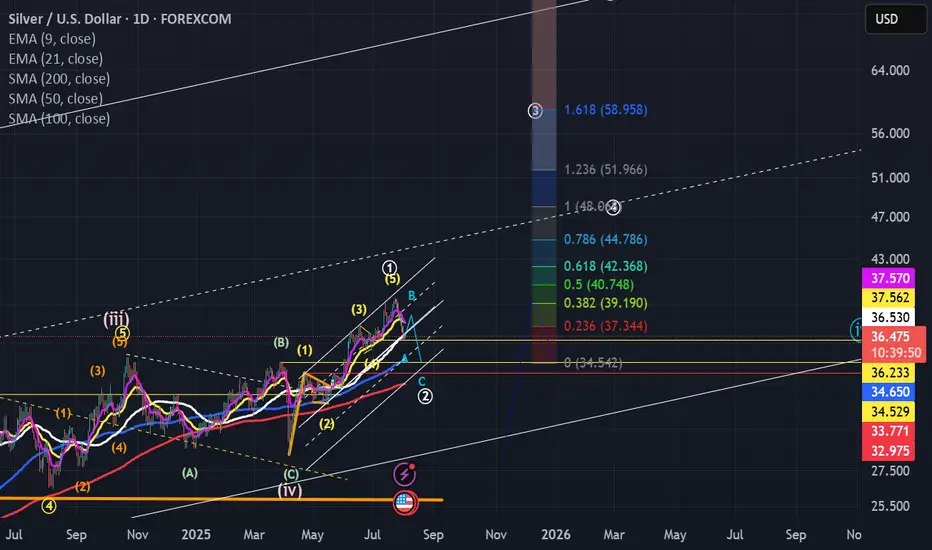
My alternate wave count for silverBelow is a slighly altered wave count for silver...it shows we have completed wave 5(yellow) which is a wave 1 (white) and are now in the process of working out wave 2 (white)...the first leg down (a) has just completed...and wave b of the ABC should start and complete over the next few days...follwed by one more low (wave c)...around the $34-$34.50 area.
I do not expect a move below $34 due to all the support on the chart at this level (look left and you will see that the $34 was a major prior resistance zone...when resistance is broken it becomes support.
If this count is the correct one (again it is my alternate to the one posted previously), it meas a bit more patience is required over the next few weeks...before we see a major move up (above $50) will start.
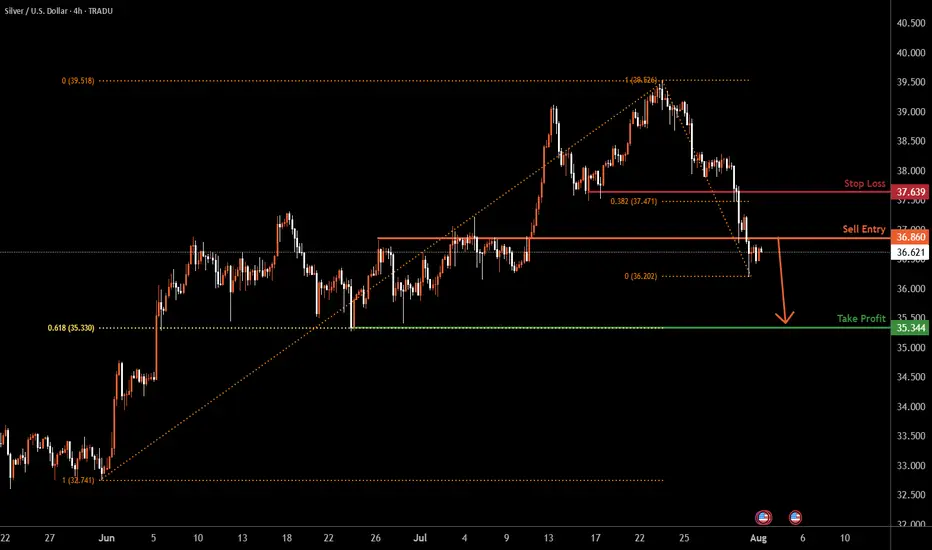
Silver H4 | Potential bearish dropBased on the H4 chart analysis, we could see the price reverse from the sell entry at 3.86, and could drop from this level to the downside.
Stop loss is at 37.63, which is a pullback resistance that is slightly above the 38.2% Fibonacci retracement.
Take profit is at 35.34, which is a swing low support that lines up with th e 61.8% Fibonacci retraecment.
High Risk Investment Warning
Trading Forex/CFDs on margin carries a high level of risk and may not be suitable for all investors. Leverage can work against you.
Stratos Markets Limited (tradu.com ):
CFDs are complex instruments and come with a high risk of losing money rapidly due to leverage. 65% of retail investor accounts lose money when trading CFDs with this provider. You should consider whether you understand how CFDs work and whether you can afford to take the high risk of losing your money.
Stratos Europe Ltd (tradu.com ):
CFDs are complex instruments and come with a high risk of losing money rapidly due to leverage. 66% of retail investor accounts lose money when trading CFDs with this provider. You should consider whether you understand how CFDs work and whether you can afford to take the high risk of losing your money.
Stratos Global LLC (tradu.com ):
Losses can exceed deposits.
Please be advised that the information presented on TradingView is provided to Tradu (‘Company’, ‘we’) by a third-party provider (‘TFA Global Pte Ltd’). Please be reminded that you are solely responsible for the trading decisions on your account. There is a very high degree of risk involved in trading. Any information and/or content is intended entirely for research, educational and informational purposes only and does not constitute investment or consultation advice or investment strategy. The information is not tailored to the investment needs of any specific person and therefore does not involve a consideration of any of the investment objectives, financial situation or needs of any viewer that may receive it. Kindly also note that past performance is not a reliable indicator of future results. Actual results may differ materially from those anticipated in forward-looking or past performance statements. We assume no liability as to the accuracy or completeness of any of the information and/or content provided herein and the Company cannot be held responsible for any omission, mistake nor for any loss or damage including without limitation to any loss of profit which may arise from reliance on any information supplied by TFA Global Pte Ltd.
The speaker(s) is neither an employee, agent nor representative of Tradu and is therefore acting independently. The opinions given are their own, constitute general market commentary, and do not constitute the opinion or advice of Tradu or any form of personal or investment advice. Tradu neither endorses nor guarantees offerings of third-party speakers, nor is Tradu responsible for the content, veracity or opinions of third-party speakers, presenters or participants.
SILVER SENDS CLEAR BEARISH SIGNALS|SHORT
SILVER SIGNAL
Trade Direction: short
Entry Level: 3,820.7
Target Level: 3,794.3
Stop Loss: 3,837.9
RISK PROFILE
Risk level: medium
Suggested risk: 1%
Timeframe: 1h
Disclosure: I am part of Trade Nation's Influencer program and receive a monthly fee for using their TradingView charts in my analysis.
✅LIKE AND COMMENT MY IDEAS✅

Silver on the path of growth and developmentAs I mentioned in the previous article, silver is moving towards the desired target, which is around $40 per ounce of silver. As you can see, this three-month chart and the uptrend drawn and reproduced shows the desired price target near the top of the channel.
If there is a change and an update is needed, I will definitely check and publish it again.
Good luck.
MJ .REZAEI


Silver under pressure!Silver prices dropped sharply following a sudden plunge of over 20% in U.S. copper futures, triggered by a surprise decision from the Trump administration to cancel import tariffs on refined copper. This move caused turmoil in the markets and impacted related assets such as silver.
From a technical perspective, silver is trading in a general downtrend on the 4-hour chart, forming lower lows and lower highs, maintaining a bearish structure.
If the price rises to the 37.034 level, it is likely to reverse downward to continue the bearish trend, targeting the 36.45 and 35.60 levels in the medium to long term.
However, if the price climbs above 37.26 and closes a 4-hour candle above that level, the bearish scenario would be invalidated, and this breakout could signal a trend reversal from bearish to bullish.

XAGUSD LONG SETUP Silver price is still in a falling wedge pattern after creating the minor Ascending wedge and couldn't breakout further, so still consolidating in the wedge, so will see to which side proce decides to break.

Silver Wave Analysis – 4 August 2025- Silver reversed from the support zone
- Likely to rise to the resistance level 39.45
Silver recently reversed from the support zone between the support level 36.20 (which also stopped wave ii at the start of July), lower daily Bollinger Band and the 38.2% Fibonacci correction of the upward impulse from May.
The upward reversal from this support zone created the daily Japanese candlesticks reversal pattern, Piercing Line – which marked the end of the earlier correction 2.
Given the clear daily uptrend, Silver can be expected to rise to the next resistance level at 39.45 (top of earlier impulse wave 1 from July).

SILVER Move Down Ahead! Sell!
Hello,Traders!
SILVER is about to retest
A horizontal resistance level
Of 37.21$ and its a strong
Key level so after the retest
We will be expecting a
Local pullback
Sell!
Comment and subscribe to help us grow!
Check out other forecasts below too!
Disclosure: I am part of Trade Nation's Influencer program and receive a monthly fee for using their TradingView charts in my analysis.

Silver Reload: Short-Term Pop or Just Noise?Our last Silver idea played out perfectly
Price wicked into support near 37.93 and bounced.
Short-term bias shifts bullish if we can reclaim 38.30, with next upside target around 38.51.
Still below the 200 MA, so we treat this as a corrective move, not a full trend shift (yet).

Silver seems Bearish here...Lookinf at the fact that the asending flag has been broken... I think is BEarish...
