Silver H1 | Heading Into 61.8% Fibonacci ResistanceBased on the H1 chart analysis, we could see the price rise to the sell entry, which has an overlap resistance that aligns with the 61.8% Fibonacci retracement and could reverse from this levle to the upside.
Sell entry is at 48.35, which is an overlap resistance that aligns with the 61.8% Fibonacci retracement
Stop loss is at 49.26, whic is a multi swing high resistance.
Take profit is at 46.98, which is an overlap support.
Stratos Markets Limited (tradu.com ):
CFDs are complex instruments and come with a high risk of losing money rapidly due to leverage. 68% of retail investor accounts lose money when trading CFDs with this provider. You should consider whether you understand how CFDs work and whether you can afford to take the high risk of losing your money.
Stratos Europe Ltd (tradu.com ):
CFDs are complex instruments and come with a high risk of losing money rapidly due to leverage. 70% of retail investor accounts lose money when trading CFDs with this provider. You should consider whether you understand how CFDs work and whether you can afford to take the high risk of losing your money.
Market insights

Stop!Loss|Market View: SILVER🙌 Stop!Loss team welcomes you❗️
In this post, we're going to talk about the near-term outlook for SILVER ☝️
Potential trade setup:
🔔Entry level: 46.55719
💰TP: 43.77818
⛔️SL: 48.46567
"Market View" - a brief analysis of trading instruments, covering the most important aspects of the FOREX market.
👇 In the comments 👇 you can type the trading instrument you'd like to analyze, and we'll talk about it in our next posts.
💬 Description: Metals also continue to feel pressure from the USD. Mid-term sell priorities keep going, with silver still expected to see targets in the 40-42 range. The primary scenario remains a breakout of 47.48680 and a move toward these targets. An alternative scenario is manipulation near the POC (point of control) followed by a downward reversal.
Thanks for your support 🚀
Profits for all ✅
❗️ Updates on this idea can be found below 👇


SILVER XAGUSD TECHNICAL OUTLOOK
THE REJECTION OF 49.412 AND CONFIRMATION FURTHER SENT SILVER SELLOFF.
THE CURRENT BREAK OF EMA 4HR 200 AT 47.740 ANOTHER BEARISH BIAS CONFIRMATION AS DOLLAR INDEX RENEWED HOPE .
THE NEXT TECHNICAL SUPPORT FOR SILVER WILL BE 45.177$-45.200$ ZONE
FUNDAMENTAL OUTLOOK.
Silver strong combination of supply constraints, rising industrial demand, and strategic importance in multiple sectors, including military and medicine.
Silver prices have surged, driven by a 20% global supply deficit and increasing industrial consumption, especially in solar energy, electronics, and electric vehicles.
Demand for silver ETFs and investment products is strong, fueled by economic uncertainty and inflation hedging.
Supply constraints stem from limited new mining discoveries and geopolitical factors affecting production.
Military Use of Silver
Silver is valued in military tech for its exceptional electrical and thermal conductivity, corrosion resistance, and reliability in critical applications.
Uses include:
Satellite communication systems
Guidance electronics for precision munitions
Radar and surveillance hardware
High-reliability circuit boards for battlefield communications
The material is crucial for secure, fail-safe military technology, with the US Department of Defense considering silver a critical material for national security.
Medical Use of Silver
Silver has potent antibacterial, antiviral, and antifungal properties, widely used in:
Wound dressings and burns treatment (silver sulfadiazine creams and silver-coated bandages)
Antimicrobial coatings on medical devices to prevent infections
Treatment of skin disorders such as psoriasis, acne, and other infections
Colloidal silver formulations have some alternative medicine applications, though scientific consensus varies
Modern medicine benefits from silver’s ability to reduce infection risk and promote healing.
Summary
Silver in 2025 is a scarce, highly demanded metal fundamental to clean energy technologies, critical military electronics, and advanced medical treatments. Its unique properties make it indispensable for national security and healthcare, underpinning its strong market fundamentals and price momentum.
#SILVER #XAGUSD

Silver (XAGUSD): Possible buy setupSilver (XAGUSD): Possible buy setup. Plan is clear. I think this is SMT and there will be a huge amount of liquidity here. Let's see if I am right.
Cheers

Silver (XAGUSD): Possible buy setup, refinedSilver (XAGUSD): Possible buy setup, refined. Price took more liquidity before going bullish.
Cheers

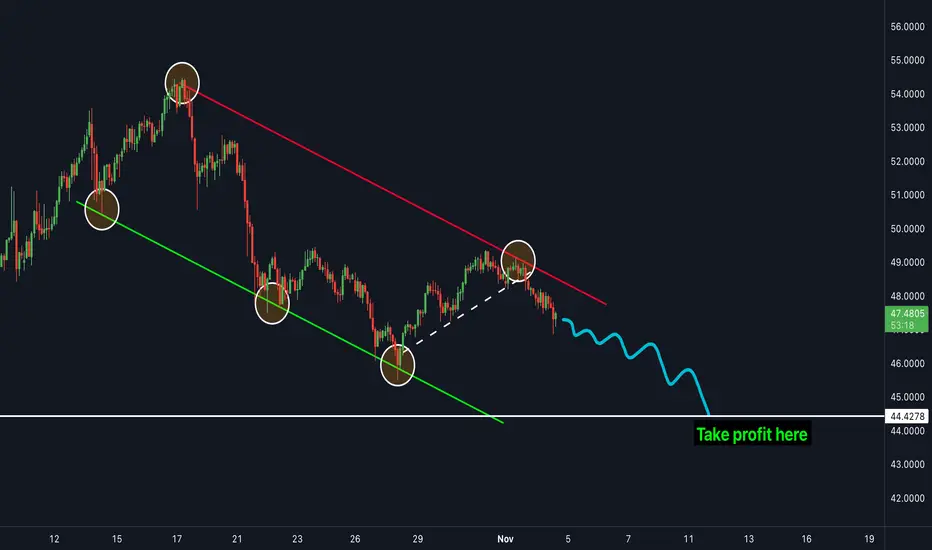
SILVER is ready to drop more - SELL NOW!Silver has been in a clear downtrend for the last few weeks and has struggled to move to the upside. The price is currently in between a bearish channel and is bouncing in-between both resistance and support zones. The price broke the most recent trendline (shown in white) which acted as a support zone. The next target is the white line shown on the chart as "take profit". This is the next major support zone which the price is very likely to hit next.
silver usdHI GUYS,
we are looking at combination of patterns with in a price pattern be it buy or sell

SILVER Will Go Higher! Long!
Take a look at our analysis for SILVER.
Time Frame: 1D
Current Trend: Bullish
Sentiment: Oversold (based on 7-period RSI)
Forecast: Bullish
The market is approaching a key horizontal level 4,796.6.
Considering the today's price action, probabilities will be high to see a movement to 5,274.4.
P.S
Overbought describes a period of time where there has been a significant and consistent upward move in price over a period of time without much pullback.
Like and subscribe and comment my ideas if you enjoy them!

Silver Turns Bearish Again – Watch 47.50 Support CloselyPretty similar to Gold, Silver also failed to break above resistance yesterday and started to roll back down.
A few hours ago, the price touched short-term support and is now seeing a minor rebound.
However, the structure has clearly turned bearish, with lower highs confirming momentum exhaustion.
If 47.50 support breaks, a visit to 45.50 becomes highly probable — and even a test of the psychological 45.00 level shouldn’t be ruled out.
My strategy is to sell rallies, ideally near intraday resistance, following the medium-term bearish bias.

XAGUSDXAGUSD price is in a correction phase, there is a possibility that the price will test the support level of 44$. If the price can hold above the level of 43.90, it is expected that the price will have a chance to rebound.
** Very Risky Trade
🔥Trading futures, forex, CFDs and stocks carries a risk of loss.
Please consider carefully whether such trading is suitable for you.
>>GooD Luck 😊
❤️ Like and subscribe to never miss a new idea!

XAGUSDFavorable technical indicators that signal strengthening bullish momentum. Recent chart patterns, including a breakout above key resistance levels, positive moving average alignment, and supportive momentum readings, suggest continued upside potential. These factors collectively indicate an attractive entry point within the current market structure.

Warning signs build for bullsContinued topside failures combined with an evening star pattern on the daily should have silver traders on alert for potential downside in the days ahead.
You can’t help but notice how feeble the bounce has been relative to the rout seen in October, with price consistently struggling above $49, which just happens to be the 38.2% fib retracement of the October high-low range. Five separate failures above the level were telling, perhaps explaining why we saw an eventual pullback on Monday, delivering an obvious evening star pattern on the daily that warns of downside risk. With momentum indicators turning neutral, the price signal suggests short setups may be the way to play near term.
$48.00 has seen plenty of action either side recently, making it a candidate to build a bearish setup around. Shorts could be set beneath with a stop above for protection, targeting either $46, which offered support previously, or the October 28 swing low of $45.56. In between, the 23.6% fib of the October high-low is found at $47.67. Given the price has respected other retracements, it’s a level of note. Minor support is also located 40 cents lower at $47.27. Unless you’re only interested in ultra-short-term setups, price action at these levels should be monitored rather than treated as targets for the trade.
Good luck!
DS

XAGUSD - Signal#XAGUSD - Signal
H4 - Formation of the 3rd wave + breakout of the trend line. Stop behind the high of the 2nd wave.
Entry: 48.19986
TP: 47.19755 - 46.35812 - 44.82284 - 43.16576
Stop: 49.15511

SILVER USDHI GUYS,
CORRECTION AND UPDATE ON SILVER TECHNICAL
We are bullishly moving through the SIGNAL BOX H8,H4,H6.

Long-Term Silver Analysis with 100% SensitivitySilver has shown a strong and steady upward trend with no major price drops. This reflects growing industrial demand, investor confidence, and the metal’s unique position as both a precious and industrial asset. So far, this analysis has proven to be the most accurate and successful among long-term forecasts.
Sasha charkhchian

Silver - 6-month analysis and resultsThe strength of the price movement in silver has continued to increase since the 6-month analysis was sent for it, because this price analysis was done at the stop of the price movement, and with this increase in the price of silver and all metals in the financial markets, the price will increase.
Sasha Charkhchian

Silver sideways consolidation capped at 4980Silver remains in a bullish trend, with recent price action showing signs of a corrective pullback within the broader uptrend.
Support Zone: 4737 – a key level from previous consolidation. Price is currently testing or approaching this level.
A bullish rebound from 4737 would confirm ongoing upside momentum, with potential targets at:
4980 – initial resistance
5066 – psychological and structural level
5166 – extended resistance on the longer-term chart
Bearish Scenario:
A confirmed break and daily close below 4737 would weaken the bullish outlook and suggest deeper downside risk toward:
4667 – minor support
4600 – stronger support and potential demand zone
Outlook:
Bullish bias remains intact while the silver holds above 4737. A sustained break below this level could shift momentum to the downside in the short term.
This communication is for informational purposes only and should not be viewed as any form of recommendation as to a particular course of action or as investment advice. It is not intended as an offer or solicitation for the purchase or sale of any financial instrument or as an official confirmation of any transaction. Opinions, estimates and assumptions expressed herein are made as of the date of this communication and are subject to change without notice. This communication has been prepared based upon information, including market prices, data and other information, believed to be reliable; however, Trade Nation does not warrant its completeness or accuracy. All market prices and market data contained in or attached to this communication are indicative and subject to change without notice.

Ichimoku Insight: “Run Through Clouds” Buy SignalWhen price breaks above the cloud and the lagging line (Chikou Span) confirms by staying above both price and cloud, it’s not just bullish—it’s historically strong.
✅ Price above cloud
✅ Cloud green and rising
✅ Lagging line above price and cloud
✅ Tenkan-Sen > Kijun-Sen
This setup blends momentum with confirmation. Ideal for traders who value clarity, structure, and risk awareness.
🔍 Always wait for candle close.
🛡️ Use the cloud as dynamic support.
📉 Risk management isn’t optional—it’s strategy.
#TechnicalAnalysis #Ichimoku #TradingStrategy #RiskManagement #STAeducation

XAG/USD Analysis: Price Stabilises Below the Psychological LevelXAG/USD Analysis: Price Stabilises Below the Psychological Level
October proved exceptionally volatile for the silver market — the price broke past a historical record, climbing above $50. However, after widespread profit-taking, the market reversed downward.
XAG/USD is currently influenced by several factors:
→ prospects for Federal Reserve policy;
→ the easing of trade tensions between the United States and China;
→ the potential government shutdown and related news.
As indicated by the ATR indicator, volatility is declining — suggesting that supply and demand forces may be finding a balance.
Technical Analysis of the XAG/USD Chart
The broad upward channel remains intact, though it is worth noting that its median line has shifted from acting as support to serving as resistance.
From a bullish perspective:
→ the lower boundary of the channel acts as strong support;
→ the bullish A-B-C-D structure indicates that demand is recovering.
From a bearish perspective: if the silver price continues to rise, it will face resistance at:
→ the psychological $50 mark;
→ the 21 October drop zone, where selling pressure previously dominated.
Given the above, it is reasonable to assume that:
→ in the near term, the price may consolidate around the QL line;
→ if bearish momentum resumes, the alternative downward channel (shown in red) will gain relevance.
This article represents the opinion of the Companies operating under the FXOpen brand only. It is not to be construed as an offer, solicitation, or recommendation with respect to products and services provided by the Companies operating under the FXOpen brand, nor is it to be considered financial advice.

XAGUSD - Silver BUY CAPITALCOM:SILVER
Previously, Silver had a huge selloff, but on October 28, price on Daily timeframe tapped into 50 EMA, created a doji candle and failed to make LL to support continuing sell bias
Price on 1H, 4H, and Daily timeframe are all trading above EMA50
4H making HH-HL and recently broke above major resistance at 48.6, where bearish momentum appeared to sit at.
After breaking above said resistance, price came up and created a HH, then came down to retest the same resistance thats now reacting as support.
While doing so, price came down and tapped into the 50% Fib area, which was also where the previous HH was at, and price then created a strong bullish candle on 4H rejecting that same level.
Scaling down to 1H we can see the 1H candle that closed above a minor pullback LH structure and is also where the 4H closed at. I consider that 1H candle my entry and targeting either -62% Fib or another major resistance at 52.338 .

XAGUSDThe 49-49.5 level seems to be a very strong resistance for silver... After the structure changes from bullish to bearish, clear targets are available in the picture.

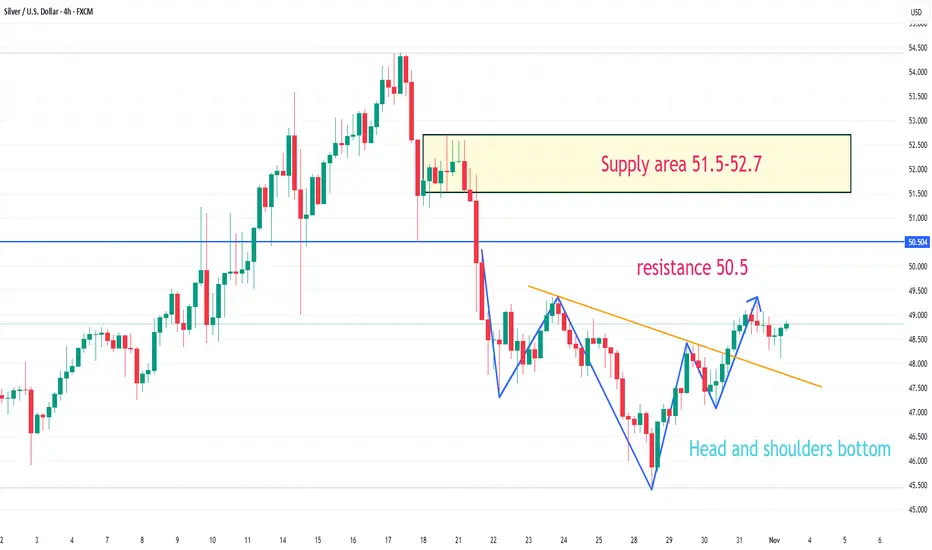
XAGUSD has formed a head and shoulders bottom patternOn the 4-hour chart, XAGUSD has formed a head and shoulders bottom pattern. Currently, watch for resistance around 49.4; a break above this level could lead to further upward movement, with resistance around 50.5, and further upside potential in the 51.5-52.7 area after that.