Market insights
Silver Potential Bullish ContinuationAfter a considerable retracement, Silver price still seems to exhibit signs of overall potential Bullish momentum as the price action may form a credible Higher Low with multiple confluences through key Fibonacci Levels, Higher timeframe Harmonic Projections and Support levels which presents us with a potential long opportunity.
Trade Plan:
Timeframe : 1D
Entry : 61.204
Stop Loss : 55.64
TP 1 : 66.768
TP 2 : 72.315

XAGUSD H1 | Bullish Bounce Off Overlap SupportMomentum: Bullish
Price is currently above the ichimoku cloud.
Buy entry: 61.439
- Overlap support
- 61.8% Fib retracement
- 161.8% Fib extension
Stop Loss: 59.974
- Swing low support
Take Profit: 63.815
- Pullback resistance
High Risk Investment Warning
Stratos Markets Limited (tradu.com/uk ), Stratos Europe Ltd (tradu.com/eu ):
CFDs are complex instruments and come with a high risk of losing money rapidly due to leverage. 70% of retail investor accounts lose money when trading CFDs with this provider. You should consider whether you understand how CFDs work and whether you can afford to take the high risk of losing your money.
Stratos Global LLC (tradu.com/en ): Losses can exceed deposits.
Please be advised that the information presented on TradingView is provided to Tradu (‘Company’, ‘we’) by a third-party provider (‘TFA Global Pte Ltd’). Please be reminded that you are solely responsible for the trading decisions on your account. Any information and/or content is intended entirely for research, educational and informational purposes only and does not constitute investment or consultation advice or investment strategy. The information is not tailored to the investment needs of any specific person and therefore does not involve a consideration of any of the investment objectives, financial situation or needs of any viewer that may receive it. Past performance is not a reliable indicator of future results. Actual results may differ materially from those anticipated in forward-looking or past performance statements. We assume no liability as to the accuracy or completeness of any of the information and/or content provided herein and the Company cannot be held responsible for any omission, mistake nor for any loss or damage including without limitation to any loss of profit which may arise from reliance on any information supplied by TFA Global Pte Ltd.

Silver Bear
Traders are trading silver like USD is collapsing tomorrow. 47923481239 bearish divergences on indicators don't matter to these traders they simply buy because of green candles like UNGA DUNGA. That big giant red candle that went straight down last Friday doesn't scare these traders apparently. That bearish divergence on the RSI doesn't scare these traders, apparently silver is just going up forever...

SILVER (XAGUSD): Another BoS
Silver did it again.
The price updated the ATH yesterday, breaking and closing above
a major horizontal resistance.
It opens a potential for more growth.
Next resistance will be 68.0
❤️Please, support my work with like, thank you!❤️
I am part of Trade Nation's Influencer program and receive a monthly fee for using their TradingView charts in my analysis.

DEC.14,2025 ANALYSIS- DXY, BTC, NAS100, SPX500, XAUUSD & XAGUSDDXY BEARISH: Weekly closing with a strong bearish candle for continuation to the downside after a small bounce to about 98.186 from the support zone of 97.820 or most likely sideways consolidation for this coming week. Ultimately, the gaps that occurred on October 5th to October 7th will be filled putting our next fall target to about 97.200 which also corresponds to the daily chart double tops target.
BITCOIN: STILL BEARISH, BTC has consolidated for the last 3 weeks and I think based on the daily double tops rejection of the fib 0.382 retrace level within the bear flag formation, this week actually gains momentum for the downtrend to resume with initial target at the liquidity zone of $80, 524 and a clear breakdown of the Bear flag trend line will put the next target around $74k zone.
NAS100 & SPX500 BEARISH: Both indices closed last week with a strong bearish engulfing candles. This confirms the retrace towards the highs is now completed and next leg down to targets of about $23,169 for Nas100 and $6,418 for SPX500 is highly probable this week.
GOLD & SILVER SIDEWAYS: Gold on the weekly chart has hit a double top with divergences on indicators like RSI and MACD. With a green closing candle on the weekly it's likely the tops of $4,381 could be tested before the pullback. Momentum is flat hence price could stays sideways first before the pullback. However, the daily chart is giving us a rejection candle from the previous high so I think a double tops could form unless a clear breakout occurs. Silver is in a last wave and also ending so there is not much reward for the risk. My up target is about $68.38 before the major pullback. There are already divergences on the both daily and weekly chart but these divergences are not confirmed until next week's candle print.
I hope my publications are helpful to your own analysis and perspective. Thank you and please show your support for these analysis with a boost or comment so it's shown to other traders and gets featured on Trading View editors desk. Have a great and profitable trading week and remember risk management is your first job as a trader. Cheers!!

Silver bullish rebound support at 6288The Silver remains in a bullish trend, with recent price action showing signs of a corrective pullback within the broader uptrend.
Support Zone: 6288 – a key level from previous consolidation. Price is currently testing or approaching this level.
A bullish rebound from 6288 would confirm ongoing upside momentum, with potential targets at:
6500 – initial resistance
6600 – psychological and structural level
6700 – extended resistance on the longer-term chart
Bearish Scenario:
A confirmed break and daily close below 6288 would weaken the bullish outlook and suggest deeper downside risk toward:
6190 – minor support
6110 – stronger support and potential demand zone
Outlook:
Bullish bias remains intact while the Silver holds above 6288. A sustained break below this level could shift momentum to the downside in the short term.
This communication is for informational purposes only and should not be viewed as any form of recommendation as to a particular course of action or as investment advice. It is not intended as an offer or solicitation for the purchase or sale of any financial instrument or as an official confirmation of any transaction. Opinions, estimates and assumptions expressed herein are made as of the date of this communication and are subject to change without notice. This communication has been prepared based upon information, including market prices, data and other information, believed to be reliable; however, Trade Nation does not warrant its completeness or accuracy. All market prices and market data contained in or attached to this communication are indicative and subject to change without notice.

SilverXAGUSD
- Completed " 12345 " Impulsive Waves and " A " Correction Waves
- RSI - Divergence
- Resistance Level
- Break of Structure
- Fibonacci Level - 100.00% / 121.70%

SILVER Set To Grow! BUY!
My dear friends,
SILVER looks like it will make a good move, and here are the details:
The market is trading on 61.986 pivot level.
Bias - Bullish
Technical Indicators: Supper Trend generates a clear long signal while Pivot Point HL is currently determining the overall Bullish trend of the market.
Goal - 62.997
Recommended Stop Loss - 61.372
About Used Indicators:
Pivot points are a great way to identify areas of support and resistance, but they work best when combined with other kinds of technical analysis
Disclosure: I am part of Trade Nation's Influencer program and receive a monthly fee for using their TradingView charts in my analysis.
———————————
WISH YOU ALL LUCK

Silver breakout against GoldMeasured in gold, silver is historically in the gutter.
The breakout barely even started based on the consolidation at the bottom.
I'm betting on a face ripping rally in 2026.

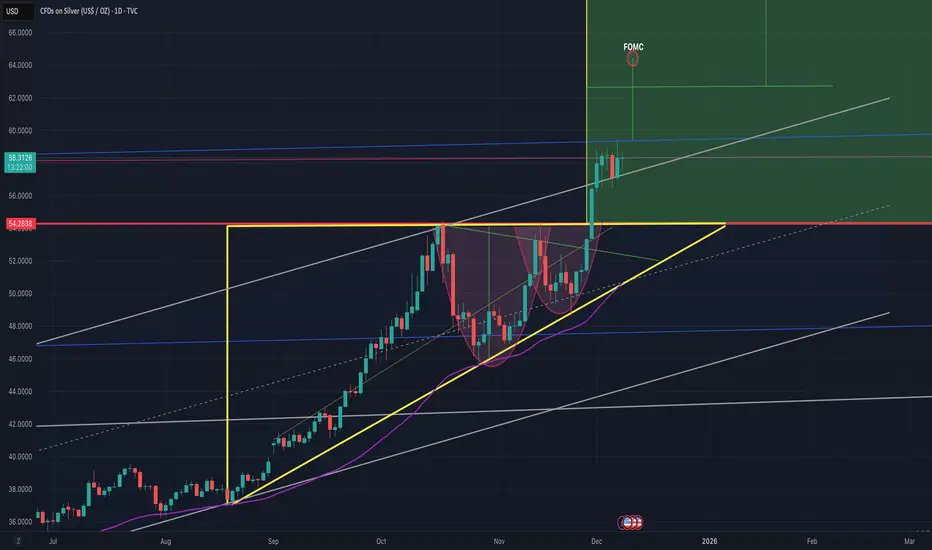
Fed Sparks a New Metals Rally: Can Hold Their Momentum?The latest Federal Reserve meeting injected fresh energy into precious metals, pushing gold higher and driving silver decisively above the $60 level.
The catalyst was the Fed’s unexpectedly dovish tone, signaling that inflation is easing faster than anticipated and that rate cuts may arrive sooner or at a steeper pace than previously projected.
Lower interest rates typically weaken the U.S. dollar and reduce bond yields—both of which create ideal conditions for commodities, especially gold and silver, to rally.
Silver outperformed dramatically, boosted by:
Strong industrial demand (EVs, solar, electronics)
A weaker dollar environment
Short-covering after breaking multi-year resistance
Investors rotating from overbought crypto and equities into hard assets
Gold is now approaching its all-time highs, while silver’s breakout above $60 marks one of its strongest moves in over a decade.
Key levels to watch:
Gold support: $3,900 – $4,000
Gold resistance: $4400
Silver support: $55 – $58
Silver resistance: $65 (major psychological level)
If the Fed confirms further easing in its next statements, the metals market may enter a new phase of structural bullish momentum. However, any hotter-than-expected inflation data could trigger a short-term correction.

Silver's Rally Is About To ExhaustSilver has outperformed gold with a huge margin this year
On the 4-hour chart the price perfectly fits into the blue uptrend channel
The 5-wave sequence is almost complete with the following signs of soon trend exhaustion:
1) triangle in the trend usually makes for wave 4 of 5 of (5)
2) price approaches the top of the channel for the third time already
3) RSI "doesn't buy" the current rally showing lower readings at Bearish Divergence
The strong support is located at the bottom of wave 4 at $56.4

68-70 Near About & Eventually 94-9868-70 Near About & Eventually 94-98 #Silver.
Mind - Ascend won't be vertical.

What has caused silver to grow faster than gold?Considering the fluctuations of silver and the price movement model and the silver chart, it is reporting a price movement towards a price target in the range of $87 per ounce!
What seems to be the main question is why the price of silver is moving faster than gold and why does silver need to fill its price growth gap with gold at this time??!!
The link below is the path to past silver analysis:

SILVER - $700 Target (1,000% Gain) - Dacades-Long H&D Pattern Simple, classic chart pattern, the recommended target for such a pattern rewards us with a 1,000% gain. How wonderful. Good luck out there, and watch out for INFLATION!!!

Silver approaching a 0.618 fib line weekly chartDec 13 2025
I decided to have a look at Silver again using Fibs, so I made a retracement in the 2008 to 2011 price gain, and using prior analysis from Feb 25 2025 determined that the price and pattern on the Feb 25 analysis is around a 0.236 fib line, so if allis somewhat equal, and the fib is a little correct we may be approaching an area of consolidation in the Dec 13 2025 fib at line 0.618. Ultimately price would be what ever it is but may top out in $100 per ounce range, may be a good time to buy dips? or visit a silver etf?

Silver: pause in motionAfter its recent rally, XAGUSD has shifted into a calmer phase. The wave structure points to the formation of a corrective movement, where upward impulses are followed by pullbacks, creating a balance between buyers and sellers.
The chart shows that the price is holding within the mid-range, while attempts at growth face resistance. Downward fluctuations do not yet appear to be a full-fledged reversal, but rather reflect the market’s desire to adjust previous impulses.
The fundamental backdrop remains mixed: interest in safe-haven assets supports silver, while expectations of dovish U.S. policy and fluctuations in commodity demand create conditions for a temporary pause in growth.
As a result, XAGUSD is showing neutral movement with a corrective bias, where further development will depend on the market’s ability to stay within the current range and find new drivers.

XAGUSD Analysis - Strong Sell-Off & Bullish Reversal Is Loading 📊 XAGUSD (Silver) – 30 Minute Chart Detailed Analysis
This chart presents a 30-minute timeframe analysis of XAGUSD, highlighting a sharp bearish displacement, a key reaction zone, and the potential for a short-term bullish reversal if confirmation appears.
🔍 Market Structure Overview
Price was previously in a clear bullish structure, forming higher highs and higher lows.
After topping near the 64.50 – 64.70 area, the market printed a strong impulsive bearish candle, breaking the prior structure decisively.
This move qualifies as a Break of Structure (BOS) to the downside, indicating aggressive sell-side participation.
📉 Impulsive Move & Liquidity Sweep
The large bearish candle suggests:
Liquidity grab above recent highs
Institutional selling pressure
The move also fulfilled a measured move (≈ 2x range expansion), often seen at temporary exhaustion points.
🟦 Reversal Zone (Key Area of Interest)
The highlighted blue box represents a demand / mitigation zone around 61.70 – 61.95.
This area aligns with:
Previous minor consolidation
Reaction after strong displacement
Potential order block / imbalance mitigation
Price is currently consolidating inside this zone, indicating hesitation and reduced momentum from sellers.
🔄 What the Market Needs (Confirmation Logic)
At this level, the market does NOT justify immediate entries. A valid trade requires confirmation, such as:
Bullish engulfing candle
Strong rejection wicks from the zone
Break and close above short-term internal highs
Change of character (CHOCH) on lower timeframes
👉 The chart explicitly notes “Need Pattern”, emphasizing patience and discipline.
📈 Bullish Scenario
If confirmation occurs:
Expect a pullback-reversal toward:
62.80
63.50
Potentially the previous high zone if momentum builds
This would be a corrective move, not yet a full trend reversal unless higher structure confirms.
📉 Bearish Scenario
If price fails to hold the reversal zone:
Continuation toward:
61.20
60.80
This would confirm sellers remain in control and the zone has failed.
🧠 Trading Psychology Insight
This setup rewards:
Patience
Confirmation-based entries
Risk management over prediction
The market has already moved aggressively — the edge lies in waiting, not chasing.

XAG/USD: Price at the Upper Boundary of an Ascending ChannelAnalyzing the XAG/USD chart, we can identify a well-defined ascending channel that contains the broader uptrend originating in early September.
Within this structure, several important technical observations stand out:
The median line of the channel acted as dynamic support and triggered a bullish reaction on December 4.
The line that divides the upper half of the channel into quarters has demonstrated a clear role reversal: it served as resistance earlier in the month and later turned into support around December 10.
The current silver price is trading near the upper boundary of the channel, which may function as a significant resistance level — similar to what was observed in mid-October.
Given these factors, it is reasonable to assume that the market may be extremely overheated, increasing vulnerability to a corrective move. If this scenario unfolds, a bearish break of the steep ascending trajectory cannot be ruled out, especially considering that silver has rallied by approximately 30% from the November 21 low.

Silver Historical breakout into the upper channel zoneSilver has reached levels the market has not touched in more than a decade. The move is so aggressive that the price almost in one vertical impulse hit the upper boundary of the long-term ascending channel that has been in play since the 90s. This is a key zone reactions here always reveal the real balance of power.
Current structure:
Price tested the 48–50 level and failed to break it on the first attempt. Expected this is a historical supply zone where major sellers have always sat. But importantly, the market broke above the long-term mid-trend line and held. The structure is shifting into a stronger bullish phase.
Next major zone sits at 75–110. This is where the market may face its final resistance or enter a phase of massive capital rotation. Below, we have huge accumulation areas at 24–16 and 14–11, but the market is nowhere near revisiting them. The trend is too strong.
Key point:
We’re at a natural correction zone, but the broader momentum remains the strongest of this entire cycle. If silver secures a monthly close above 50, the 75+ target becomes realistic.
This entire move looks like textbook smart-money behaviour long accumulation, breakout, expansion, test of strength. The market is now deciding whether this trend becomes historic.

Silver Wave Analysis – 17 December 2025- Silver broke resistance zone
- Likely to rise to resistance level 70.00
Silver recently broke the resistance zone between the resistance levels 60.00 and 65.00 as well as the resistance trendline of the daily up channel from August.
The breakout of this resistance zone accelerated the active short-term impulse wave 3 of the intermediate impulse wave (3) from the end of November.
Given the strong daily uptrend, Silver can be expected to rise further to the next round resistance level 70.00 (target price for the completion of the active impulse wave (3)).

Silver is rocketing in no resistance zone to $95 Silver is rocketing in no resistance zone to $95.
Stackers & long term holder... enjoy.
Tell me when you make big $$$ in silver above $100, what's the first thing you'll buy or do ?

Silver Analysis
Silver is close to an important resistance, it reacted a few times and could not breakthrough but did not make lower lows too, so still market is bullish.
Stay alert on resistance line (red line) and with confirmation you can join buyers.
Stay tuned for our next updates.
