SILVER: Short Trade with Entry/SL/TP
SILVER
- Classic bearish setup
- Our team expects bearish continuation
SUGGESTED TRADE:
Swing Trade
Short SILVER
Entry Point - 34.116
Stop Loss - 34.505
Take Profit - 33.483
Our Risk - 1%
Start protection of your profits from lower levels
Disclosure: I am part of Trade Nation's Influencer program and receive a monthly fee for using their TradingView charts in my analysis.
❤️ Please, support our work with like & comment! ❤️
XAGUSDG trade ideas

Setting Support and Resistance Levels on a ChartIdentifying support and resistance levels helps pinpoint potential points of price growth or decline for an asset.
I’ve tried various methods, such as Fibonacci levels and Gann fan, but they tend to be inconsistent—sometimes they work, sometimes they don’t. In practice, marking previous highs and lows on the chart and using them as reference points has proven to be much more effective.
If the price confidently breaks through a previous peak, it strongly suggests a trend continuation. However, it’s important to understand that support and resistance levels are not impenetrable barriers but rather guidelines indicating where the price might move. These levels are useful for:
setting stop-losses,
calculating the risk-reward ratio,
providing additional confirmation for entering a position.
When the price approaches a previous high, it’s crucial to observe market reactions. Jumping into a long position expecting a breakout or shorting in anticipation of a pullback isn’t always the best approach. It’s more rational to wait, see how the price interacts with the level, and then make a trading decision.
I mark key levels retrospectively, using data from several decades if available.
Example: Silver
Let’s see how this method works with silver.
In January 1980, the price peaked at $47.97, followed by a global decline.
In May 2011, 30 years later, the price approached $47.97 again, slightly surpassing it but failing to reach $50. After that, a major downtrend began.
This example clearly demonstrates the strength of support and resistance levels—even without considering inflation. And it's not the only one.
How to Apply This Method?
Open a chart of your chosen asset on higher timeframes (1D, 1W, 1M), study historical data, and mark key high and low levels. This will help you better understand the market and make more informed trading decisions.

Ride the Silver Surge: A Strategic Long-Term Trade Opportunity! 🚀 Silver: Bullish Setup Targeting $34.86 🚀
Silver presents a strong buy opportunity with bullish momentum building both technically and fundamentally. Here’s the updated setup:
Key Levels
Entry: $30.60
🎯TP1: $32.10
🎯TP2: $34.86
🛑 Stop Loss: $28.54
Why This Trade Looks Promising
1️⃣ Trendline Support: The price has rebounded strongly off a key ascending trendline, signaling continued bullish momentum.
2️⃣ Industrial Demand: Long-term demand for Silver is fueled by clean energy initiatives, including solar panels and EV production.
3️⃣ Bullish RSI: The RSI is trending upward, confirming growing buyer strength and potential for further price gains.
4️⃣ Long-Term Setup: This trade requires patience and is more suitable for traders with larger accounts, as the stop-loss is set wider to accommodate market fluctuations.
Market Context:
Silver remains fundamentally supported by rising industrial demand, inflation hedging, and the prospect of a weaker US Dollar in the months ahead. This longer-term setup aligns with both technical and macroeconomic trends, offering significant upside potential.
⚠️ Note: Please ensure this trade aligns with your account size and risk tolerance. For smaller accounts, a tighter stop-loss or different setup might be more appropriate.

XAG USD LONG RESULTThis is the result of my long Silver trade at the beginning of the week and it traded just as planned.

SILVER Sellers In Panic! BUY!
My dear friends,
My technical analysis for SILVER is below:
The market is trading on 34.116 pivot level.
Bias - Bullish
Technical Indicators: Both Super Trend & Pivot HL indicate a highly probable Bullish continuation.
Target - 34.330
About Used Indicators:
A pivot point is a technical analysis indicator, or calculations, used to determine the overall trend of the market over different time frames.
Disclosure: I am part of Trade Nation's Influencer program and receive a monthly fee for using their TradingView charts in my analysis.
———————————
WISH YOU ALL LUCK

(XAG/USD) weekly Forcast – Double Top Breakdown & Bearish SetupThis detailed technical analysis of Silver (XAG/USD) on the daily timeframe highlights a potential bearish reversal forming through a Double Top pattern. This setup suggests that Silver could be gearing up for a major decline, provided key confirmation levels are met. Let’s break it down thoroughly.
📌 1. Understanding the Chart Pattern – Double Top Formation
A Double Top is a bearish reversal pattern that forms after an extended uptrend, signaling that buyers are losing strength and sellers are taking control.
🔹 Key Phases of the Double Top:
1️⃣ First Top (Top 1)
Silver initially rallied to a major resistance zone ($34.5 - $35).
The price failed to break higher, leading to a correction.
This rejection signals heavy selling pressure at this level.
2️⃣ Pullback to the Neckline ($28.5 - $29)
After the first peak, the price retraced to a critical support area known as the neckline.
This level acts as a decision point—either price bounces or breaks lower.
3️⃣ Second Top (Top 2) – Bull Trap?
Silver made another attempt to break through $34.5 - $35, but once again, sellers defended this level.
The failure to set a new higher high confirms weakness, forming the second peak.
This second rejection adds credibility to the Double Top pattern, increasing the likelihood of a bearish move.
4️⃣ The Crucial Neckline Test
The neckline around $28.5 - $29 is the most critical level to watch.
A clean daily close below this level would confirm the breakdown and trigger a strong bearish trend.
📍 2. Key Technical Levels & Market Structure
🔴 Resistance Level ($34.5 - $35) – Strong Selling Zone
This area has repeatedly rejected price advances, indicating high supply.
A breakout above this level would invalidate the bearish setup.
🔵 Support & Neckline ($28.5 - $29) – The Make-or-Break Zone
A break below this level would complete the Double Top pattern and confirm the bearish trend.
If buyers defend this area, Silver could see short-term consolidation before another breakout attempt.
🎯 Target Price ($22 - $23) – Where Silver Could Be Headed
The measured move (distance from top to neckline) suggests a potential drop to $22 - $23.
This aligns with historical support zones, making it a reasonable target.
🚨 Stop Loss Area ($35.2 - $35.5) – Risk Management
If Silver invalidates the pattern and closes above $35.2 - $35.5, the bearish setup is no longer valid.
Traders should cut losses early if price regains bullish momentum.
📊 3. Trading Setup & Execution Plan
🔻 Bearish Trading Plan (Short Entry):
✅ Entry Point:
Enter a short position after a confirmed neckline break below $28.5 - $29.
Wait for a break-and-retest of this level to confirm the bearish move.
✅ Stop Loss:
Place stop loss above $35.2 - $35.5, just beyond the resistance level.
This protects against false breakouts and sudden bullish reversals.
✅ Take Profit Targets:
Primary target: $24.5 - $25 (first support zone).
Final target: $22 - $23 (measured move completion).
📉 4. Market Sentiment & Technical Outlook
📌 Why This Setup is Important:
The Double Top pattern is a well-established bearish signal.
Price failed to create a new high, showing that buying momentum is fading.
The neckline breakdown will confirm that sellers are in control, pushing price lower.
📌 What Could Invalidate This Setup?
If Silver breaks and closes above $35.5, it would signal that bulls have regained strength.
A strong rally above this level could send Silver towards $37 - $38 instead.
🔎 Final Thoughts – Will Silver Collapse or Hold?
The chart suggests a bearish bias, but confirmation is key!
A breakdown below $28.5 - $29 would activate the Double Top pattern, leading to a potential drop.
If Silver bounces off the neckline, then we might see consolidation or a reversal instead.
🚀 What’s your view? Will Silver break down or bounce back? Share your thoughts below! 🚀

$53 target by June (Silver quarterly)$53 by April/May/June quite easily achievable. But $53 target is a long steep parabolic rise in 3 months. Correction back to $39 before launching much higher to $70 is highly possible.

Silver gains strengthThe bullish trend is gaining momentum, and further acceleration of growth is possible.
I consider it rational to continue holding long positions in the metal or, if there is no position, to take advantage of intraday weakness to enter.
A sustained drop below 33.50 will signal the cancellation of the idea.
The next target is 34.80, and beyond that, there is nothing preventing its rise to 37.35.
Overall, the targets are higher, and the metal is in an uptrend on the daily, weekly, and monthly charts. The upside is very attractive with minimal risk.

Silver, the most beautiful chart everSilver will make you money. Target $54 short term... then onward to $250 long term

Silver buy setup for next weekSeeing that several demands have been broken and reclaimed, we look to having a bullish move still in view to the daily supply.

SILVER (XAGUSD): Strong Resistance Ahead
Silver is very close to the resistance based on the last year's high.
Watching how strong is the bullish momentum, I got a feeling
that it is going to be broken.
A daily candle close above that will provide a strong bullish confirmation.
The price will keep rising to the new highs then.
❤️Please, support my work with like, thank you!❤️

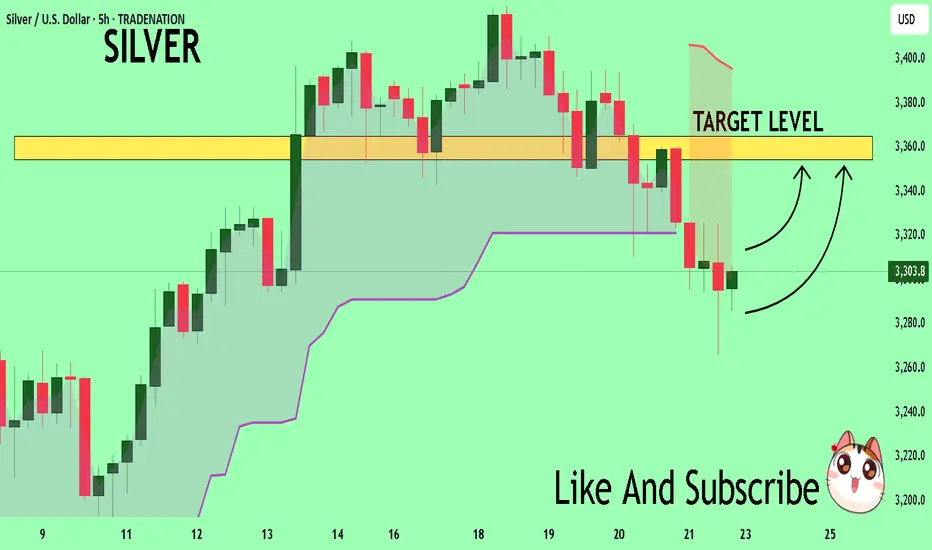
SILVER Set To Grow! BUY!
My dear subscribers,
My technical analysis for SILVER is below:
The price is coiling around a solid key level - 3303.8
Bias -Bullish
Technical Indicators: Pivot Points Low anticipates a potential price reversal.
Super trend shows a clear buy, giving a perfect indicators' convergence.
Goal - 3354.4
About Used Indicators:
By the very nature of the supertrend indicator, it offers firm support and resistance levels for traders to enter and exit trades. Additionally, it also provides signals for setting stop losses
Disclosure: I am part of Trade Nation's Influencer program and receive a monthly fee for using their TradingView charts in my analysis.
———————————
WISH YOU ALL LUCK
SILVER bullish and overbought at the new ATH SILVER bullish and overbought at the new ATH
Trend Overview:
Silver remains in a bullish trend, supported by an ongoing uptrend. However, a corrective pullback could present potential buying opportunities at key support levels.
Key Levels:
Support: 3400 (critical level), 3332, 3240
Resistance: 3440, 3488, 3555
Bullish Scenario:
A pullback to 3400 followed by a strong bounce could confirm support and drive prices towards 3440, with extended targets at 3488 and 3555 over the longer term.
Bearish Scenario:
A daily close below 3400 would invalidate the bullish outlook, signaling further downside towards 3332 and possibly 3240 in an extended correction.
Conclusion:
The bullish trend remains intact, but 3400 is the key level to watch. Holding above it supports further upside, while a break below could trigger a deeper retracement. Traders should watch for price action confirmation at support and resistance levels for trade setups.
This communication is for informational purposes only and should not be viewed as any form of recommendation as to a particular course of action or as investment advice. It is not intended as an offer or solicitation for the purchase or sale of any financial instrument or as an official confirmation of any transaction. Opinions, estimates and assumptions expressed herein are made as of the date of this communication and are subject to change without notice. This communication has been prepared based upon information, including market prices, data and other information, believed to be reliable; however, Trade Nation does not warrant its completeness or accuracy. All market prices and market data contained in or attached to this communication are indicative and subject to change without notice.

Ongoing "Ninja" bull markets for silver and the miners.Ongoing "Ninja" bull markets for silver and the miners.
Now, watch silver hold its ground against the stock markets.
Still so early.

Silver (XAG/USD) Rising Wedge – Bearish Breakdown Setup!A rising wedge is a pattern that typically forms when the price makes higher highs and higher lows, but the upward momentum starts weakening. The narrowing structure of the wedge indicates that buyers are losing strength, and a breakout to the downside is likely.
Key Characteristics of the Rising Wedge:
✔ Higher highs & higher lows – but with reduced momentum
✔ Trendline support (lower boundary) & resistance (upper boundary)
✔ Volume decline – suggests a potential reversal
Expected Scenario:
If the price breaks below the lower trendline, it signals bearish pressure, and Silver could see a strong decline.
2. Key Levels & Trading Setup
📌 Resistance Level ($34.50 - $34.80)
The upper boundary of the wedge is acting as strong resistance.
Historically, this zone has rejected price action multiple times, indicating sellers are defending this area.
📌 Support Level ($30.20 - $30.50)
A major demand zone where buyers previously stepped in.
If the wedge breaks down, this is the most likely target for the decline.
📌 Stop Loss ($34.81)
Placed just above the recent high and resistance zone to limit risk in case of an unexpected upside breakout.
📌 Target ($30.20)
Measured move from the wedge breakdown projects a sharp decline toward the next strong support at $30.20.
3. Trade Execution Strategy
🔴 Bearish Breakdown Scenario
If the price breaks below the lower trendline (around $33.00), we expect a strong move downward.
📉 Short Entry: Below $33.00 (after confirmation)
🎯 Target: $30.20
❌ Stop Loss: $34.81 (above resistance)
Confirmation Needed:
✅ Strong bearish candle close below support
✅ Increased volume during breakdown
✅ Retest of broken support turning into resistance
🟢 Bullish Alternative (Invalidation)
If price breaks and holds above $34.81, the bearish setup will be invalidated, and a breakout towards $36.00 - $37.00 could be expected.
4. Additional Considerations
📌 Fundamental Factors: Keep an eye on macroeconomic news, Fed decisions, and USD strength, as these impact Silver prices.
📌 Risk Management: Avoid overleveraging and use a proper risk-reward ratio (1:3 or higher).
📌 Market Sentiment: Watch volume trends and confirm breakout or fakeout before entering trades.
Conclusion
This chart presents a high-probability short trade setup based on the rising wedge breakdown.
If the breakdown occurs, Silver could drop toward the $30.20 support zone. However, traders should wait for confirmation before entering to avoid fakeouts.
Would you like me to refine this further for a TradingView post? 🚀

