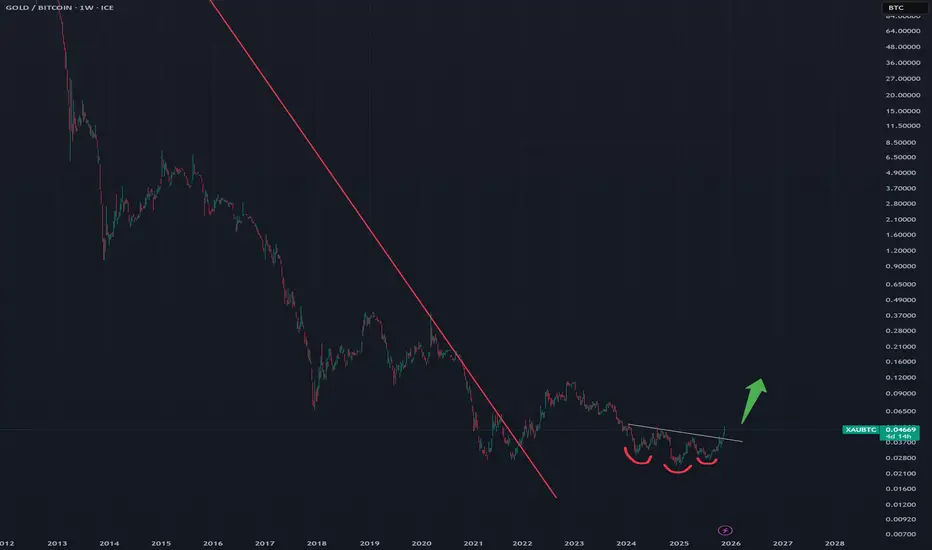
XAUBTC - Gold to Bitcoin ratio triple Bottom reversal pattern.XAUBTC - Gold to Bitcoin ratio triple Bottom reversal pattern.
After a long term decline (red line) has ended.
Sideway consolidation has given way to triple bottoming pattern and a new uptrend.
Meaning- lower BTC, Higher Gold prices going forward (relatively or in absolute terms).
Trade ideas
In the game of global trade, the referee is gold!!!What appears to be the convergence of two long-term downtrends formed by the parity of the gold to bitcoin ratio, and at this point when gold has broken its grip (thanks to the foolishness of Western governments past and present), we should see the price rise to the 1.59 range.
This is evidence that gold prices, even if they have not increased since the time of writing, are still in high demand! And gold is the best judge of the global economy!
Good luck

Gold vs Bitcoin possible reversal with double bottomTVC:XAUBTC reached mid level of long due downtrend.

Gold vs Bitcoin on a weekly basisThe very large lag of gold relative to Bitcoin, very good floor formation and good support and positive divergence all indicate that gold will grow in the future relative to Bitcoin, which in itself can indicate many issues. Because gold is considered a safe and low-risk asset, and in contrast to Bitcoin and other digital currencies, they are classified as high-risk assets. As a result, you may see more wars in the future because what is clear in the picture is that money and capital are leaving Bitcoin and entering gold.

The gold Bitcoin ratio XAUBTCthere are only two volatile assets - Gold and Bitcoin - one falling the other rising and vice versa.
Bitcoin is going down to 60k in 2 years while gold is going to say 7k
what do you see with the new 3 month green candle on the XAUBTC chart?
red is Bitcoin when rising while the green is gold now rising
Bitcoin peaked in July 2025 against gold.
we ve never had a gold btc 3 month candle in favor of gold for years like never
last one ended in jan 2023
april 2022 to jan 2023
gold may have been falling but all assets esp BTC fell worse than gold
so green 3 month candle on the XAUBTC denotes a fall is around the corner and gold will hold more than others or a super rise of gold while other assets go in a straight line.
Now this is going to get really ugly when we have a green 6 monthly candle
jan 2026 is the next 6 month candle on the XAUBTC

TradeCityPro | Bitcoin Daily Analysis #200👋 Welcome to the 200th Daily Bitcoin Analysis!
To celebrate this milestone, today’s analysis will be different, our main focus will be on the XAUBTC chart, but first, let’s analyze gold and Bitcoin separately before combining the two.
✅ Gold
📅 Monthly Timeframe
Gold is in a completely bullish trend on the monthly chart and, in its latest candle, has set a new all-time high (ATH) at $4,380.
💥 The momentum of this wave, which started from $1,980, is extremely strong — not only has the RSI entered the Overbought zone, but it has also broken through the Overextended level at 85.55 and now stands at 92.
💫 The last time gold’s RSI was in this range was in 1973, about 50 years ago, making this the strongest momentum in half a century.
🔍 Considering that gold has risen more than 100% without any major correction and has reached the 1.5 Fibonacci level, the probability of a correction is very high.
✨ If the price continues to rise sharply in the next few candles, the trend will become unsustainable, since there has been no major profit-taking — a warning sign for the continuation of the rally.
📊 In case of a correction, the main Fibonacci support levels are $3,500 and $3,000, which are potential targets if the retracement begins.
👀 If this happens, two possible scenarios emerge:
🏦 Increased gold supply, which is unlikely due to its scarcity.
Profit-taking by institutional “whales” (such as government treasuries), which is a much more probable reason for a correction.
💵 Bitcoin
📅 Weekly Timeframe
Bitcoin is in a bullish trend on the weekly timeframe, having completed seven upward waves, with the last peak recorded at $124,000.
✨ This top was a fake breakout, followed by a correction candle, and the price is now moving toward the $100,000 region.
🔽 A strong triple-top bearish divergence is visible on the RSI, with confirmation coming if 44.53 is broken.
📉 If confirmed, Bitcoin could enter a long-term corrective phase, with possible downside targets near $70,000.
🧩 However, the trend is still bullish as long as no lower high and lower low form below $100,000.
💡 This means Bitcoin could potentially make one more upward leg, forming a rare nine-wave pattern — uncommon, but possible.
⭐ Given that gold is likely entering a correction phase, the profits taken by gold whales could flow into crypto, potentially fueling Bitcoin’s next upward wave.
👑 Bitcoin Dominance (BTC.D)
📅 Weekly Timeframe
Bitcoin dominance has been in an uptrend, reaching 65.84%, but weakness in the trend and rejection from that level triggered a deep correction.
💫 After breaking 60.64, it fell to 57%, where it has since bounced.
📉 If dominance forms a lower high below 60.64 (or even below 65.84) and then breaks 57%, that would confirm a downtrend.
✔️ In that case, the dominance targets are 55.26, 51.06, and potentially 47.76.
🚀 This scenario suggests that if money flows from gold into Bitcoin, it may later flow into altcoins as dominance declines — setting the stage for a possible altcoin season.
🔑 XAUBTC Chart
🧮 This chart represents gold’s strength relative to Bitcoin.
As seen, its overall structure in recent years has been bearish, reflecting stronger investment interest in Bitcoin compared to gold.
📊 The trend remained bearish until early 2025, showing no weakness — until recently.
🔺 After finding support near 0.027, the trend has shown clear signs of weakening, and price action now hints at potential bullish reversal signals.
☘️ The price has already formed a higher low, and if it consolidates above 0.03922 next week, we’ll have the first confirmation of a trend reversal.
📈 The main bullish confirmation would come after breaking 0.04543.
⚡️ However, one possible scenario is that gold enters a correction phase while Bitcoin completes its final bullish wave.
✅ Since this chart faces two strong resistance zones, rejection from 0.03922 or 0.04543 could send it back toward 0.027, implying a gold correction and a final bullish leg for Bitcoin.
💥 Considering Bitcoin dominance may also drop, it’s likely that capital will first move from gold into Bitcoin, and then, as dominance falls, into altcoins — potentially triggering the long-awaited altcoin season where altcoins experience explosive rallies.
⚖️ This is just one possible market scenario; other outcomes are possible.
Remember: Always conduct your own research before making any investment decisions.

btc/usdGold leads btc follows
expectation gold to bottom by end of oct , followed by finally the real btc bull market

Market will continue to eat the current bearish Order blockI had the vision from the retest of the double bottom (Wickoff reversal pattern) that Gold had the possibility to outperform Gold from now on) (+12% Past Month)
I believe that BTC has currently begun a Mark Down process after his last point of supply.
Currently holding Gold Long and BTC Short for long term.
For Scalp Play I'm about to try Gold Short and BTC Short. There's a probability that this Big Order block will be Eaten slowly with a BTC underperforming Gold in % drop.
I will be more aggressive on BTC short and and will leave some margin on Gold if it climb a bit up.(up to my SL 3839)
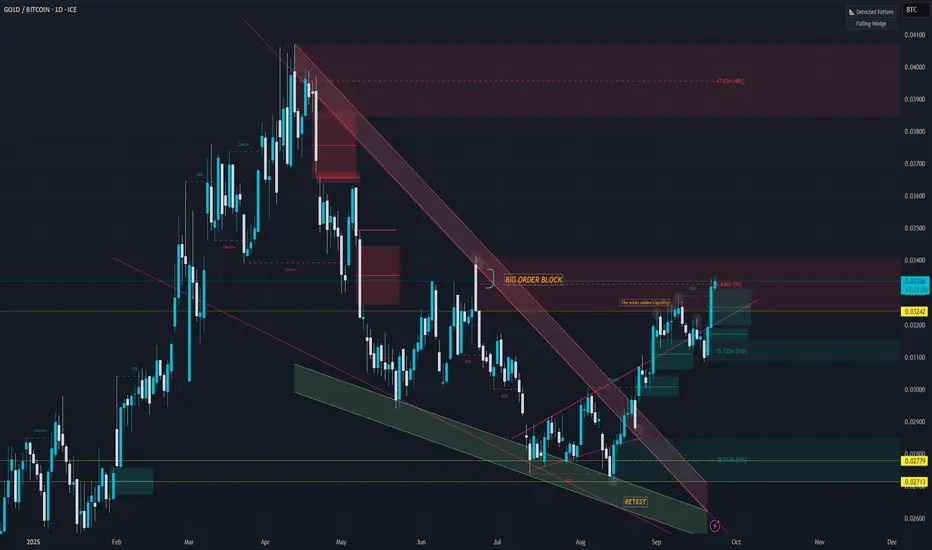
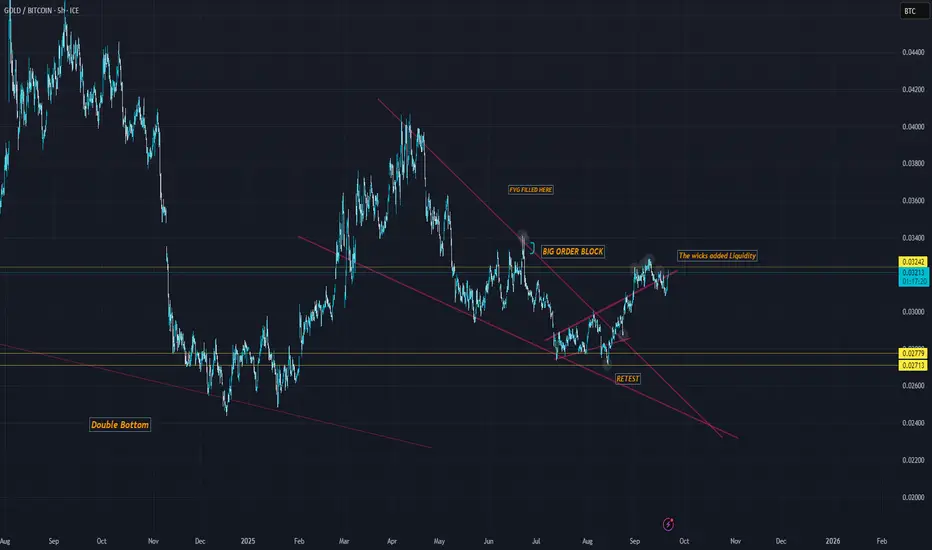
Heading North if you study XAU-BTC (TV) we have also a possible Wickoff reversal with that clean retest of the last double bottom.
When I check the cluster of liquidity on BTC we have fuel to start the Mark down.
Remember that the recent drop at 107k 98k and 74k could have strategically made to have a cost efficiency in the next market correction with those daily liquidation pool from the Long. (sell order)
Supports are 100k; 89k and 79k on BTC.
For Gold. I see liquidaiton daily level up to 4500$, I believe we can go higher.
Remember if BTC down abrutly, the chart XAU-BTC will go up if Gold keep Steady or hold better...
XAUBTC inverse-low targets#bitcoin has reached new highs, not so XAUBTC-a clear indicator for more downwards pressure.

Break on XAUBTC PredictionWe can see a break to the upside or downside in the next coming days. This will determine the outcome of BTC & Xau

Gold or Bitcoin - Which is the better hedge for 2024?Short answer: Bitcoin
By the year end Bitcoin shall enjoy stronger gains. That is despite the 2-week Gravestone DOJI candle now currently printing on Bitcoin, which makes you wonder… what heinous price action awaits gold bugs?
On the above 3-day chart a ratio of Gold/Bitcoin is shown. If this ratio is downtrending (it is), Bitcoin will be worth more than Gold with each passing week and vice versa.
A Death Cross has now printed on the above 3-day chart after broken market structure. Expect the ratio to climb to confirm past support as resistance.
The 3-day death cross is significant. Look left. The last 3-day death cross printed on March 2016 (below). Gold lost 99% of its value against Bitcoin from that time. Now I’m not saying that is going to repeat, however the point would be that a 3-day death cross is not something you ignore.
Ww
3-day Death cross March 2016
Last year (2023) and the years before the same question:
Which is the better hold for preserving ones wealth?
In 2023, it was Bitcoin.
2023 idea
In 2022, it was Gold. Idea below. Bitcoin correction throughout 2022 made Gold the only option during the bear market.
2022 Idea

XAU/BTCSo, this is a monthly chart. A very interesting chart. "BTC the gold of the future" Be very careful in the long-term...Nothing goes down forever. Just Putting it out there... Non the less... a chart to keep on close by if you are a crypto investor.

GOLDBTC or XAUBTC fall time? what does this mean for $Bitcoin?Gold is trying to break zone massive zone towards the downside against btc, this does not mean gold will fall btc will go up. This means that BTC will perform better against gold in the long run, breaking this zone lower and retesting it will confirm that.
So which one do you love the most? Gold or BTC?
Not a financial advice, do your own research.
To learn how to trade supply & demand, we teach you. contact us ASAP!

Gold VS BTCIt looks gold loose its power against BTC.Because BTC is having bull run,gold will loose against BTC. if head and shoulders pattern works, gold will go short

GOLD/BTC_ Not looking good for the short termFor the short term, BTC will outperform Gold.
What will happen next ? Maybe later, capital rotation will take place..
We'll keep monitoring the chart.
NFA.

XAU/BTC - Gold and Bitcoin outlook for next 6 months ?GOLD & BITCOIN OUTLOOK
for the ppl saying that TVC:GOLD is outperforming CRYPTOCAP:BTC
Well... not really as you can see at a relatively big timeframe on this XAU/BTC chart
what is happening now ? well XAU had a rebound mid March, making a +66% pullback, it seems a lot but as you can see during august 2020 it felt 85% !
1. made it to the previous resistance quite hardly, first sign about the bearish approach that could arrive
2. we are now around , in fact around a very hot zone, 0.4 , if we go above, more chance to see bullish moves in this chart, meaning that Gold could go more up and/or Btc could go more down, its a weekly timeframe so, im talking about a 6 months move
BUT, I think XAU/BTC will not be able to pass that resistance and will in fact go big red candles till spring
3. if you look at what happened 4 years ago just copy paste it now, you should have a view of the next 5-6 months for both assets
Not saying that gold is gonna plummet and XAU/BTC will go -85% this time but it should bring it a bit down, as in august 2020 it was also going parabolic and went -20% in 6 months
so yes im expecting gold to go -20% during the 6 next months and of course BTC to go UPPPPPP
so if they're one thing to retain here, its that Gold seems now inversely linked to the 4 years BTC cycle ! And this is quite interesting because it means that BTC has a lot more power and influence than people think
Cheers & thx for reading

$GOLD will likely overperform $BTCIn this #gold against #bitcoin chart, ( #xaubtc) TVC:GOLD has filled the gap and price ready to make a new impulsive wave against CRYPTOCAP:BTC , NOT #Dollar in short/mid term.

long gold until broken trendline or resisjust messing around ikn
long gold until broken trendline or resistance given you are bullish btc as well

Bitcoin vs GoldBtc vs xau could drop with the orange line to consolidate on the giant triangle around 0.168 fib before breaking out.

Bitcoin Priced in Gold, Seeks Full Coins and BarThe whole number effect is evident here, see orange circles.
With a commodity in price discovery mode every four years, every four years traders sell bitcoin gains for whole portions of gold.
I would say if someone hodled 1 bitcoin through a three year crypto winter, then suddenly it was worth 1kg of pure gold, they might be tempted to do the same.
This informs my extrapolations, will be interesting to watch this play out.
I've included in blue another interesting pattern, where the price on the day of the halving makes the same Fibonacci increase every halving. Obviously not many data points, but something to keep watching as we clearly head toward this very same number again this year.
And to complete the Fibonacci analysis, the clear 0.618 fib level drawdowns are indicated in green, which did not align with the current cycle, may pick back up again.


Is GOLD/BTC breaking outAre we going to see lower lows in BTC?
This Gold vs BTC chart show us that is breaking out and the only way for Gold to top BTC is for BTC to keep going lower, we have a beautiful break of the pattern so because of this and different reasons I predict that BTC may keep dropping to $58K, GETTEX:54K and maybe GETTEX:48K
