GOLD to zero vs BITCOIN
What an awesome chart (For Bitcoin maxi's that is) here this shows Gold in relation to Bitcoin....
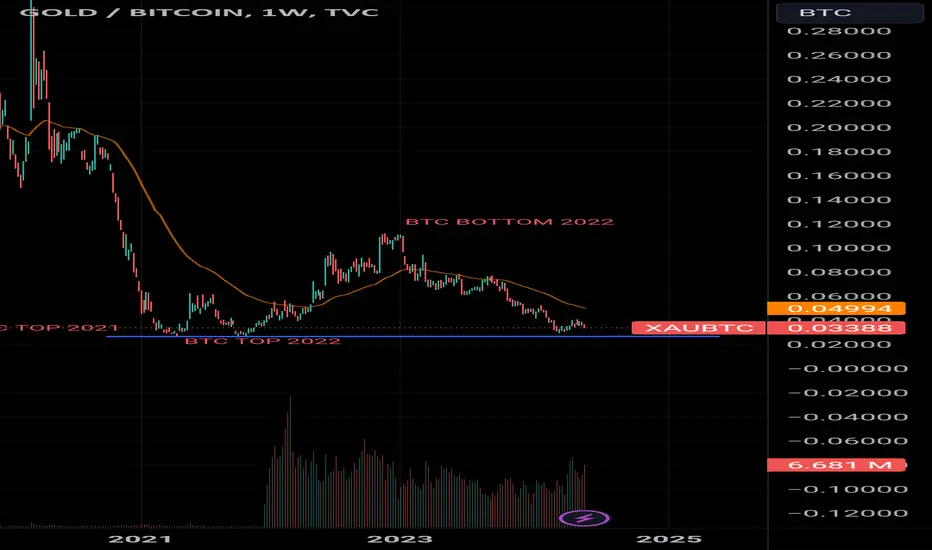
Here we can see the halvening (blue vertical lines) and the decline in gold value respective to Bitcoin, we can see an 80%+ decline each cycle.
The next halvening date is April 2024, (Red vertical line)
After the move has moved to a new low, we can see that a retracment has come in to the upside each cycle into and around the golden pocket (61.8% - 80%) .
This area has already been tagged...
another pattern is the influx of Volume regarding the start of 2023, dwarfing any other previous volume...
I shall continue to update this thread moving forwards.
Trade ideas

GOLD/BTC chartIMPORTANT TO READ
Keep an eye on the GOLD/BTC chart, which reveals the real value of these two valuable assets. You can spot the double bottom on the chart in 2021 and 2022, corresponding to the double top for BTC in those same years. This marked the beginning of a massive correction down to the 16k region. Now, we are close in reaching that region once again.
Despite Gold's parabolic rise since December 2022, it is in a big downtrend vs BTC. Watch the 0.027 BTC per ounce of Gold level, the same level that market BTC top in 2021 and 2022. The ounce level is equivalent to a BTC price of $86,444.44. This could be the worst-case top scenario (which I doubt), but it is more likely to be the region where the BTC correction will start and the region I will realize some gains.
The mentioned region is in my opinion the region in which the next BTC correction will start before continue going up to 100k region and above. This is a very long term thinking and there will be updates on this.
@DoctorProfit_CryptoIMPORTANT TO READ
Keep an eye on the GOLD/BTC chart, which reveals the real value of these two valuable assets. You can spot the double bottom on the chart in 2021 and 2022, corresponding to the double top for BTC in those same years. This marked the beginning of a massive correction down to the 16k region. Now, we are close in reaching that region once again.
Despite Gold's parabolic rise since December 2022, it is in a big downtrend vs BTC. Watch the 0.027 BTC per ounce of Gold level, the same level that market BTC top in 2021 and 2022. The ounce level is equivalent to a BTC price of $86,444.44. This could be the worst-case top scenario (which I doubt), but it is more likely to be the region where the BTC correction will start and the region I will realize some gains.
The mentioned region is in my opinion the region in which the next BTC correction will start before continue going up to 100k region and above. This is a very long term thinking and there will be updates on this.
90% of margin traders lose all their account in 90 days' due to 90% of margin traders lose all their account in 90 days' due to high leverage 1:200, 1:500, 1:1000, 1:2000 # stick to spot investing# if $1000 account - $500 in spot gold $500 in spot crypto# spot means 1;1 Leverage you own the shares and coins '# remember 90 days is 6th August account gone to zero # Think like a pensioner and just invest in spot or dealing account
1:1

When the monthly candle turns green, gold gains in value againstWhen the monthly candle turns green, gold gains in value against bitcoin.
When do you think this is due?

join me longing gold against bitcoin next 13 monthsGold is expected to gain in dominance against bitcoin in the XAUBTC ratio which shows next 13 to 16 months of gold , silver dominance against bitcoin.

XAUBTC: who cares for this pair?Gold Price to Bitcoin Price is gaining more and more strength.
Who cares, or compares these two to eachother?
If you are one those who cares, then you are a true investor.
Bitcoin has started its Asymptotic behaviour some four years ago and while bitcoin price compared to its own RSI in 6 months timeframe is implicating less strength and a prolonged overbought behaviour since 2017 onwards, everyone is not paying attention to such indicators.
Well! Some say that technical analysis is not enough. I prefer vice versa.
Gold is gaining strength.
This time I would say following 15 years of ever growing price and 3 times touching current levels, gold is finding ground to recieving more capital this time.

XAU to BTC price channelBy analyzing the price of gold to Bitcoin, we come to 2 channels of the downward curve, in which the price moves and with Examining it, we realize the value of Bitcoin to gold, which I think will reach 0.271 by next week.

GOLD vs BITCOINThis is an interesting chart to watch over the next 2-3 years
Peter Schiff vs Michael Saylor / Chart, We may say ...
Gold is facing resistance but is in a bullish zone
If we look at this chart, we can see they are very corelated in a fibonacci way

Global holdings of digital gold AKA BitcoinThey said it was only used for money laundering... How did they know that?
They now say it is like nothing else. What does this chart say to you? What will this chart say to you after the global financial systems
Germany is talking about using Bitcoin as legal tender NOW. Imagine if 1/3 of their population picked up 0.1 Bitcoin... That would be 2.7 million BTC...
My American government is not stepping forward yet(BUT they hold many, most people don't know this). Will they launder theirs through Coinbase???
Almost 20% of the blood dollar spent with lobbyists last year was on the topic of cryptocurrencies.
El Salvador is picking one up every day and they are bringing prosperity to their economy.
Multiple smart people think that we have multiple nations mining bitcoin while trying to hide it while others are turning their equipment on and using effin volcanos.
Don't forget to take the orange pill. Love you Max and Stacy! The show on RT kept me thinking of more in my 20's. You've changed my life and mind in!
Companies, countries & their populations of Bitcoin holdings. You know they are DCA buyers and will scoop up any flash sales. The price is being suppressed.
worldpopulationreview.com
buybitcoinworldwide.com
www.chainalysis.com
www.forbes.com

Gold or Bitcoin - which is the better hedge for 2023?Short answer, Bitcoin.
About the same time last year the question was asked:
“Gold or Bitcoin - which is the better hedge for 2022?”
The idea is in the link below if interested. Suffice to say, there was Strong divergence, strong buy signals with study from multiply time frames. If you held Gold instead of Bitcoin you would now be in a position to have four times as many Bitcoin today.
Am sorry to tell you gold bugs, but 2023 is most definitely not the year to be holding onto the shiny metal. Will publish the reasons elsewhere.
On the above daily chart above price action has printed a death cross but is yet to confirm. For confirmation the Gold/Bitcoin ratio needs to print the 200-day SMA as resistance. There is good evidence for this.
It is also worth paying attention to the angle of the cross at this time, it is sharp. In the past a low angle has meant both assets tend to follow each other in terms of value. July 2020 below as an example. However the picture for a sharp angle is very different. This is not unique to this asset pair, it can be found many times over many asset types.
Ww
July 2020 - low angle
May 2019 - sharp angle

Just sharing my first idea on XAUBTCI did a simple trend analysis on XAUBTC. What do you guys think?

Gold is going to outperform Bitcoin for the next yearGold in pair with Bitcoin has broken the dynamic resistance of a falling wedge and made a decent pullback which is at 61.8 fib level of the last pulse.
Gold is going to outperform BTC for at least the next 12 months in my opinion

XAU/BTC Gold/Bitcoin- Bullish trend reversal.XAU/BTC Gold/Bitcoin- Bullish trend reversal.
Suggest much higher prices for Gold in the future, relative to Gold.

9 Bitcoins for 1kg gold by 2025Gold is already outpreforming Bitcoin, no discution possible. Based on what I see, the target will be 9 Bitcoins for 1kg Gold by 2025. Hope more but this is a minimum!
The only question remains is, will Gold reach such a high price or will Bitcoin dump that low? It can only by one of the two options, face it.
I'm thinking more Gold 2025 90k and Shitcoin 10K, seems about right doesn't it?

BTC to Gold on the monthly chartJust a simple strategy I discovered while playing around with Gold and BTC, which appear to have an inverse relationship.
This is on the monthly timeframe, the idea is to follow the value at the right time.
Even though XAUBTC is on a general downtrend, the strategy is simple:
Every time the Stochastic RSI on this chart starts pointing up, that is a signal to exit BTC and enter XAU.
Every time the Stochastic RSI points down, exit XAU and enter BTC.

Convert BTC into Gold when the bear rally is overBitcoin outperformed gold in the last 13 years since its inception but this trend will stabilize and both gold and bitcoin will reach an equilibrium until hyper-bitcoinization. A good way to store wealth made from bitcoin is to put it temporarily into gold during the bull runs and during small bear rallies (as the current one from $16K btc to 35K btc), then re-buy bitcoin in time for 2025 bull run. This way you can avoid using USD or USDT at all since neither is 100% safe, neither is USDC or DAI as they are all centralized and backed by garbage fiat and empty promises.

XAUBTC DAILY CANDLE ANALYSIS XAUBTC daily candle chart looks trading in a chhannel from long time
recently its break the channel in down side but holding the last low
so here is the risk is very low and reward is much higher
one trade can must be taken there for buying side with the stop loss below recent low below 0.070
stop loss below the recent low 0.070
target can be 0.1261

Gold and Bitcoin have always been in reverse rolesbitcoin and gold have always been in reverse roles - one up they other down . In the hedge trade BTCXAU you see very red candle denoting sell bitcoin buy gold on the weekly
BTCXAU Weekly chart
more of sell bitcoin in red candles than buy gold in green candles
mann456
On the other hand the buy gold short bitcoin is another good analogy
XAUBTC
On the 1st chart you will wait awhile to buy bitcoin than gold on the 2nd chart
green is always long red is short
Those who have been following my hedge principle would be smacking the lips and wondering why Bitcoin is not given 500 leverage like gold and silver?
Big banks control gold and silver but not Bitcoin
just imagine long gold and shorting Bitcoin since August 2022 loads to gain.

BTCGOLD ascending log channel, fibBTCGOLD ascending log channel, fib levels used for resistance and support, marked 2 outliers pre-2013 and 2021 march drop.

Historical resistance brokeI dont understand that no one is talking about tis resistance that broke for the first time in history...
If you look good this means that bitcoin could get very low in the next few years, or it means that gold wil rise tremendously high. On of the two it will be.
One thing is for sure, it's the first time in bitcoin it history that this resistance broke on the weekly chart.
Very conserning if you ask me.
I let your imagination to the work how low Bitcoin actually could go if you look at this chart. NUTS!


Bulish?Gold compared to Bitcoin, 1 chart, 1 line.
Historical comparison between the two.
Putting this on my timeline, curious how this will work out.
When moon

