GOLD → Retesting resistance may lead to a breakout.FX:XAUUSD breaks the downward resistance line on the senior timeframe and tests the upper limit of the trading range amid the falling dollar and Powell's speech. The metal may continue its upward movement.
The dollar's rise was short-lived after Fed Chairman Jerome Powell hinted at an imminent interest rate cut, but not in July... The probability of a rate cut in July fell to 22%, and in September to 72%.
Markets are awaiting fresh employment data (ADP and Nonfarm Payrolls), which could influence the prospects for rate cuts. Weak reports could revive interest in gold, but for now, the asset remains under pressure due to the short-term strengthening of the dollar and uncertainty surrounding Fed policy.
Technically, if the pre-breakout structure remains intact and gold continues to attack resistance within the local range of 3347-3330 (3335), the chances of further growth will be high...
Resistance levels: 3347, 3358
Support levels: 3336, 3316, 3311
The global trend is upward, and locally, the price is also returning to growth. If the bulls can maintain the current trend, break through the resistance at 3347, and hold their ground above this level, then the next target will be 3390-3400. I do not rule out a correction to 3325, 3316 (liquidity hunt) before the growth continues.
Best regards, R. Linda!
XAUUSD trade ideas

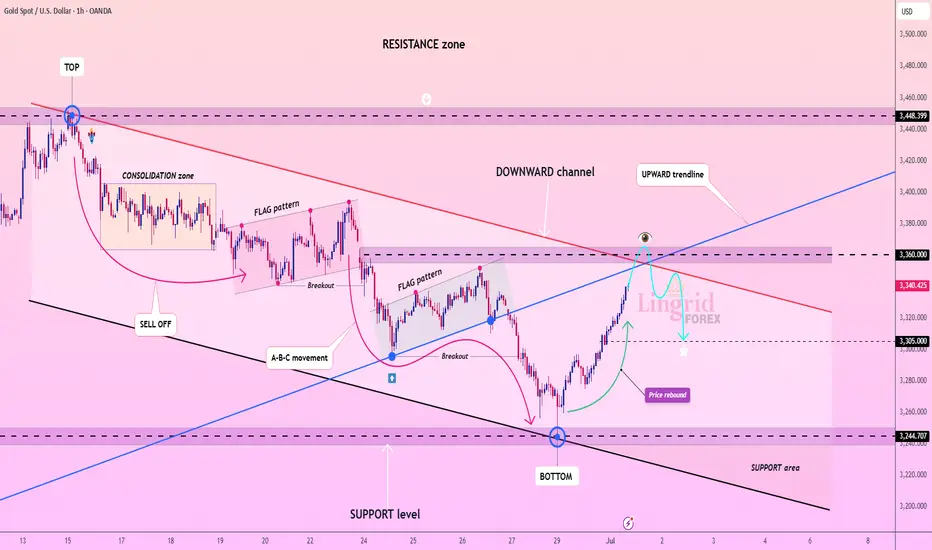
Lingrid | GOLD Shorting Opportunity at Confluence ResistanceOANDA:XAUUSD is approaching the key resistance near 3360 after rebounding from the 3245 support level and breaking out of the downward channel. Price is now testing the upward trendline from below, intersecting with the red descending trendline and horizontal resistance. If this confluence zone rejects the rally, a return toward 3305 or lower is likely, forming a potential bearish retest.
📉 Key Levels
Sell zone: 3350–3360
Buy trigger: breakout above 3360 with close above 3375
Target: 3305
Sell trigger: rejection from 3360 and break of 3340
⚠️ Risks
Break and retest of 3360 may invalidate short setup
Volatility around red trendline could trigger fakeouts
Demand near 3305 may cause sharp bounces if sellers stall
If this idea resonates with you or you have your own opinion, traders, hit the comments. I’m excited to read your thoughts!
GOLD → Recovery and retest of resistance. DowntrendFX:XAUUSD has been recovering since the start of the session thanks to a weak dollar, but further growth is uncertain. However, the price is still below the key range and important levels.
At the beginning of the week, gold rebounded from monthly lows amid a weakening US dollar, which remains under pressure due to trade disputes with Japan, uncertainty surrounding the budget, and expectations of a Fed rate cut in September.
However, the technical picture for gold remains bearish, and further dynamics will depend on new statements from Fed officials, labor market data, and Jerome Powell's speech on Tuesday.
Technically, after breaking through the global range support, the price is forming a correction and testing 3294. Before a possible rise to 3320 or to the 0.7 Fibonacci zone, a correction to 3271 may form, which will determine the further development of the situation.
Support levels: 3271, 3255, 3245
Resistance levels: 3294, 3320, 3347
A retest of 3295 (0.5) Fibonacci is forming. There is a possibility of a false breakout with a possible correction. If, during the correction, buyers keep the price above 3271 and return to retest 3294, we will have a chance to attempt growth to 3320 - 3347
Best regards, R. Linda!

GOLD: Nothing Changed, Still BearishGOLD: Nothing Changed, Still Bearish
At the moment, gold is following developments in the Middle East. The geopolitical situation seems to have improved, thus creating a short-term release of liquidity in long gold positions.
It could be a short-term gain, but there could also be a larger wave that could follow these moves. No one knows what could happen with gold movements in general.
With the current data, gold remains bearish and is still following our old scenarios.
Today, ARRI tested the 3300 structure area, showing that we have some sellers pushing the price down from that area.
If gold holds this area strong, then it could fall as shown in the chart;
Key target areas: 3262; 3247.5; 3218; 3192 and 3160
You may find more details in the chart!
Thank you and Good Luck!
PS: Please support with a like or comment if you find this analysis useful for your trading day

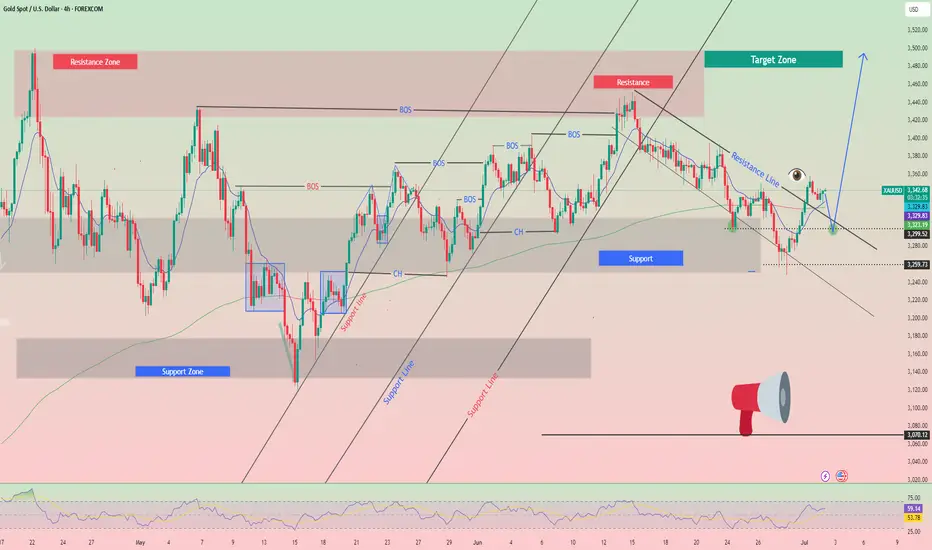
Lingrid | GOLD Weekly Analysis: Risk-Off Trade Unwinds OANDA:XAUUSD endured another challenging week as the Iran-Israel ceasefire continued to diminish safe-haven demand, while robust equity market performance drew capital away from precious metals. The risk-on environment has fundamentally shifted investor priorities, with growth assets overshadowing traditional defensive plays like gold.
The chart reveals gold testing the crucial $3,270 support zone, representing a significant confluence level where the upward trendline intersects with horizontal support. This area has historically provided strong buying interest and serves as a critical inflection point for gold's medium-term direction.
From a broader perspective, the 4H chart shows gold approaching the lower boundary of its established upward channel around $3,250. The pullback from the HH near $3,450 has accelerated through multiple support levels, with the downward trendline acting as dynamic support to any recovery attempts.
A decisive break below the $3,235 - $3,250 support confluence could trigger further selling toward the $3,200 major support zone. However, the long-term upward trendline dating back several months provides substantial technical backing. A successful defense of current levels would likely attract value buyers and could spark a relief rally toward the $3,330-$3,350 resistance area, particularly if geopolitical tensions resurface or equity markets show signs of fatigue.
If this idea resonates with you or you have your own opinion, traders, hit the comments. I’m excited to read your thoughts!

Lingrid | GOLD Pre-NFP Price Action AnalysisThe price perfectly fulfilled my last idea . OANDA:XAUUSD rebounded strongly from the 3244 support area, breaking above the downward trendline and pushing into the mid-resistance band. The price is currently testing 3353 and could pull back slightly before retesting the 3388 key resistance level. A sustained breakout above that red trendline would open the door for a run toward 3450.
📈 Key Levels
Buy zone: 3312–3330 (post-breakout retest area)
Sell trigger: break below 3312 and close under trendline
Target: 3388 with potential extension to 3450
Buy trigger: confirmed bullish bounce from 3312 and momentum above 3353
💡 Risks
Resistance at 3388 may cause rejection if volume fades
Downward trendline remains a structural cap unless fully broken
False breakout could return price back to 3244 zone quickly
If this idea resonates with you or you have your own opinion, traders, hit the comments. I’m excited to read your thoughts!

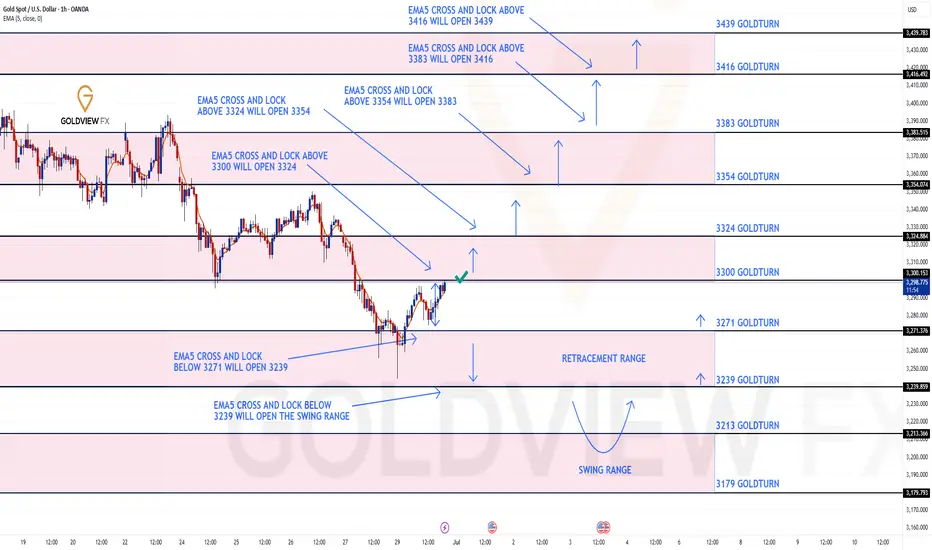
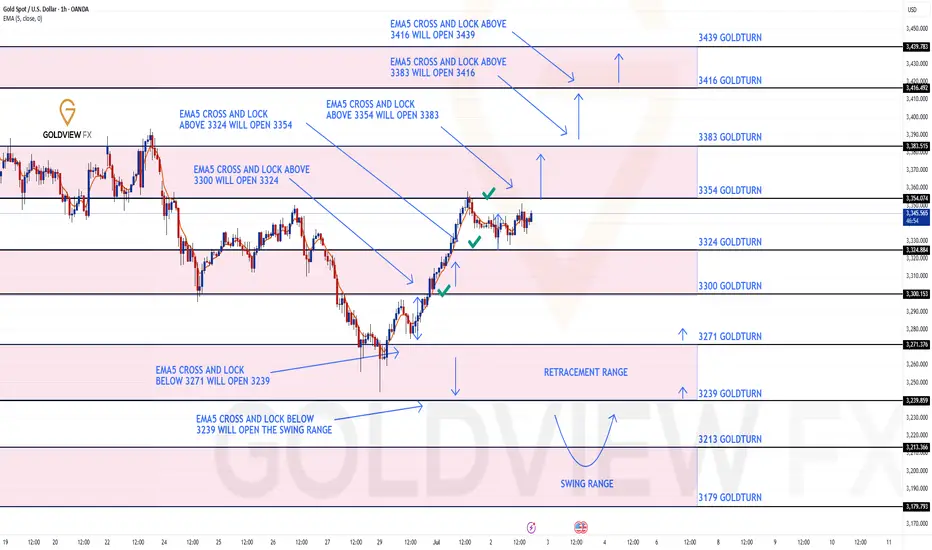
GOLD 1H CHART ROUTE MAP UPDATE & TRADING PLAN FOR THE WEEKHey Everyone,
Please see our updated 1h chart levels and targets for the coming week.
We are seeing price play between two weighted levels with a gap above at 3300 and a gap below at 3271. We will need to see ema5 cross and lock on either weighted level to determine the next range.
We will see levels tested side by side until one of the weighted levels break and lock to confirm direction for the next range.
We will keep the above in mind when taking buys from dips. Our updated levels and weighted levels will allow us to track the movement down and then catch bounces up.
We will continue to buy dips using our support levels taking 20 to 40 pips. As stated before each of our level structures give 20 to 40 pip bounces, which is enough for a nice entry and exit. If you back test the levels we shared every week for the past 24 months, you can see how effectively they were used to trade with or against short/mid term swings and trends.
The swing range give bigger bounces then our weighted levels that's the difference between weighted levels and swing ranges.
BULLISH TARGET
3300
EMA5 CROSS AND LOCK ABOVE 3300 WILL OPEN THE FOLLOWING BULLISH TARGETS
3324
EMA5 CROSS AND LOCK ABOVE 3324 WILL OPEN THE FOLLOWING BULLISH TARGET
3354
EMA5 CROSS AND LOCK ABOVE 3354 WILL OPEN THE FOLLOWING BULLISH TARGET
3383
BEARISH TARGETS
3271
EMA5 CROSS AND LOCK BELOW 3354 WILL OPEN THE FOLLOWING BEARISH TARGET
3239
EMA5 CROSS AND LOCK BELOW 3239 WILL OPEN THE SWING RANGE
3213
3179
As always, we will keep you all updated with regular updates throughout the week and how we manage the active ideas and setups. Thank you all for your likes, comments and follows, we really appreciate it!
Mr Gold
GoldViewFX

Trading Signal for (XAU/USD) sell below $3,359 (21 SMA-7/8 MurraEarly in the European session, gold is trading around 3,341, below the 7/8 Murray and above the 21 SMA and the 200 EMA, with a bullish bias.
We can see that gold reached the 7/8 Murray level on the H4 chart. This has become strong resistance, so we believe a technical correction could occur below this level in the coming hours.
On Monday, we observed gold reaching a low of 3,238, where it found a technical rebound,, as this coincided with the bottom of the downtrend channel.
Gold has a bullish bias, having reached oversold levels since June 26. It is likely that after a technical correction, it could resume its bullish cycle and reach the 8/8 Murray level at 3,437.
If gold falls below 3,359 in the coming hours, we could expect it to reach the 200 EMA around 3,321. This area will be seen as an opportunity to resume buying, as a bullish trend is emerging.
The RSI indicator is showing a positive signal, so we could take advantage of a technical rebound around 3,320 or 3,305. Both levels could provide gold with good support and a buying opportunity.
THE KOG REPORTTHE KOG REPORT:
In last week’s KOG Report we said we would be looking for price to attempt that higher level and potentially break for higher pricing. If it didn’t the path showed the level for an opportunity to short which fell just short but worked well into the level we initially wanted.
We then published the red box targets and the bias through the week which held, and we managed to complete all bearish targets by Friday.
Was it easy? No! Did we expect that flush? No! We simply got to a stage on Friday where we could only watch or get in with the volume, so we stood back and just watched.
So, what can we expect in the week ahead?
Simple one this week. We can see potential for lower, however, we’re too low to attempt shorting this, especially with the key level 3250-55 just below and major support. For that reason, we published the red boxes to help you all, look for the break either side! Ideally, we want to support on the low from the open and then continue with the move upside into the 3280-85 level initially, which should flip us on the support at 3270-75. We could range there as there is no news tomorrow but a gradual incline is what we’re looking for.
Support 3250-55 needs to break for lower, while resistance 3306-10 is the level that needs to break to go higher. That’s our potential range for now.
KOG’s bias for the week:
Bullish above 3250 with targets above 3278, 3285, 3297 and above that 3306
Bearish below 3250 with targets below 3240, 3232, 3220 and below that 3212
RED BOX TARGETS:
Break above 3275 for 3279, 3285, 3289 and 3306 in extension of the move
Break below 3260 for 3255, 3251, 3240 and 3235 in extension of the move
Please do support us by hitting the like button, leaving a comment, and giving us a follow. We’ve been doing this for a long time now providing traders with in-depth free analysis on Gold, so your likes and comments are very much appreciated.
As always, trade safe.
KOG

GOLD ROUTE MAP UPDATEHey Everyone,
Great start to the week with our Bullish target at 3300 hit perfectly!!!!
We will now look for ema5 cross and lock to confirm a continuation or failure to lock will follow with a rejection into the lower Goldturns for support and bounce.
We will see levels tested side by side until one of the weighted levels break and lock to confirm direction for the next range.
We will keep the above in mind when taking buys from dips. Our updated levels and weighted levels will allow us to track the movement down and then catch bounces up.
We will continue to buy dips using our support levels taking 20 to 40 pips. As stated before each of our level structures give 20 to 40 pip bounces, which is enough for a nice entry and exit. If you back test the levels we shared every week for the past 24 months, you can see how effectively they were used to trade with or against short/mid term swings and trends.
The swing range give bigger bounces then our weighted levels that's the difference between weighted levels and swing ranges.
BULLISH TARGET
3300 - DONE
EMA5 CROSS AND LOCK ABOVE 3300 WILL OPEN THE FOLLOWING BULLISH TARGETS
3324
EMA5 CROSS AND LOCK ABOVE 3324 WILL OPEN THE FOLLOWING BULLISH TARGET
3354
EMA5 CROSS AND LOCK ABOVE 3354 WILL OPEN THE FOLLOWING BULLISH TARGET
3383
BEARISH TARGETS
3271
EMA5 CROSS AND LOCK BELOW 3354 WILL OPEN THE FOLLOWING BEARISH TARGET
3239
EMA5 CROSS AND LOCK BELOW 3239 WILL OPEN THE SWING RANGE
3213
3179
As always, we will keep you all updated with regular updates throughout the week and how we manage the active ideas and setups. Thank you all for your likes, comments and follows, we really appreciate it!
Mr Gold
GoldViewFX
XAUUSD : Bull or Bear ? (READ THE CAPTION)By analyzing the gold chart on the 4-hour timeframe, we can see that the price continued its correction yesterday, dropping to as low as $3327. However, gold rebounded and is currently trading around the $3344 level.
The key condition for further bullish movement is a stable hold above $3338. If this level holds, the next potential upside targets are $3366 and $3399 respectively.
Please support me with your likes and comments to motivate me to share more analysis with you and share your opinion about the possible trend of this chart with me !
Best Regards , Arman Shaban

GOLD → Attempt to consolidate above 3350 for growth to 3400FX:XAUUSD , after retesting resistance at 3347, is breaking through the key level, while bulls are trying to hold their ground above support. There is potential for growth to 3400.
Gold retreated from its weekly high of $3366 ahead of key US employment data (NFP), which could set a new direction for the movement. But technically, this looks like a correction to consolidate above the level before continuing to rise. After three days of growth, the price faced selling amid a recovery in the dollar and profit-taking. Weak employment data (especially below 100,000) could reinforce expectations of a Fed rate cut as early as July and support gold. Conversely, a strong report will strengthen the dollar and put pressure on the metal. The market is bracing for high volatility
Resistance levels: 3363, 3393, 3400
Support levels: 3347, 3336, 3311
The price has entered a new range of 3345-3400. Consolidation is forming above the support level before a possible rise. I do not rule out another retest of 3345-3336 (liquidity zone) before realization and a rally to 3400.
Best regards, R. Linda!

GOLD → Retest of the resistance range. Correction?FX:XAUUSD is recovering amid expectations of lower interest rates in the US, and the falling dollar is also supporting the price of the metal.
The dollar remains under pressure due to political uncertainty in the US, budget concerns, and trade risks. However, strong stock market growth and possible tariff measures against Japan and the EU are also affecting the market, adding volatility to gold
Powell will speak at the ECB forum, and markets are waiting for him to hint at a rate cut. Currently, the probability of a cut in July is estimated at 20%, and in September at 77%. A dovish tone will support gold, while a hawkish tone will increase pressure.
Technically, since the opening of the session, gold has exhausted its daily range (ATR), and there is a fairly high probability that after strong growth, the price may be stopped in the 3347-3350 zone.
Resistance levels: 3347, 3350
Support levels: 3312, 3295
If gold cannot continue to rise after breaking through 3347 and the price returns to the resistance zone, then in this case, we can consider a correction to 0.5-0.7 Fibonacci before a possible continuation of growth.
Best regards, R. Linda!

GOLD DAILY CHART ROUTE MAPHey Everyone,
Following up on our previous Goldturn channel post – the recent price action has played out exactly as anticipated. We saw a clean rejection at the channel top around 3433, with price failing to lock above and confirming that resistance is still very much in control at the range ceiling.
This rejection was perfect and it led to a decisive move back down into the 3272 Goldturn support. This level is now acting as a critical pivot. From here, we’re watching closely for one of two outcomes:
1. Bounce Scenario: If price holds and we see a supportive reaction from 3272, particularly with no EMA5 cross and lock confirmation, we will look for long opportunities to slowly ascend the channel again. Expect a grind with testing of in-between levels as structure develops.
2. Breakdown Scenario: If 3272 fails to hold, we expect the next key test to occur at the channel’s midline – a level that has acted as support. A further breakdown would likely target 3106, our next Goldturn support zone, for potential reversal setups.
This price action continues to validate the effectiveness of the Goldturn channel structure keeping us grounded and responsive rather than reactive.
We remain focused on level to level trading, guided by the channel and supported by EMA5 confirmations for directional analysis.
Key Levels to Watch:
Resistance: 3433
Support: 3272 (current test), 3106 (if breakdown continues)
Stay patient and let price confirm. The best trades continue to come from structure respecting reactions, not from chasing.
Mr Gold
GoldViewFX

Gold Bounces from Demand Zone – Next Targets in Sight!By analyzing the gold chart on the 4-hour timeframe, we can see that today, price once again dipped into our key demand zone (Bullish Rejection Block) between $3245 and $3262, where it faced strong buying pressure and rallied up to $3296.
Currently, gold is trading around $3281, and as long as price holds above $3273, we expect further upside. The next potential targets are $3294, $3300, and $3309.
🎥 If you enjoyed this video analysis and found it helpful, please show your support with a LIKE and COMMENT below!
These video-style breakdowns take time and effort, and I’ll only continue them with your support 🙌
Your engagement is my biggest motivation to keep going 💛
Thanks for being part of the journey!

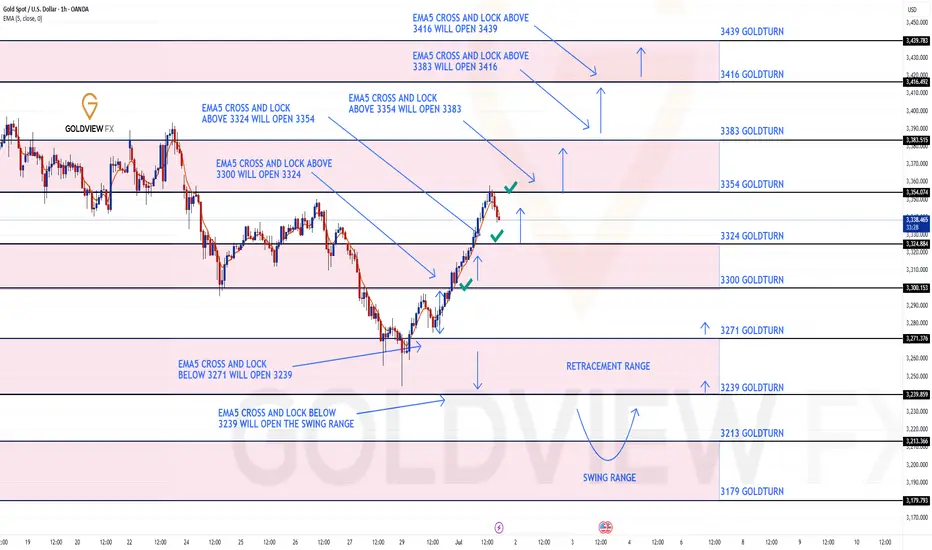
GOLD ROUTE MAP UPDATEHey Everyone,
Another PIPTASTIC day on the charts today with our analysis playing out to perfection!!!
After hitting 3300 target yesterday, we stated that we would now look for ema5 cross and lock above 3300 to open 3324. This was locked and loaded and we got the target hit at 3324. This followed with a further ema5 cross and lock above 3324 opening 3354, which was also hit perfectly completing this range.
We are now seeing a perfect rejection from this level and unless we get a ema5 cross and lock above this level for a continuation, we are likely to see the lower Goldturns tested for support and bounce.
We will keep the above in mind when taking buys from dips. Our updated levels and weighted levels will allow us to track the movement down and then catch bounces up.
We will continue to buy dips using our support levels taking 20 to 40 pips. As stated before each of our level structures give 20 to 40 pip bounces, which is enough for a nice entry and exit. If you back test the levels we shared every week for the past 24 months, you can see how effectively they were used to trade with or against short/mid term swings and trends.
The swing range give bigger bounces then our weighted levels that's the difference between weighted levels and swing ranges.
BULLISH TARGET
3300 - DONE
EMA5 CROSS AND LOCK ABOVE 3300 WILL OPEN THE FOLLOWING BULLISH TARGETS
3324 - DONE
EMA5 CROSS AND LOCK ABOVE 3324 WILL OPEN THE FOLLOWING BULLISH TARGET
3354 - DONE
EMA5 CROSS AND LOCK ABOVE 3354 WILL OPEN THE FOLLOWING BULLISH TARGET
3383
BEARISH TARGETS
3271
EMA5 CROSS AND LOCK BELOW 3354 WILL OPEN THE FOLLOWING BEARISH TARGET
3239
EMA5 CROSS AND LOCK BELOW 3239 WILL OPEN THE SWING RANGE
3213
3179
As always, we will keep you all updated with regular updates throughout the week and how we manage the active ideas and setups. Thank you all for your likes, comments and follows, we really appreciate it!
Mr Gold
GoldViewFX
Gold Breakout Retest – Will PRZ Trigger the Next Rally?Gold ( OANDA:XAUUSD ) attacked the Resistance lines and Resistance zone($3,350-$3,326) as I expected in yesterday's idea .
Gold seems to have broken the Resistance zone($3,350-$3,326) and Resistance lines and is pulling back to this zone.
In terms of Elliott Wave theory , Gold appears to have completed wave 3 and is currently completing wave 4 .
I expect Gold to have a chance to rise back to the Resistance zone($3,394-$3,366) after entering the Potential Reversal Zone(PRZ) .
Note: Stop Loss (SL) = $3,297=Worst SL
Gold Analyze (XAUUSD), 1-hour time frame.
Be sure to follow the updated ideas.
Do not forget to put a Stop loss for your positions (For every position you want to open).
Please follow your strategy; this is just my idea, and I will gladly see your ideas in this post.
Please do not forget the ✅ ' like ' ✅ button 🙏😊 & Share it with your friends; thanks, and Trade safe.

#XAUUSD: +2000 Swing Sell In Making! Get ReadyGold has dropped to the 3330 region but has now reversed and is currently trading at 3350. The next potential move could be at 3380, followed by 3400. Our sell entry is at 3400, where we believe the price will reverse. Our long-term view is that gold will head towards 3100, but our first target will be 3200. Please use accurate risk management when trading gold, as it can cause serious financial issues if not planned properly. This analysis does not guarantee any price movement.
Good luck and trade safely!
Team Setupsfx!

Gold Market Update: Stuck in summer time range / SeasonalityGold is stuck so far last 4-6 weeks in tight range trading conditions
due to summer time seasonality also strong gains previously
expecting range locked conditions in July as well here's an
overview of 5 years and 10 years of seasonality data by month
until at least August expecting dead market conditions it's best
to focus on trading the range or trading with automated algo instead.
Here are the two tables showing month-over-month percent changes in gold prices (London PM fix USD/oz) for June, July, and August:
| Year | June Close | July Close | August Close | June % | July % | August % |
| ---- | ---------: | ---------: | -----------: | -----: | ------: | -------: |
| 2023 | 1,942.90 | 1,951.02 | 1,918.70 | –0.04% | +0.42% | –1.68% |
| 2022 | 1,836.57 | 1,732.74 | 1,764.56 | –5.65% | +1.80% | +1.80% |
| 2021 | 1,834.57 | 1,807.84 | 1,785.28 | –1.47% | –1.48% | –1.22% |
| 2020 | 1,761.04\* | 1,771.65\* | 1,968.16\* | +8.66% | +11.19% | +10.99% |
| 2019 | 1,342.66\* | 1,413.39\* | 1,523.00\* | +5.29% | +7.95% | +7.74% |
| 2018 | 1,270.00\* | 1,230.00\* | 1,194.00\* | –1.09% | –3.15% | –3.02% |
| 2017 | 1,257.00\* | 1,243.00\* | 1,280.00\* | +0.72% | –1.10% | +2.93% |
| 2016 | 1,255.00\* | 1,364.00\* | 1,322.00\* | +3.24% | +8.67% | –3.11% |
| 2015 | 1,180.00\* | 1,172.00\* | 1,116.00\* | –2.06% | –0.68% | –4.69% |
| 2014 | 1,320.00\* | 1,311.00\* | 1,312.00\* | –0.65% | –0.68% | +0.08% |
🔍 Summary Highlights
June has been weak more often than not—negative in 6 of the past 10 years.
July shows modest gains overall—positive in 7 of the last 10.
August is the strongest summer month—positive 6 times out of the past 10, with several double-digit y/y gains (like +10.99% in 2020).

GOLD 4H CHART ROUTE MAP UPDATE & TRADING PLAN FOR THE WEEKHey Everyone,
Please see our updated 4h chart levels and targets for the coming week.
We are seeing price play between two weighted levels with a gap above at 3301 and a gap below at 3242. We will need to see ema5 cross and lock on either weighted level to determine the next range.
We will see levels tested side by side until one of the weighted levels break and lock to confirm direction for the next range.
We will keep the above in mind when taking buys from dips. Our updated levels and weighted levels will allow us to track the movement down and then catch bounces up.
We will continue to buy dips using our support levels taking 20 to 40 pips. As stated before each of our level structures give 20 to 40 pip bounces, which is enough for a nice entry and exit. If you back test the levels we shared every week for the past 24 months, you can see how effectively they were used to trade with or against short/mid term swings and trends.
The swing range give bigger bounces then our weighted levels that's the difference between weighted levels and swing ranges.
BULLISH TARGET
3301
EMA5 CROSS AND LOCK ABOVE 3301 WILL OPEN THE FOLLOWING BULLISH TARGETS
3370
EMA5 CROSS AND LOCK ABOVE 3370 WILL OPEN THE FOLLOWING BULLISH TARGET
3429
EMA5 CROSS AND LOCK ABOVE 3429 WILL OPEN THE FOLLOWING BULLISH TARGET
3499
BEARISH TARGETS
3242
EMA5 CROSS AND LOCK BELOW 3242 WILL OPEN THE FOLLOWING BEARISH TARGET
3171
EMA5 CROSS AND LOCK BELOW 3171 WILL OPEN THE SWING RANGE
3089
3171
EMA5 CROSS AND LOCK BELOW 3171 WILL OPEN THE SECONDARY SWING RANGE
3089
3001
As always, we will keep you all updated with regular updates throughout the week and how we manage the active ideas and setups. Thank you all for your likes, comments and follows, we really appreciate it!
Mr Gold
GoldViewFX

GOLD ROUTE MAP UPDATEHey Everyone,
Once again our chart idea and levels are being respected and playing out to perfection, allowing us to confirm continuations and rejections.
After completing our targets, 3324 and 3354 yesterday, we had no further cross and lock above 3354, confirming the rejection.
We are now seeing price play and consolidate between 3324 and 3354 and will need ema5 cross and lock on either level to confirm our next direction.
We will keep the above in mind when taking buys from dips. Our updated levels and weighted levels will allow us to track the movement down and then catch bounces up.
We will continue to buy dips using our support levels taking 20 to 40 pips. As stated before each of our level structures give 20 to 40 pip bounces, which is enough for a nice entry and exit. If you back test the levels we shared every week for the past 24 months, you can see how effectively they were used to trade with or against short/mid term swings and trends.
The swing range give bigger bounces then our weighted levels that's the difference between weighted levels and swing ranges.
BULLISH TARGET
3300 - DONE
EMA5 CROSS AND LOCK ABOVE 3300 WILL OPEN THE FOLLOWING BULLISH TARGETS
3324 - DONE
EMA5 CROSS AND LOCK ABOVE 3324 WILL OPEN THE FOLLOWING BULLISH TARGET
3354 - DONE
EMA5 CROSS AND LOCK ABOVE 3354 WILL OPEN THE FOLLOWING BULLISH TARGET
3383
BEARISH TARGETS
3271
EMA5 CROSS AND LOCK BELOW 3354 WILL OPEN THE FOLLOWING BEARISH TARGET
3239
EMA5 CROSS AND LOCK BELOW 3239 WILL OPEN THE SWING RANGE
3213
3179
As always, we will keep you all updated with regular updates throughout the week and how we manage the active ideas and setups. Thank you all for your likes, comments and follows, we really appreciate it!
Mr Gold
GoldViewFX
Gold Bull Markets: Long-Term Overview & Current Market UpdateGold Bull Markets: Long-Term Overview & Current Market Update (2024–2025)
________________________________________
🏆 Historic Gold Bull Markets: Timeline & Stats
1️⃣ 1968–1980 “Super Bull”
• Start/End: 1968 ($35) → 1980 ($850)
• Total Gain: ~2,330%
• Key Drivers:
o End of the gold standard (Bretton Woods collapse)
o Double-digit inflation, oil shocks
o Political/economic turmoil (Vietnam, stagflation)
• Correction:
o Nearly –45% drop (1974–1976)
• Recovery:
o Took years; massive rebounds afterward
2️⃣ 1999–2012 Bull Market
• Start/End: 1999 ($252) → 2012 ($1,920)
• Total Gain: ~650%
• Key Drivers:
o Commodities supercycle
o Emerging market demand
o US dollar weakness, financial crisis fears
• Correction:
o ~–30% during 2008 crisis, but fast recovery
• Recovery:
o Rebounded quickly after 2008, then peaked in 2011–12
3️⃣ 2016/2018–2027 (Current Cycle)
• Start/End: 2016/2018 ($1,050–$1,200) → ongoing ($3,500+)
• Key Drivers:
o Record central bank buying
o Persistent inflation & low real rates
o Geopolitical instability (Russia/Ukraine, China/US, etc.)
• Correction:
o Only –20% drawdown in 2022; quick recovery
o Broke 13-year technical “cup-and-handle” base in 2024
________________________________________
📊 Current Bull Market Stats (2025) – At a Glance
Metric 1968–80 Super Bull 1999–2012 Bull 2018–2025 Current Bull
🚀 Total Gain ~2,330% ~650% ~200% so far
⏲️ Duration 12 years 13 years 7–9 years so far
💔 Max Drawdown –45% (1974–76) –30% (2008) –20% (2022)
🏦 Central Bank Role Moderate Emerging Dominant
📉 Correction Recovery Years 4 years Months
🏛️ Technical Pattern Secular breakout Multiple peaks 13-yr base breakout
________________________________________
📈 Top 10 Stats of the Current Gold Bull Market (2025):
1. Gold Price:
o ~$3,338–$3,364/oz; ATH > $3,500 in April 2025
2. Year-to-Date Gain:
o +29% YTD (2025); +30% in 2024
3. Central Bank Demand:
o 1,000 tonnes bought for 4th straight year; reserves near records
4. Inflation Hedge:
o Strong negative correlation with real yields; safe-haven demand up
5. Gold vs S&P 500:
o Gold +27% YTD; S&P 500 up only ~2%
6. Jewelry Demand:
o Down –9% in 2024, projected –16% in 2025 (high prices suppress demand)
7. Gold-Silver Ratio:
o Now ~94 (down from 105); silver catching up
8. Record Closes:
o Over 40 daily record closes in 2025; price consolidating near highs
9. Technical Breakout:
o 13-year “cup-and-handle” breakout (March 2024)
10. 2025 Forecasts:
• Range: $3,600–$4,000 by Q2 2026; some see $4,500+ if risks persist
________________________________________
🔄 How This Bull Market Stands Out
• Dominance of Central Banks:
Central banks are setting the pace—record demand, making gold a reserve anchor again.
• Faster Recovery:
Corrections are less severe, recoveries are quick (months, not years).
• Synchronized Rally with Equities:
Rare for gold and stocks to hit highs together—shows systemic confidence in gold.
• Technical Breakout:
13-year base break signals powerful, long-term momentum.
• Future Outlook:
Targets as high as $7,500/oz (650% from cycle lows) possible by 2026/27, if historical analogs play out.
________________________________________
⭐️ Recommended Strategy (2025 and Beyond)
• BUY/HOLD/ACCUMULATE on Dips:
Favor physical gold, gold ETFs (GLD), and miners (GDX).
• Physical Over Paper:
Preference for allocated, physical bullion amid rising counterparty risks.
• Diversify with Miners/Silver:
Gold-silver ratio suggests silver may offer leverage; quality miners benefit in the latter stage of bull runs.
• Long-Term Perspective:
Anticipate volatility, but higher highs are likely if macro themes persist.
________________________________________
🧭 Summary Table: Historic vs Current Bull Markets
Feature 1968–80 1999–2012 2016/18–2027
Total Gain 2,330% 650% 200%+ (so far)
Duration 12 yrs 13 yrs 7–9 yrs (so far)
Correction –45% –30% –20%
Main Buyer Retail Funds Central Banks
Pattern Parabolic Cyclical Cup & Handle
Key Risks Inflation USD/credit Inflation, war, geopolitics
________________________________________
Key Takeaways
• Gold’s current bull market is distinguished by relentless central bank demand, robust technical momentum, and swift recoveries from corrections.
• The macro backdrop—persistent inflation, global uncertainty, and sovereign de-dollarization—supports an extended cycle.
• Expectations for $4,000+ gold in the next 12–24 months are widely held, with even higher targets in a true global crisis.

XAU/USD (Gold vs. US Dollar) 4h chart pattern XAU/USD (Gold vs. US Dollar) on the 4-hour timeframe displays a bullish cup and handle pattern forming, with a breakout above the handle resistance and Ichimoku cloud.
Technical Observations:
Cup and Handle pattern indicates bullish continuation.
Breakout has occurred above trendline and handle.
Price is trading near $3,350 (approx).
Two upside TARGETS are marked on the chart.
---
🎯 Projected Targets (Approximate):
Based on your chart:
1. First Target (TP1): Around $3,390 - $3,395
2. Second Target (TP2): Around $3,425 - $3,430
These targets align with the measured move of the cup height projected from the breakout level.
---
✅ Confirmation:
Price is above the trendline and trying to hold above the Ichimoku cloud.
Entry would be ideal on a pullback to the breakout zone (~31,335-$3,340) for lower risk.
Stop-loss can be considered below the handle low (~$3,310 or $3,305).
Let me know if you want Fibonacci-based targets or support/resistance levels as well.
