GOLD Correction Complete - Rally Toward $3,450 AheadOANDA:XAUUSD is trading within a well-defined ascending channel, signaling ongoing bullish momentum. The price has continued to respect the channel structure, printing higher highs and higher lows, a clear sign of an intact uptrend. The recent retracement represents a healthy correction, potentially setting the stage for another bullish leg.
Price is now approaching a key support zone, marked by the lower boundary of the channel and a previous demand area. If this zone holds, it may offer a strong re-entry opportunity for buyers. The projected upside target is $3,450, which aligns with both the midline of the ascending channel and a previous resistance level.
As long as the price remains above the support zone and the ascending trendline, the bullish scenario remains valid. A break below this level, however, could invalidate the setup and increase the likelihood of a deeper retracement.
Always confirm your setups and trade with a proper risk management.
Best of luck!
XAUUSD trade ideas

Gold - New All Time High in the making?market context and trend environment
This 4-hour chart of Gold (XAU/USD) from OANDA illustrates a strong impulsive structure within a broader bullish trend. Following a sharp upward movement that broke through previous structure, gold formed a swing high before entering a corrective phase. The market has since pulled back and appears to be stabilizing near a zone of high confluence, suggesting potential for a renewed move to the upside. Price has respected key retracement levels, reinforcing the technical strength of this zone.
fair value gap and fibonacci confluence
A notable feature of this setup is the alignment between a visible fair value gap and the Fibonacci golden pocket zone, comprising the 0.618–0.65 retracement levels. This convergence of technical tools adds weight to the significance of the support zone around the 3,280–3,300 region. Fair value gaps represent inefficiencies in the market caused by strong institutional participation, while the golden pocket is historically known for acting as a magnet for reversals within trending markets. The presence of both in the same area increases the likelihood of price reacting positively here.
liquidity sweep and structural reaction
Before revisiting this key demand zone, price briefly swept below a local low, which may have served as a liquidity grab to fuel the next bullish leg. This liquidity sweep is followed by a sharp reaction, suggesting that downside pressure may have been absorbed by aggressive buyers positioned at the FVG and golden pocket. Price has since rebounded, and the subsequent price action shows a gradual formation of higher lows, hinting at a shift in short-term order flow back in favor of buyers.
projection and bullish scenario
The chart projects a potential bullish continuation move, with a series of higher lows anticipated to form en route to a break of structure above recent swing highs. Multiple buy-side liquidity levels (BSL) are marked, representing areas where buy stops are likely to be clustered. These zones offer clear targets for bullish expansion. The blue arrowed projection outlines a methodical stair-step advance, respecting interim levels before ultimately attempting to reach the prior high near 3,530.
strategic framework and trader insight
This chart offers a methodical roadmap for bullish continuation, rooted in the smart money framework of liquidity, inefficiency, and institutional order flow. The confluence between the fair value gap and Fibonacci retracement is particularly notable and serves as a key validation area for bullish traders. Rather than anticipating immediate breakout behavior, the projection emphasizes a progressive structure that aligns with how larger players tend to accumulate positions before moving the market. Patience and alignment with structure are emphasized as price prepares for a potential continuation move higher.

GOLD → Pressure from sellers. The decline will continueFX:XAUUSD is falling in Asian and European trading, hitting new lows and confirming the downward trend. The reason is the de-escalation of the tariff war...
The price of gold fell to $3,250 due to increased risk appetite after positive news from US-China trade talks. Investors are hoping for a quick agreement, reducing demand for gold as a safe-haven asset.
However, tensions between India and Pakistan, as well as Russia and Ukraine, continue to support interest in gold and prevent further declines. Market participants are also watching US negotiations with Japan and the EU, where the threat of new tariffs remains.
Resistance levels: 3250, 2369
Support levels: 3222, 3193, 3167
GOLD is testing support and forming a false breakdown relative to 3222. There is a possibility of a correction to 0.5 - 0.7 Fibonacci. However, if there is no pullback and the price begins to break support, gold will continue its decline to 3190 - 3170
Best regards, R. Linda!

GOLD → One step away from a bullish trend reversalFX:XAUUSD is emerging from the local corrective channel “flag.” Pre-breakdown consolidation relative to the base of the reversal pattern continues. All eyes are on 3200...
Gold is losing ground amid trade optimism and a strong dollar. The price is falling at the start of Wednesday as traders take profits after a rise from weekly lows. Weaker-than-expected US inflation has not justified expectations, but the Fed's refusal to cut rates soon is weighing on the metal. Optimism surrounding new trade agreements between the US and China, the UK, and other countries, as well as hopes for peace talks between Russia and Ukraine, are reducing demand for gold as a safe-haven asset.
Technically, the overall situation looks bearish. There is no deep pullback from support, which means pressure from sellers in the market. Consolidation is forming before an attempt to break through the 3200 level.
Resistance levels: 3243, 3257, 3269
Support levels: 3222, 3200
If the price continues to consolidate in the current local range and continues to attack support at 3222-3200, then in the short and medium term, we can expect the decline to continue. However, knowing the tricks of MM, the price may form a short squeeze relative to local resistance zones before falling further.
Best regards, R. Linda!

GOLD → Retest resistance before fallingFX:XAUUSD is forming a correction and retesting a strong resistance and liquidity zone within a downtrend. The global trend is one step away from a reversal...
Gold stabilized ahead of the release of US inflation data. After falling 3%, gold is holding steady at around $3,200, consolidating against a weaker dollar. Investors are awaiting US CPI data, which could set a new direction.
Optimism about the US-China trade agreement, geopolitical détente, and profit-taking on the dollar are holding back the price decline. The market is assessing how inflation data will affect Fed policy and demand for safe-haven assets.
Globally, the market doubts that the upward trend will continue, and there are reasons to look for points from which the price could start to fall sharply...
Resistance levels: 3269, 3284
Support levels: 3246, 3200, 3167
The news may cause a shake-up, but if there are no surprises, a false breakout of 3260-3270 and consolidation of prices in the selling zone could trigger a decline to 3200-3150.
Best regards, R. Linda!

XAU/USD - Trendline Breakout (14.05.2025)The XAU/USD pair on the M30 timeframe presents a Potential Buying Opportunity due to a recent Formation of a Breakout Pattern. This suggests a shift in momentum towards the upside and a higher likelihood of further advances in the coming hours.
Possible Long Trade:
Entry: Consider Entering A Long Position around Trendline Of The Pattern.
Target Levels:
1st Resistance – 3321
2nd Resistance – 3364
🎁 Please hit the like button and
🎁 Leave a comment to support for My Post !
Your likes and comments are incredibly motivating and will encourage me to share more analysis with you.
Best Regards, KABHI_TA_TRADING
Thank you.

Lingrid | GOLD Sideways PRICE ACTION after DeclineOANDA:XAUUSD printed a clear breakout below the key upward trendline, invalidating its previous bullish range structure. This opens the door for a potential correction toward the $3,165 support zone as bearish pressure builds. Reclaiming $3,285 would be required to reintroduce bullish momentum.
📌 Key Levels
Support level: 3,165
Invalidation level: Above 3,285
Target area: 3,165 and possibly 2,967.73
⚠️ Risks
A recovery above 3,285 may trigger a fakeout reversal
Watch for bounce signals at the lower boundary of the channel
Traders, if you liked this idea or if you have your own opinion about it, write in the comments. I will be glad 👩💻

Lingrid | GOLD Accelerating BEARISH Momentum in the MARKETOANDA:XAUUSD recently faced rejection at a lower high within the resistance zone and is now trading beneath a firm downward trendline. After a failed attempt to hold above $3,264, price has dropped sharply, signaling continuation of the bearish momentum that began after the breakout failed to sustain. The downtrend remains intact with sellers eyeing deeper support unless bulls reclaim $3,264 with momentum.
📌 Key Levels
Support zone: $3,150
Breakout target: $3,150
Invalidation level: $3,264 (local resistance / trendline retest)
⚠️ Risks
Short-term rebounds may test the trendline before continuation
False breakdown risk exists near $3,150 without volume support
Unexpected bullish reversal above $3,264 would invalidate bearish bias
Traders, if you liked this idea or if you have your own opinion about it, write in the comments. I will be glad 👩💻

GOLD 1H CHART ROUTE MAP & TRADING PLAN FOR THE WEEKHey Everyone,
Please see our updated 1h chart levels and targets for the coming week.
We are seeing price play between two weighted levels with a gap above at 3341 and a gap below at 3307. We will need to see ema5 cross and lock on either weighted level to determine the next range.
We will see levels tested side by side until one of the weighted levels break and lock to confirm direction for the next range.
We will keep the above in mind when taking buys from dips. Our updated levels and weighted levels will allow us to track the movement down and then catch bounces up.
We will continue to buy dips using our support levels taking 30 to 40 pips. As stated before each of our level structures give 20 to 40 pip bounces, which is enough for a nice entry and exit. If you back test the levels we shared every week for the past 24 months, you can see how effectively they were used to trade with or against short/mid term swings and trends.
The swing range give bigger bounces then our weighted levels that's the difference between weighted levels and swing ranges.
BULLISH TARGET
3341
EMA5 CROSS AND LOCK ABOVE 3341 WILL OPEN THE FOLLOWING BULLISH TARGETS
3372
EMA5 CROSS AND LOCK ABOVE 3372 WILL OPEN THE FOLLOWING BULLISH TARGET
3414
EMA5 CROSS AND LOCK ABOVE 3414 WILL OPEN THE FOLLOWING BULLISH TARGET
3447
EMA5 CROSS AND LOCK ABOVE 3447 WILL OPEN THE FOLLOWING BULLISH TARGETS
3478
EMA5 CROSS AND LOCK ABOVE 3478 WILL OPEN THE FOLLOWING BULLISH TARGETS
3502
BEARISH TARGETS
3307
EMA5 CROSS AND LOCK BELOW 3307 WILL OPEN THE RETRACEMENT RANGE
3281
3254
EMA5 CROSS AND LOCK BELOW 3254 WILL OPEN THE SWING RNGE
3233
3201
As always, we will keep you all updated with regular updates throughout the week and how we manage the active ideas and setups. Thank you all for your likes, comments and follows, we really appreciate it!
Mr Gold
GoldViewFX

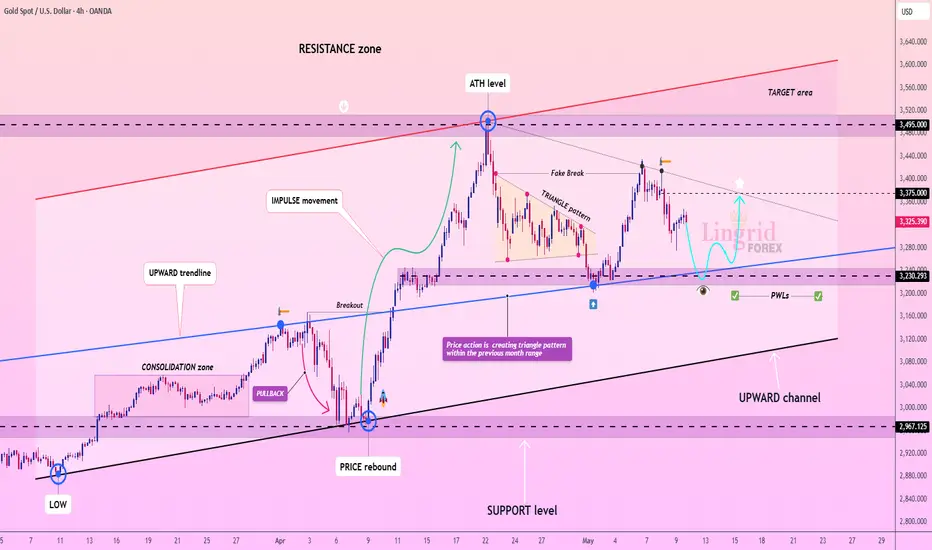
Lingrid | GOLD Weekly MARKET Analysis: CONSOLIDATION PhaseOANDA:XAUUSD has made a positive move but faced resistance at $3,430, with strong support established at $3,250. The market is likely to trade sideways or experience a deeper correction in the near term. A major resistance barrier appears to be forming overhead, making further upside difficult without significant catalysts.
These temporary pullbacks may prove beneficial within what appears to be a longer-term uptrend. It is natural for markets to move sideways and form consolidation patterns after the bullish momentum we've witnessed since the beginning of this year. Therefore, sideways consolidation currently represents the healthiest market reaction.
Last year, we observed similar price action where the market made a bullish move from February through April before consolidating for two months. Current price action suggests we may see consolidation in the form of a triangle pattern before a major catalyst fuels the next market move. Overall, I expect the market to continue moving sideways within the April trading range, with the possibility of a deeper correction.
Traders, if you liked this idea or if you have your own opinion about it, write in the comments. I will be glad 👩💻
Gold will continue to grow and exit from pennantHello traders, I want share with you my opinion about Gold. After looking at this chart, we can see how the price of Gold has been developing inside an upward pennant, formed after a powerful impulse from the buyer zone. This earlier move created a strong bullish foundation, supported by consistent reactions from the support area, which has since become a key defensive level. After the breakout from the upper boundary of the previous ascending channel, the price entered a phase of consolidation. However, rather than fading, the price action has remained tightly squeezed between the support line and the resistance trendline, creating the structure of a classic pennant. This pattern usually signals continuation, especially when supported by strong preceding momentum, which is exactly what we’re seeing here. Currently, the price is hovering around the support line of the pennant and has already shown signs of bouncing back up. If this rebound continues, the next logical move is a breakout through the resistance line of the pennant, with the 3450 level as a target. It aligns perfectly with the upper boundary and represents a strong technical TP1. Please share this idea with your friends and click Boost 🚀

#XAUUSD: +2000 Pips Correction US-China Trade Deal ConfirmedGold has experienced a significant decline in recent days, primarily due to fundamental market factors that have caused its price to fall from 3430 to 3209, resulting in a loss of approximately 2210 pips. Consequently, we recommend that you consider selling Gold if it aligns with your analysis and assessment. It is imperative that you implement strict risk management measures while trading Gold.
It is important to note that this analysis does not guarantee a price decline or that the market will behave as described. Therefore, we strongly advise you to conduct thorough trade planning before making any trading decisions.
We extend our sincere gratitude for your unwavering support over the years.
Our primary objective is to assist you in making well-informed decisions. Therefore, we encourage you to contact us if you have any inquiries or require further information.
Additionally, we would be delighted to receive your insights on which cryptocurrency pair you would like to explore next. Please do not hesitate to share your preferences.
Best regards,
Team Setupsfx_

XAU/USD: Gold will fall ? (READ THE CAPTION)By analyzing the gold chart on the 2-hour timeframe, we can see that on Friday, after the price rose to $3248, it once again faced a correction and eventually closed at $3326. I expect that with the market opening, we’ll see further correction from gold, and the first potential target will likely be the $3213–$3216 area.
The key demand zones are $3253–$3274 and the $3313 level.
The key supply zones are $3355–$3369 and $3395–$3408.
Please support me with your likes and comments to motivate me to share more analysis with you and share your opinion about the possible trend of this chart with me !
Best Regards , Arman Shaban

Gold: Potential Bullish Reversal Setup on XAU/USD from QML ZoneHello guys!
What I see:
QML in Lower Time Frame:
Price is currently testing a QML zone from a lower timeframe (marked in light blue).
This area aligns with a significant reaction point, suggesting institutional interest.
QML in Higher Time Frame:
Below this lies a higher timeframe QML, acting as a secondary support.
This adds confluence for a potential strong bullish rejection if the price dips further.
Engulfed Level:
A previously engulfed resistance level has been marked, showing where sellers lost control.
Price returning toward this area with reduced momentum indicates possible accumulation.
Targets Identified:
Multiple target levels are projected with an ascending structure.
These align with liquidity pools above recent highs, suggesting buy-side liquidity engineering.
Market Structure:
Current price behavior suggests the formation of higher lows and potential bullish continuation.
A corrective move into the QML zone could spark a strong impulsive leg upward.

Why Gold Is Pulling Back Now – May 2025 Update⚡️After surging above $3,500/oz in late April, gold has since declined over 8%, recently breaking below key levels and now trading near $3,210. The retracement reflects fading panic buying and growing attention to fundamental drivers: U.S. monetary policy, the strong dollar, easing geopolitical risks, and completed trade agreements. Here’s a breakdown of the leading catalysts and their current impact (ranked 0–10).
1. Fed “Higher for Longer” Bias Strength: 9/10 The Fed kept interest rates at 4.25–4.50% at its June policy meeting and reiterated its cautious stance. The absence of cuts combined with persistent inflation pressure is lifting real yields and undercutting gold’s appeal as a non-yielding asset.
2. U.S. Dollar Resurgence Strength: 8/10The U.S. Dollar Index (DXY) has climbed above 101 as investors digest the Fed’s hawkish tone. A stronger dollar reduces global gold demand, especially from non-USD buyers.
3. U.S.–China Trade Agreement Reached in Switzerland Strength: 7.5/10 A formal trade deal was announced in Geneva in May, easing longstanding tariff tensions. While specific tariff rollback details are pending, markets welcomed the de-escalation, pushing investors away from gold and into risk assets.
4. U.S.–U.K. Trade Deal Signed Strength: 7/10 The U.S. and U.K. finalized a bilateral trade agreement in early May, boosting global sentiment and further reducing the geopolitical premium priced into gold.
5. India–Pakistan Border De-escalation Strength: 6.5/10 After brief clashes in Kashmir in mid-May, both sides have since released statements of restraint. The calm has helped cap gold’s safe-haven bids.
6. Iran–U.S. Nuclear Talks Update Strength: 6/10 Talks resumed in Vienna in May with cautious optimism. While no concrete deal has been signed, progress and diplomatic language from both sides have eased fears of escalation.
7. Russia–Ukraine Ceasefire Developments Strength: 5.5/10 Localized ceasefires in eastern Ukraine, brokered by Turkey and the UN, have lowered near-term geopolitical risk. However, skepticism remains around long-term stability.
8. ETF Inflows & Institutional Demand Strength: 5/10 ETF inflows slowed in May (up just 48.2 tonnes), reflecting waning retail momentum. Still, central bank buying—especially from China—offers a medium-term cushion.
Catalyst Strength Rankings (May 2025)
🔸Fed “higher for longer” bias 9
🔸U.S. dollar rebound 8
🔸U.S.–China trade agreement 5.5
🔸U.S.–U.K. trade deal signed 5
🔸India–Pakistan border easing 6.5
🔸Iran–U.S. nuclear diplomacy 6
🔸Russia–Ukraine ceasefire 5.5
🔸Global gold ETF & central-bank inflows 5
Where Next for Gold?
⚡️Current price: ~$3,210/oz
📉Recent support levels broken: $3,300 and $3,250
🎯Next technical floor: $3,150/oz
✨Upside triggers: Renewed dollar weakness, inflation surprise, or geopolitical flare-up
Gold’s recent drop reflects the market's rotation out of fear-driven trades into yield-bearing and risk assets. While the Fed and the dollar remain dominant forces, any shock—whether geopolitical or inflationary—could quickly reignite interest in gold as a hedge.

THE KOG REPORTTHE KOG REPORT:
Last week’s KOG Report didn’t really go the way we wanted! We got the move we wanted initially into the low, then the long upside, but the levels we wanted to short from again were smashed through. We managed to navigate and adapt to the move and after changing the plan on the FOMC KOG Report we ended again with an extremely decent week on Gold.
As we’ve always said, when markets don’t go our way, don’t hold on to hope. If you're in the wrong way, accept your wrong and change your bias, this will not only save your account but together with the right risk management, you’ll be able to come out of the market in positive for the week.
So, what can we expect from the week ahead?
We have some news over the weekend that can open us up with gaps, otherwise Monday should be a ranging day and we’ll see some action Tuesday onwards. For this week we’ve added the red boxes for everyone, the indicator is working like a dream and allowing our traders to scalp, swing trade and day trade across the 15min/1h/4h timeframes. So please take note of them!
The problem we have this week is the structure entails two possible moves by the way they’ve set this up. For that reason, we’ll look at the key levels on the red boxes for the break and close together with KOG’s red box targets and bias of the week, before we commit to the market other than scalping.
We have the key level below 3306-10 support which if held again can push upside this time in attempt to break through the 3330 level and target the 3350-55 and above that 3365 region before a RIP. 3360 is the level to watch, if broken above and supported, we can start again with longs into that 3400+ region, but only on confirmation.
The ideal scenario here for us is a break of this symmetrical pattern in one direction, then applying our trading strategy to it which will confirm the move, we can only do this once it’s broken and then update you with the plan.
For now, we’ll play the red boxes and of course wait for our trusted algo Excalibur to guide us. As always, we will update the wider community as we go through the week.
KOG’s bias of the week:
Bullish above 3310 with targets above 3335, 3345, 3350, 3350, 3362 and 3370
Bearish below 3310 with targets below 3306, 3301, 3297, 3285 and 3274
RED BOXES (TAKE NOTE)
Break above 3335 for 3342, 3350, 3354, 3365, 3370. 3373 and 3385 in extension of the move
Break below 3320 for 3310, 3306, 3298, 3293, 3285 and 3279 in extension of the move
Please do support us by hitting the like button, leaving a comment, and giving us a follow. We’ve been doing this for a long time now providing traders with in-depth free analysis on Gold, so your likes and comments are very much appreciated.
As always, trade safe.
KOG

Gold - $3160 before the next move up?Introduction
Gold is currently exhibiting interesting price behavior across multiple timeframes, reflecting a mix of short-term bullishness within a broader context of consolidation. On the one-hour chart, gold is trading within a well-defined rising channel, suggesting a controlled upward correction following a strong impulsive move downward. This upward movement appears to be a retracement rather than a full reversal, especially when analyzed in conjunction with the higher timeframes.
Daily tight range
Zooming out, gold remains range-bound between the key levels of $3,500 and $3,200. The market has been oscillating within this wide horizontal band, making relatively equal highs and lows. This type of price action typically signals indecision or accumulation, where neither buyers nor sellers are firmly in control. Such a range can often precede a more decisive move in either direction once a breakout occurs. Until then, the market remains reactive to both support and resistance zones within this range.
Latest Gold sell-off
Yesterday’s trading session introduced a notable shift in momentum, as gold posted a large bearish candle on the one-hour chart, marking a sudden and aggressive sell-off. This move established a short-term bearish impulse. Since that moment, however, the price has been gradually recovering, climbing back within the confines of the rising channel. This rebound appears corrective in nature and has yet to reclaim the previous levels before the sell-off. Above the current price action lies a one-hour Fair Value Gap (FVG), which could be an area of interest for liquidity hunters. Should gold manage to break out to the upside of the channel, it is quite possible that price action will aim to fill this FVG, which sits around the $3,300 level. This could represent a short-term bullish target before any potential continuation lower.
Bearish scenario
On the flip side, the more compelling scenario from a technical standpoint lies on the downside. If gold fails to sustain its upward trajectory and breaks below the lower boundary of the rising channel, the probability of a move toward the strong support level at $3,160 increases significantly. This level is particularly noteworthy because it aligns with multiple technical confluences. It represents a historical support area where price has previously reacted strongly, and it coincides with the so-called “golden pocket” of the Fibonacci retracement, typically considered a high-probability reversal zone by many traders. The presence of this confluence suggests that a breakdown could trigger a swift move toward this level, possibly attracting buyers once again if the support holds.
Bullish scenario
While the potential to move higher toward the $3,300 region and fill the FVG remains valid, especially if the current bullish momentum within the channel continues, it is, in my view, the less probable scenario. The recent sharp downward candle suggests that sellers have established control in the short term, and the current upward movement may simply be a retracement before a continuation lower.
Conclusion
In conclusion, the most likely and technically supported path for gold appears to be a breakdown from the rising channel, followed by a decline toward the $3,160 support level. This zone, bolstered by historical significance and Fibonacci confluence, presents a strong target for price if bearish momentum resumes. While a temporary push toward $3,300 is possible, especially to fill the FVG, it should be seen as a lower-probability scenario compared to the downside risk currently unfolding.
Thanks for your support.
- Make sure to follow me so you don't miss out on the next analysis!
- Drop a like and leave a comment!

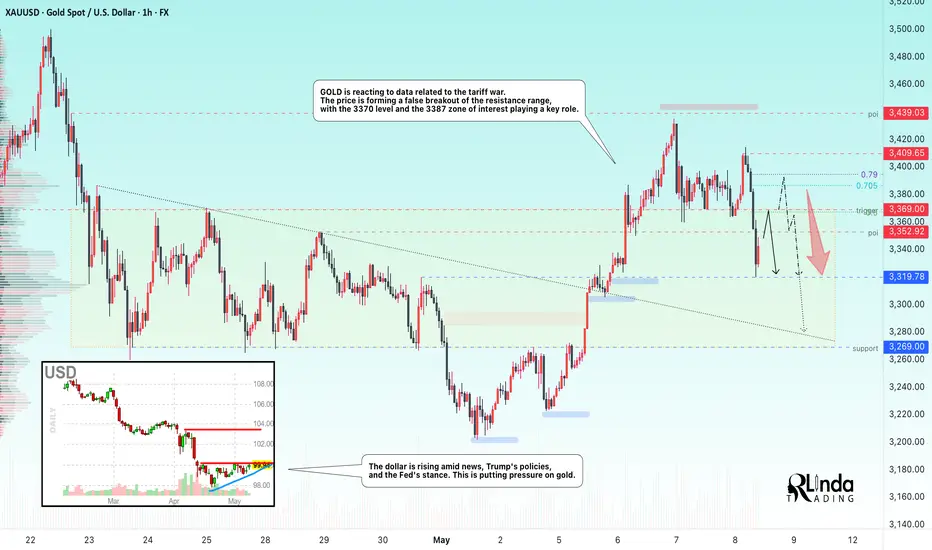
GOLD → Return to range. Fall from resistance...FX:XAUUSD is reacting to data related to the tariff war. The price is returning to the range and forming a false breakout of resistance. The level of 3370 and the zone of interest at 3387 play a key role.
On Thursday, gold rose to $3,400 amid a weaker dollar, increased demand for safe-haven assets, and continued uncertainty due to US trade policy and tensions in the Middle East and Ukraine. The Fed left rates unchanged and expressed caution in its assessment of the outlook, which also supports gold's rise.
However, in the European session, we are seeing gold react to the trade deal with Britain, most likely due to the easing of tariffs. Now the main focus is on the terms of the deal. We should not forget about China, where the situation remains tense, but everyone is waiting for a resolution.
Resistance levels: 3352, 3369, 3385
Support levels: 3319, 3269
The fundamental backdrop changes several times a day. At the moment, the situation is as follows: the rise of the dollar, the weakening of the tariff war, and the hawkish stance of the Fed may put pressure on gold. Therefore, I expect the decline to continue after a retest of 3370-3386. In this case, the target could be 3319.
Best regards, R. Linda!
XAU/USD..4h chart pattern ..I'm planning a short (sell) trade on gold with the current price at **3254** and resistance at **3282**. Here's a breakdown of your sell targets:
### **Trade Plan: GOLD SELL**
- **Current Position:** 3254
- **Resistance Level:** 3282 (Stop Loss could be placed above this level, e.g., 3300-3315)
- **Targets:**
- **1st Target:** 3210 **(440 pips)**
- **2nd Target:** 3152 **(1020 pips total)**
- **3rd Target:** 3082 **(1720 pips total)**
- **4th Target:** 2967 **(2870 pips total)**
### **Risk Management Suggestions:**
1. **Stop Loss (SL):**
- Ideally above resistance (e.g., 3285-3290).
- Risk-reward ratio improves if SL is tight (e.g., 30-40 pips for the first target).
2. **Partial Profit Booking:**
- Consider closing part of the position at 3210 (1st target) to lock in profits.
- Trail SL to breakeven or adjust as price moves in your favor.
3. **Market Conditions:**
- If gold breaks above 3282, the bearish setup may be invalidated.
- Watch for price action near resistance (rejection candles for confirmation).
Would you like help with entry timing or technical confirmation signals? 🚀

Lingrid | GOLD complex PULLBACK from RESISTANCE zoneOANDA:XAUUSD is maintaining its structure above a key upward trendline after a higher low formed near support. The market remains technically bullish while staying above this level, with the recent pullback looking corrective rather than impulsive. Buyers may step in for a renewed attempt toward the upper resistance area. Watch for a bullish breakout continuation above 3,326 toward 3,380 if buyers hold the current support line.
📌 Key Levels
Support zone: 3,305.583 (upward trendline and structure base)
Breakout target: 3,380.000 (resistance ceiling of range)
Invalidation level: Below 3,304.696 (would negate bullish setup)
⚠️ Risks
Breakdown below trendline could trigger deeper correction
Price consolidation may reduce momentum short term
Rejection near 3,326 could signal fading bullish strength
Traders, if you liked this idea or if you have your own opinion about it, write in the comments. I will be glad 👩💻

GOLD ROUTE MAP UPDATEHey Everyone,
Strong start to the week for our chart setup. Despite initial bearish momentum, price action aligned well with our dip buying strategy.
The session began with the bearish target at 3307 being achieved, triggering a key price reaction. This was followed by a ema5 cross and lock, confirming the activation of the retracement zone, which was also tested and respected with precision. We have now observed a confirmed breakout from the retracement range, opening the swing range. This move delivered our textbook swing bounce, again supporting our dip buying strategy.
The full extent of the swing range remains active, indicating continued opportunity for strategic dip entries while the range structure holds.
We will keep the above in mind when taking buys from dips. Our updated levels and weighted levels will allow us to track the movement down and then catch bounces up.
We will continue to buy dips using our support levels taking 30 to 40 pips. As stated before each of our level structures give 20 to 40 pip bounces, which is enough for a nice entry and exit. If you back test the levels we shared every week for the past 24 months, you can see how effectively they were used to trade with or against short/mid term swings and trends.
The swing range give bigger bounces then our weighted levels that's the difference between weighted levels and swing ranges.
BULLISH TARGET
3341
EMA5 CROSS AND LOCK ABOVE 3341 WILL OPEN THE FOLLOWING BULLISH TARGETS
3372
EMA5 CROSS AND LOCK ABOVE 3372 WILL OPEN THE FOLLOWING BULLISH TARGET
3414
EMA5 CROSS AND LOCK ABOVE 3414 WILL OPEN THE FOLLOWING BULLISH TARGET
3447
EMA5 CROSS AND LOCK ABOVE 3447 WILL OPEN THE FOLLOWING BULLISH TARGETS
3478
EMA5 CROSS AND LOCK ABOVE 3478 WILL OPEN THE FOLLOWING BULLISH TARGETS
3502
POTENTIALLY 3525
BEARISH TARGETS
3307 - DONE
EMA5 CROSS AND LOCK BELOW 3307 WILL OPEN THE RETRACEMENT RANGE
3281 - DONE
3254 - DONE
EMA5 CROSS AND LOCK BELOW 3254 WILL OPEN THE SWING RNGE
3233 - DONE
3201
As always, we will keep you all updated with regular updates throughout the week and how we manage the active ideas and setups. Thank you all for your likes, comments and follows, we really appreciate it!
Mr Gold
GoldViewFX

XAU/USD - Fed warns of Economic UncertaintyThe XAU/USD pair on the M30 timeframe presents a Potential Buying Opportunity due to a recent Formation of a Bullish Flag Pattern. This suggests a shift in momentum towards the upside and a higher likelihood of further advances in the coming hours.
Possible Long Trade:
Entry: Consider Entering A Long Position around Trendline Of The Pattern.
Target Levels:
1st Resistance – 3473
2nd Resistance – 3519
🎁 Please hit the like button and
🎁 Leave a comment to support for My Post !
Your likes and comments are incredibly motivating and will encourage me to share more analysis with you.
Best Regards, KABHI_TA_TRADING
Thank you.

GOLD 4H CHART ROUTE MAP UPDATE & TRADING PLAN FOR THE WEEKHey Everyone,
Please see our updated 4h chart levels and targets for the coming week.
We are seeing price play between two weighted levels with a gap above at 3344 and a gap below at 3297. We will need to see ema5 cross and lock on either weighted level to determine the next range. We have a bigger range in play then usual.
We will see levels tested side by side until one of the weighted levels break and lock to confirm direction for the next range.
We will keep the above in mind when taking buys from dips. Our updated levels and weighted levels will allow us to track the movement down and then catch bounces up.
We will continue to buy dips using our support levels taking 20 to 40 pips. As stated before each of our level structures give 20 to 40 pip bounces, which is enough for a nice entry and exit. If you back test the levels we shared every week for the past 24 months, you can see how effectively they were used to trade with or against short/mid term swings and trends.
The swing range give bigger bounces then our weighted levels that's the difference between weighted levels and swing ranges.
BULLISH TARGET
3344
EMA5 CROSS AND LOCK ABOVE 3344 WILL OPEN THE FOLLOWING BULLISH TARGET
3394
EMA5 CROSS AND LOCK ABOVE 3394 WILL OPEN THE FOLLOWING BULLISH TARGET
3438
EMA5 CROSS AND LOCK ABOVE 3438 WILL OPEN THE FOLLOWING BULLISH TARGET
3486
BEARISH TARGETS
3297
EMA5 CROSS AND LOCK BELOW 3297 WILL OPEN THE SWING RANGE
SWING RANGE
3236 - 3176
EMA5 CROSS AND LOCK BELOW 3176 WILL OPEN THE SECONDARY SWING RANGE
SWING RANGE
3088 - 3046
EMA5 CROSS AND LOCK BELOW 3046 WILL OPEN THE SECONDARY SWING RANGE
SECONDARY SWING RANGE
3130 - 3078
As always, we will keep you all updated with regular updates throughout the week and how we manage the active ideas and setups. Thank you all for your likes, comments and follows, we really appreciate it!
Mr Gold
GoldViewFX
