Lingrid | GOLD Clings to Critical Support ZoneOANDA:XAUUSD has been consolidating, moving inside a descending channel after a sharp rejection from resistance. Structure shows a wedge followed by a triangle pattern inside the downward trendline, pointing to compression before a potential breakout. A bullish scenario opens if price bounces from
About Gold Spot / U.S. Dollar
Gold price is widely followed in financial markets around the world. Gold was the basis of economic capitalism for hundreds of years until the repeal of the Gold standard, which led to the expansion of a flat currency system in which paper money doesn't have an implied backing with any physical form of monetization. AU is the code for Gold on the Periodic table of elements, and the price above is Gold quoted in US Dollars, which is the common yardstick for measuring the value of Gold across the world.

XAUUSDHello Traders! 👋
What are your thoughts on GOLD?
Gold remains trapped in a tight consolidation range between key support and resistance zones.
In the short term, the ongoing decline is expected to extend toward the support area, where a bullish reaction may occur.
As long as price stays within th

Lingrid | GOLD Broke Above Corrective Dynamic ResistanceOANDA:XAUUSD is attempting to recover after a strong sell-off from the resistance zone, with price currently testing the compression channel breakout. Structure highlights a descending sequence with a lower high, flag formations, and a downward trendline keeping the sideways tone intact. If the bre

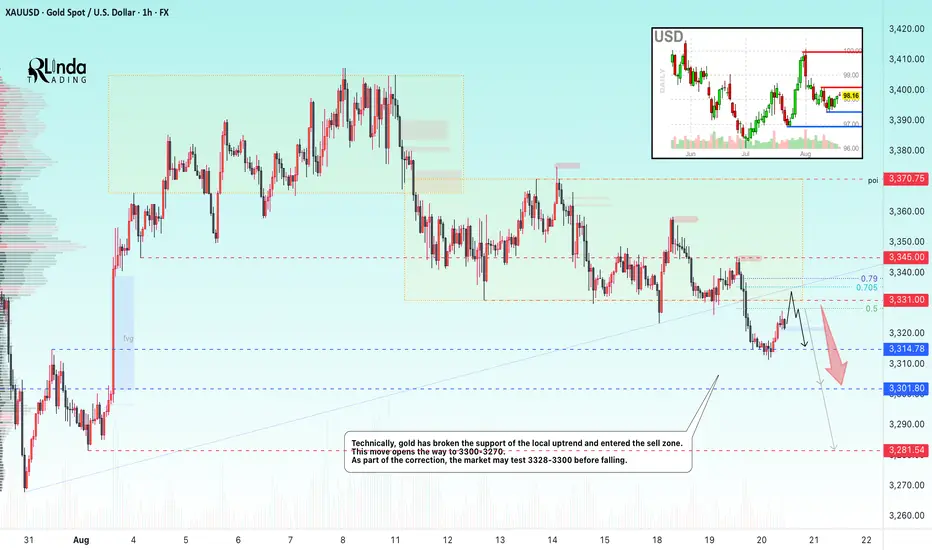
GOLD → Correction and retest of a previously broken level...FX:XAUUSD breaks through the support of the local consolidation “symmetrical triangle” and falls to a minimum of 3311...
Gold remained at a three-week low of around $3,300 in Asian trading on Wednesday as markets awaited the Fed minutes and Powell's speech in Jackson Hole. The dollar is streng
GOLD → The market is waiting for a kick (driver). ConsolidationFX:XAUUSD is in a stalemate. A “casino” pattern is forming in the form of a symmetrical triangle. The odds are 50/50, and everything depends on the fundamental background and the emergence of a driver.
Gold is stuck in a symmetrical triangle - consolidation.
Gold is trading around $3330 on Tu

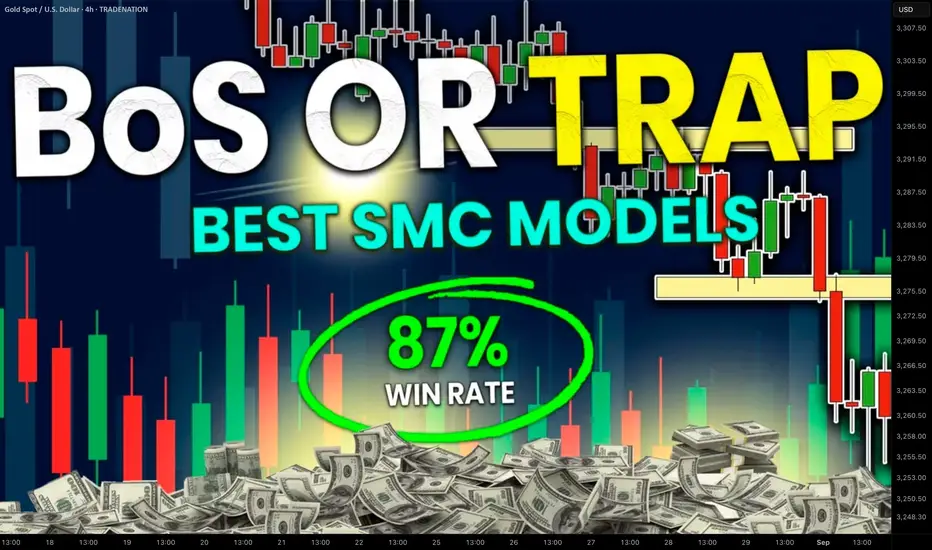
Break of Structure VS Liquidity Grab. How to Identify Valid BoS
The main problem with break of structure trading is that you can easily confuse that with a liquidity grab.
But don't worry.
There is a secret SMC price model that will help you to confirm a break of structure in a second.
Learn smart money concepts trading secrets and a simple strategy to
Lingrid | GOLD Weekly Market Analysis: Triangle Breakout AttemptThe price perfectly fulfilled my previous weekly outlook . OANDA:XAUUSD has closed around $3,371 as the market approaches a critical juncture within a well-defined triangle consolidation pattern. The recent price action suggests accumulation near key support levels with potential for a decisive d

GOLD → Breakthrough of downward resistance, news ahead...FX:XAUUSD is recovering after a fairly prolonged decline, and there are signs of bullish sentiment on the chart, but caution is advised as important news is ahead...
Gold is in a holding pattern. Its short-term fate depends on today's US economic data and, to a greater extent, on tomorrow's sp

XAUUSD: Fake Out Confirms Bearish Pressure, Eyeing 3323 & 3314Hello guys.
We recently saw a fake-out above the descending channel, which trapped early buyers and confirmed that sellers are still in control. Despite the QML formation in the highlighted zone, the bearish pressure remains dominant.
As long as the price trades below the fake-out high, the overal

GOLD → Consolidation and news. What are the chances for growth?FX:XAUUSD is consolidating in a symmetrical triangle pattern. Market uncertainty remains high. The global trend is bullish, while the local trend is neutral. What can we expect from gold?
Gold is falling ahead of Powell's speech in Jackson Hole. The dollar is strengthening on strong US economi

See all ideas
Summarizing what the indicators are suggesting.
Oscillators
Neutral
SellBuy
Strong sellStrong buy
Strong sellSellNeutralBuyStrong buy
Oscillators
Neutral
SellBuy
Strong sellStrong buy
Strong sellSellNeutralBuyStrong buy
Summary
Neutral
SellBuy
Strong sellStrong buy
Strong sellSellNeutralBuyStrong buy
Summary
Neutral
SellBuy
Strong sellStrong buy
Strong sellSellNeutralBuyStrong buy
Summary
Neutral
SellBuy
Strong sellStrong buy
Strong sellSellNeutralBuyStrong buy
Moving Averages
Neutral
SellBuy
Strong sellStrong buy
Strong sellSellNeutralBuyStrong buy
Moving Averages
Neutral
SellBuy
Strong sellStrong buy
Strong sellSellNeutralBuyStrong buy
Displays a symbol's price movements over previous years to identify recurring trends.