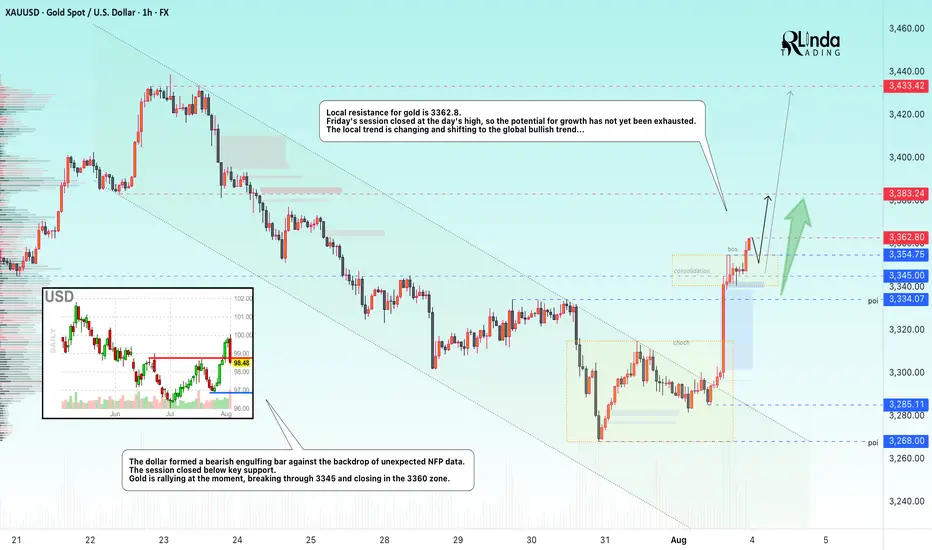
GOLD → The rally following weak NFP data may continueFX:XAUUSD is moving into distribution (rally) on the back of unexpected NFP data released on Friday. The dollar is plummeting...
Fundamentally, the gold market is getting support from an influx of funds after the unexpectedly weak NFP report. Against this backdrop, Trump said that the employment data had been “rigged” to make him look bad...
I believe that the situation is somewhat different: the president's administration failed to control this moment, hoping to see positive dynamics. Powell now has a small trump card to control his actions. The reduction in interest rates will most likely be postponed until the fall.
Technically, on D1, gold is rebounding from the support of the global trading range, forming a local bullish trend that coincides with the global one.
Resistance levels: 3362.8, 3383, 3433
Support levels: 3345, 3334
Gold is exiting the local downward channel, breaking through resistance at 3334 and 3345. Consolidation is forming, and by the end of the session, the price will break through resistance at 3354.75. The market is quite strong. Focus on two levels: 3362.8 and 3354.7. At the opening of the session, the price may attempt to break through the resistance level of 3362.8. If gold consolidates above this level, growth may continue. If not, then before further growth, the market may test the support level...
Best regards, R. Linda!
XAUUSD trade ideas
XAUUSDHello Traders! 👋
What are your thoughts on GOLD?
Gold saw a strong rally on Friday following the U.S. Non-Farm Payrolls (NFP) report and is now trading near a key resistance zone.
At this resistance, a short-term pullback is likely as traders lock in profits.
We expect the correction to be contained within key support levels, and if price holds in that zone, the uptrend is likely to resume, targeting new highs.
Will gold resume its rally after the correction? Share your view below! 👇
Don’t forget to like and share your thoughts in the comments! ❤️

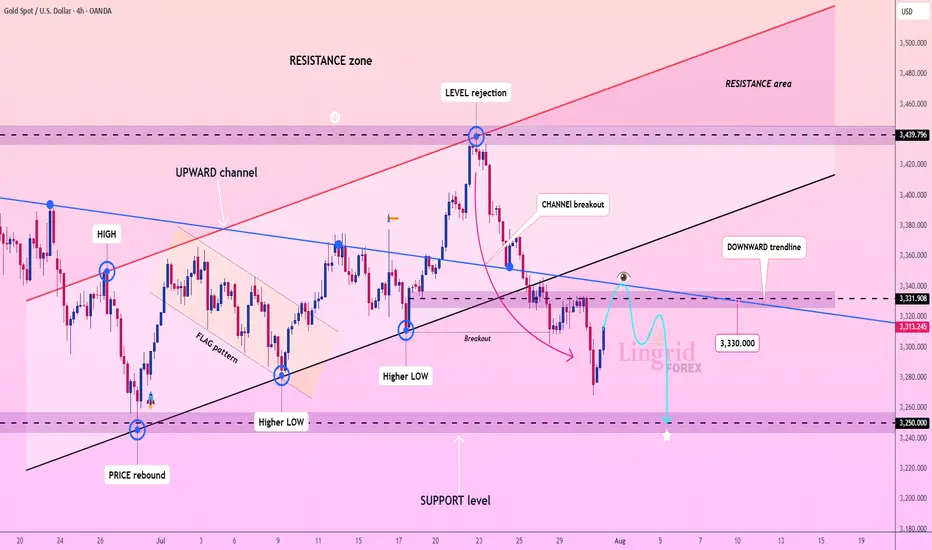
Lingrid | GOLD Possible Retest of the Major Support ZoneThe price perfectly fulfilled my previous idea . OANDA:XAUUSD is bouncing from recent lows but remains under pressure below the key resistance at 3,331.90 and the downward trendline. The prior rejection near 3,440 led to a steep selloff with a clean break below the upward channel. Current action shows a potential lower high forming near the broken trendline. A rejection there could send gold tumbling toward the 3,250.00 support zone.
📌 Key Levels
Sell trigger: Failure to reclaim 3,331.90
Sell zone: 3,330 – 3,340
Target: 3,250.00
Invalidation: Strong bullish breakout above 3,340 and descending trendline
💡 Risks
Bullish reversal breaking above downward trendline
Dovish Fed news boosting gold
Unexpected macroeconomic shocks increasing safe-haven demand
If this idea resonates with you or you have your own opinion, traders, hit the comments. I’m excited to read your thoughts!
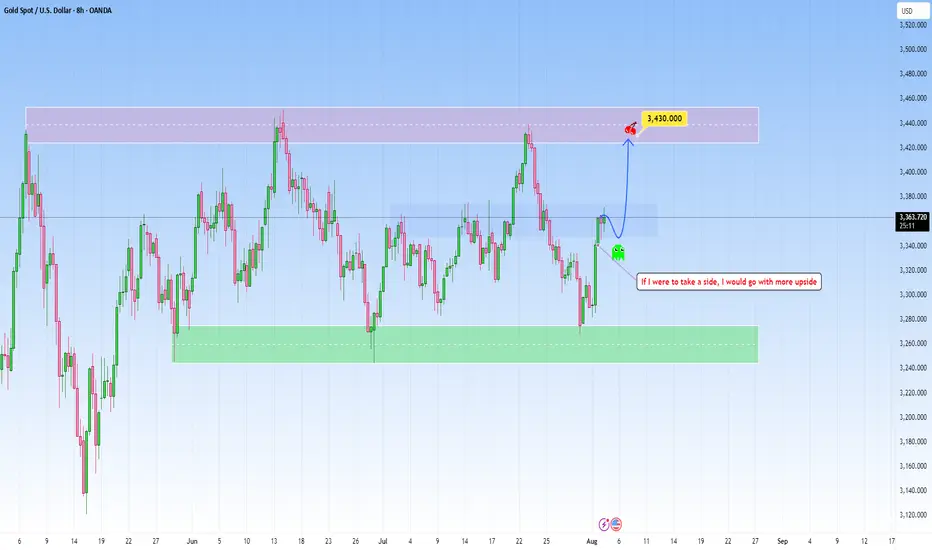
GOLD undecided: Looking for a positive outlookThe current market context on GOLD seems undecided and heavily influenced by news release and macroeconomic catalysts. The recent reversal from the support was pretty decisive, catching short-sellers off guard and forcing them to cover positions.
However, the structure has yet to produce a clean breakout beyond the mid-range, suggesting a lack of strong conviction from either side.
The probability of a pause or reversal here under this circumstances may increase substantially as well. But if I were to take a side I would definitely choose more upside , before any correction begins.
This is a high-risk zone for positioning without confirmation. The market is potentially preparing for a breakout or a fakeout, and patience is key. Wait for clear signs of intent before committing.
Lingrid | GOLD Weekly Market Analysis: Strong Bullish ReboundOANDA:XAUUSD market has demonstrated resilience with a strong bullish rebound following the NFP, suggesting that institutional buyers are stepping in at critical support levels. The precious metal is now testing key resistance zones that will determine whether the recovery can gain sustainable momentum.
The chart reveals a compelling technical setup with gold bouncing strongly just above the June low support zone around $3,265. This rebound has pushed price back above the $3,330 level and is now approaching the critical $3,400 resistance area. The strong bullish rebound after the NFP release indicates that the selling pressure faded, with buyers emerging at attractive levels near the June lows.
The previous pullback phase has been contained within the broader ascending channel structure, maintaining the overall bullish framework. The triangle pattern breakout to the downside appears to have been a false move, with the current rebound suggesting that the correction may be complete. The ability to hold above the previous week low has preserved the medium-term uptrend structure.
Key levels to monitor include the immediate resistance at $3,400 and the previous support-turned-resistance at $3,330. A decisive break above $3,400 would likely trigger renewed bullish momentum toward the $3,440-$3,465 zone, while failure to sustain above $3,330 could see another test of the June low support. The strong rebound from critical support levels suggests that the broader bullish bias remains intact, with this correction potentially setting up for the next leg higher.
If this idea resonates with you or you have your own opinion, traders, hit the comments. I’m excited to read your thoughts!

Lingrid | GOLD Potential Bullish Extension Following Pullback OANDA:XAUUSD is rebounding strongly from the support zone after a deep correction from the previous top near 3,437. The price has broken back above the range and formed a new impulse leg, now hovering just above the upward trendline. As long as the structure holds above 3,330, further continuation toward the 3,410–3,437 resistance zone remains likely. The projected wave path shows a bullish scenario targeting a retest of the top trendline.
📉 Key Levels
Buy trigger: Above 3,360
Buy zone: 3,330–3,340
Target: 3,410
Invalidation: Below 3,320
💡 Risks
Rejection from 3,360 trendline may lead to retracement
Failure to hold above 3,330 support could shift bias bearish
Upcoming macroeconomic data might increase volatility
If this idea resonates with you or you have your own opinion, traders, hit the comments. I’m excited to read your thoughts!

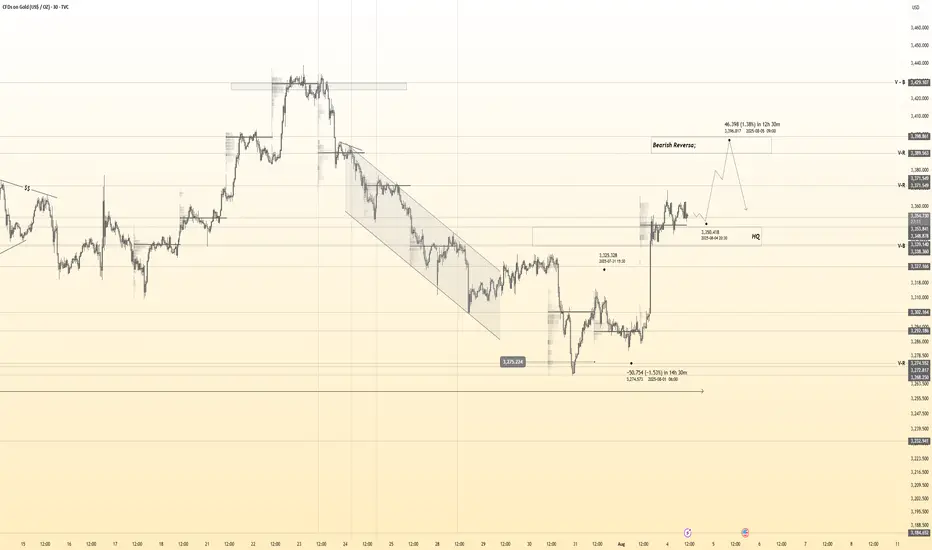
Gold 30Min Engaged ( Bullish & Bearish Entry Detected )Time Frame: 30-Minute Warfare
Entry Protocol: Only after volume-verified breakout
🩸Bullish From now Price - 3354
🩸Bearish Reversal : 3400
➗ Hanzo Protocol: Volume-Tiered Entry Authority
➕ Zone Activated: Dynamic market pressure detected.
The level isn’t just price — it’s a memory of where they moved size.
Volume is rising beneath the surface — not noise, but preparation.
🔥 Tactical Note:
We wait for the energy signature — when volume betrays intention.
The trap gets set. The weak follow. We execute.
GOLD 1H CHART ROUTE MAP UPDATE & TRADING PLAN FOR THE WEEKHey Everyone,
Please see our updated 1h chart levels and targets for the coming week.
We are seeing price play between two weighted levels with a gap above at 3370 and a gap below at 3348. We will need to see ema5 cross and lock on either weighted level to determine the next range.
We will see levels tested side by side until one of the weighted levels break and lock to confirm direction for the next range.
We will keep the above in mind when taking buys from dips. Our updated levels and weighted levels will allow us to track the movement down and then catch bounces up.
We will continue to buy dips using our support levels taking 20 to 40 pips. As stated before each of our level structures give 20 to 40 pip bounces, which is enough for a nice entry and exit. If you back test the levels we shared every week for the past 24 months, you can see how effectively they were used to trade with or against short/mid term swings and trends.
The swing range give bigger bounces then our weighted levels that's the difference between weighted levels and swing ranges.
BULLISH TARGET
3370
EMA5 CROSS AND LOCK ABOVE 3370 WILL OPEN THE FOLLOWING BULLISH TARGETS
3392
EMA5 CROSS AND LOCK ABOVE 3392 WILL OPEN THE FOLLOWING BULLISH TARGET
3416
EMA5 CROSS AND LOCK ABOVE 3416 WILL OPEN THE FOLLOWING BULLISH TARGET
3429
EMA5 CROSS AND LOCK ABOVE 3429 WILL OPEN THE FOLLOWING BULLISH TARGET
3439
BEARISH TARGETS
3348
EMA5 CROSS AND LOCK BELOW 3348 WILL OPEN THE FOLLOWING BEARISH TARGET
3328
EMA5 CROSS AND LOCK BELOW 3328 WILL OPEN THE FOLLOWING BEARISH TARGET
3313
EMA5 CROSS AND LOCK BELOW 3313 WILL OPEN THE SWING RANGE
3296
3281
As always, we will keep you all updated with regular updates throughout the week and how we manage the active ideas and setups. Thank you all for your likes, comments and follows, we really appreciate it!
Mr Gold
GoldViewFX

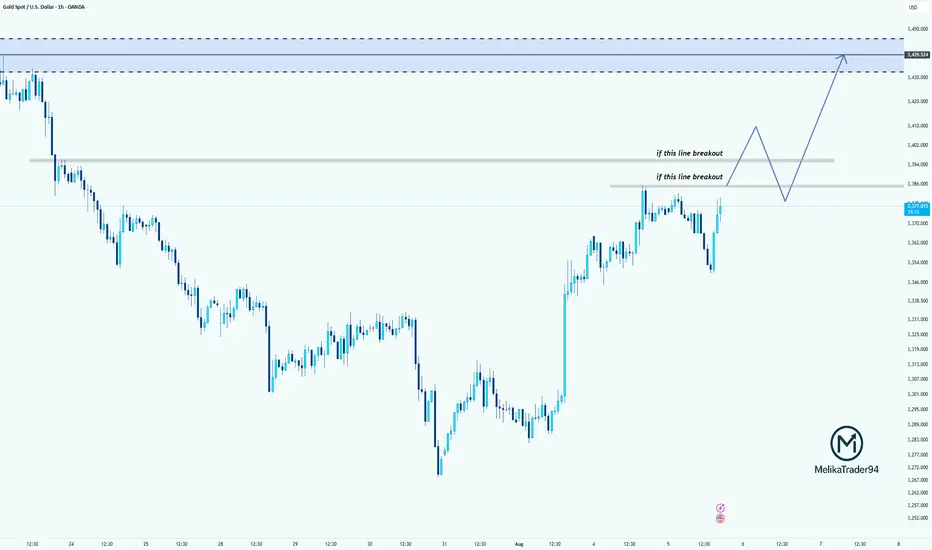
XAUUSDHello Traders! 👋
What are your thoughts on GOLD?
Gold remains trapped below the key $3,390–$3,400 resistance zone, which has rejected price multiple times in recent sessions.
A short-term pullback toward the marked support level is likely.
From that zone, we expect buyers to step in, leading to another bullish push toward the resistance, and this time, a potential breakout above the $3,400 level.
As long as the price stays above support, the bullish outlook remains intact.
A confirmed break above $3,400 could open the path toward new highs.
Don’t forget to like and share your thoughts in the comments! ❤️

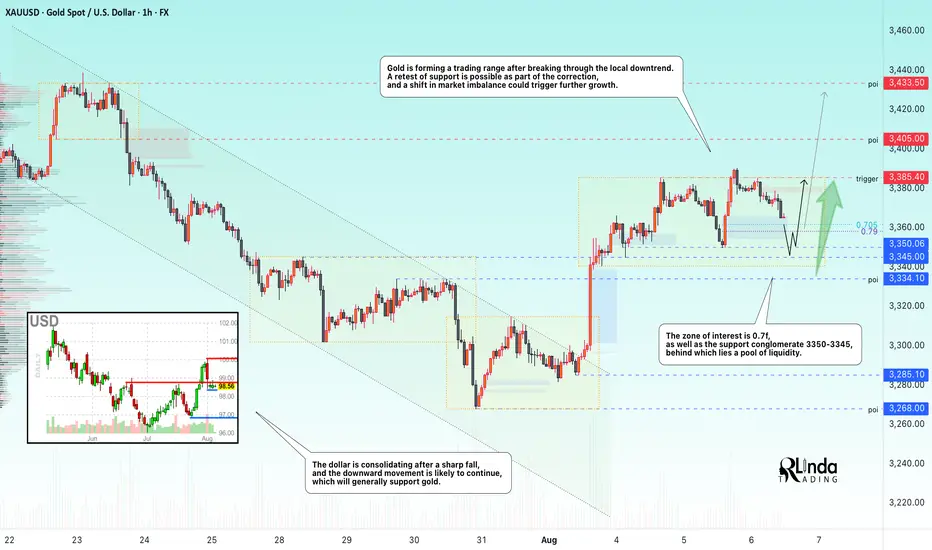
GOLD → Long squeeze of support ahead of possible growthFX:XAUUSD is entering a consolidation phase after a rally. The market is forming a trading range, and a retest of support could end in growth...
Gold pulled back from an 8-day high ($3391) on profit-taking ahead of Trump's Fed appointments. Weak ISM services data (50.1) and a pause in the dollar's weakening added pressure, although expectations of Fed policy easing in September remain supportive.
The market focus is on key events: Fed appointments (including a possible replacement for Powell) and Trump's trade statements. These factors could provide new momentum after the current correction, as long as the fundamental drivers for growth remain in place.
Resistance levels: 3385.4
Support levels: 3358, 3350, 3345
Technically, the price has confirmed resistance after a false breakout, and the market needs to build up potential for a possible continuation of growth. At the moment, the most likely scenario is a long squeeze (false breakdown) before growth continues. Focus on the key support zone.
Best regards, R. Linda!
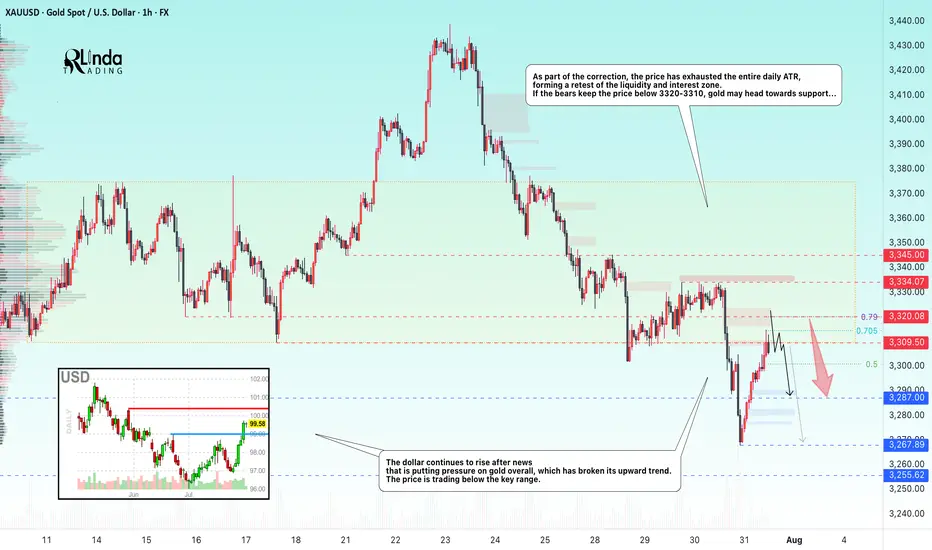
GOLD → Retest of resistance within a bearish runFX:XAUUSD breaks through the upward trend support amid a rallying dollar. Since the opening of the session, the price has been testing the zone of interest, but bears are quite aggressive...
Gold is partially recovering after falling to $3,268, a monthly low caused by the Fed's hawkish tone. The Central Bank kept its rate at 4.25–4.5% (9 votes to 2), highlighting uncertainty due to Trump's tariffs. Markets now estimate the probability of the rate remaining unchanged in September at 58% (previously 35%). The dollar's rise slowed amid concerns about the extension of the US-China trade truce and profit-taking ahead of key US employment data (after strong ADP and GDP reports). The nearest drivers are labor market statistics and trade news, while the technical picture for gold remains bearish.
Technically, on D1, the price is breaking key support zones, including the trend line, which overall only increases selling pressure on the metals market...
Resistance levels: 3310, 3320, 3334
Support levels: 3287, 3267, 3255
As part of the correction, the price has exhausted the entire daily ATR, forming a retest of the liquidity and interest zone. If the bears keep the price below 3320-3310, gold may head towards support...
Best regards, R. Linda!
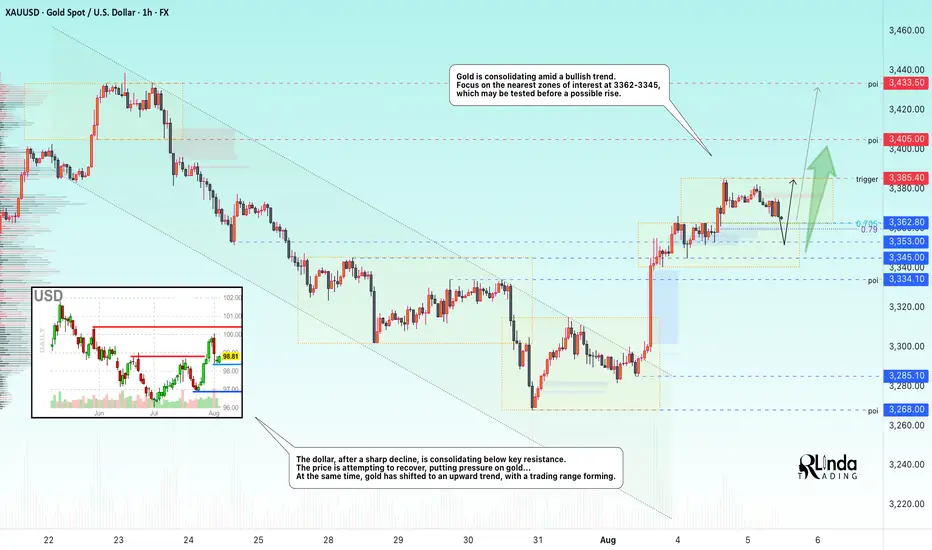
GOLD → Consolidation and correction before growthFX:XAUUSD continues to consolidate after a strong rally. The market is returning to a bullish trend, but a correction is possible before growth continues...
Gold is rising amid expectations of Fed policy easing. The market is finding support amid:
a 90.5% probability of a Fed rate cut in September, weak US employment data, and dovish comments from Fed officials.
The market is waiting for news that could determine further movement. ISM Services PMI data: strong figures could temporarily support the dollar, while weak figures could increase pressure on the USD. Questions about the Fed's independence after Trump fired the head of the BLS. Gold is maintaining its upward momentum, but its dynamics will depend on macro statistics and the Fed's response.
Technically, the focus is on the local trading range of 3385 - 3363 - 3353.
Resistance levels: 3385.4, 3433
Support levels: 3362, 3353, 3345
A retest of support and holding the price above key support could trigger a continuation of the uptrend, but it is important to pay attention to the fundamental background.
Best regards, R. Linda!
XAU/USD (Gold) - Triangle Breakout (1.08.2025)The XAU/USD Pair on the M30 timeframe presents a Potential Selling Opportunity due to a recent Formation of a Triangle Breakout Pattern. This suggests a shift in momentum towards the downside in the coming hours.
Possible Short Trade:
Entry: Consider Entering A Short Position around Trendline Of The Pattern.
Target Levels:
1st Support – 3249
2nd Support – 3225
🎁 Please hit the like button and
🎁 Leave a comment to support for My Post !
Your likes and comments are incredibly motivating and will encourage me to share more analysis with you.
Best Regards, KABHI_TA_TRADING
Thank you.
Disclosure: I am part of Trade Nation's Influencer program and receive a monthly fee for using their TradingView charts in my analysis.

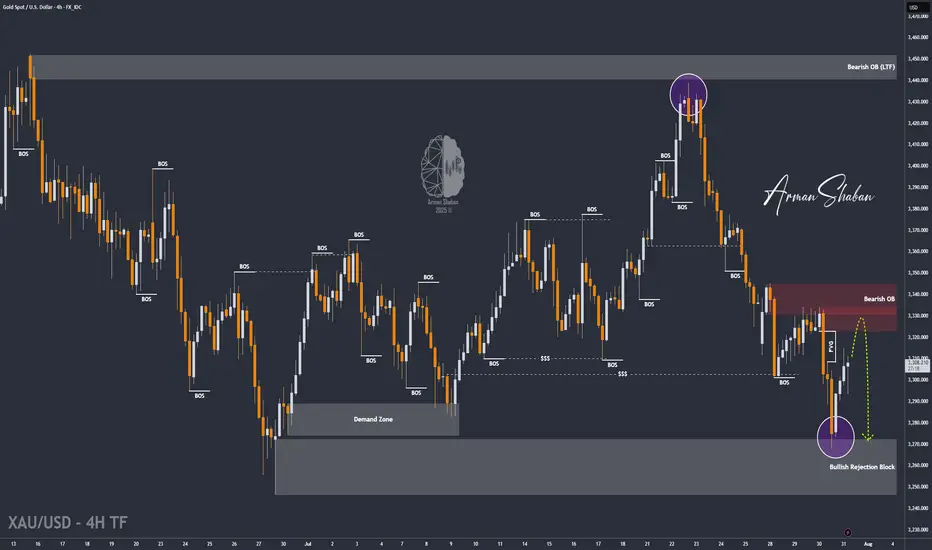
XAU/USD | Next Key Zone: Watch for Rejection at $3334! (READ)By analyzing the gold chart on the 4-hour timeframe, we can see that, just as expected, the price dropped from $3310 to $3288 in the first leg, where it hit a demand zone and bounced up to $3305, delivering a 170-pip rally. The main bearish move from $3333 to $3288 yielded 450 pips, bringing the total return on this analysis to over 620 pips!
In the second phase, gold dropped sharply again to $3268, and once more found demand, currently trading around $3307. If the price holds above $3294, we could expect further upside toward the $3322–$3334 zone. Once gold reaches this area, a strong bearish rejection is likely, with a potential return of 250 to 400 pips.
All key supply and demand levels are marked on the chart — make sure to monitor them closely and study the chart in detail. Hope you’ve made the most of this powerful analysis!
Please support me with your likes and comments to motivate me to share more analysis with you and share your opinion about the possible trend of this chart with me !
Best Regards , Arman Shaban
Gold 30Min Engaged ( Bearish & Bullish Entry Detected )Time Frame: 30-Minute Warfare
Entry Protocol: Only after volume-verified breakout
🩸Bearish From now Price - 3373
🩸Bullish Reversal : 3341
➗ Hanzo Protocol: Volume-Tiered Entry Authority
➕ Zone Activated: Dynamic market pressure detected.
The level isn’t just price — it’s a memory of where they moved size.
Volume is rising beneath the surface — not noise, but preparation.
🔥 Tactical Note:
We wait for the energy signature — when volume betrays intention.
The trap gets set. The weak follow. We execute.
XAU/USD | Bounce in Play – Watching $3350 Support for Next Move!By analyzing the gold chart on the 4-hour timeframe, we can see that after hitting the first target at $3361, gold continued its rally and reached our second supply level at $3385. Upon reaching this key level, the price faced strong selling pressure, dropping over 350 pips down to $3349. Gold is now trading around $3363, and if it can hold above the $3350 support level, we could expect another bullish push. The next upside targets are $3367, $3375, and $3385. This analysis will be updated in the coming hours with your continued support!
Please support me with your likes and comments to motivate me to share more analysis with you and share your opinion about the possible trend of this chart with me !
Best Regards , Arman Shaban

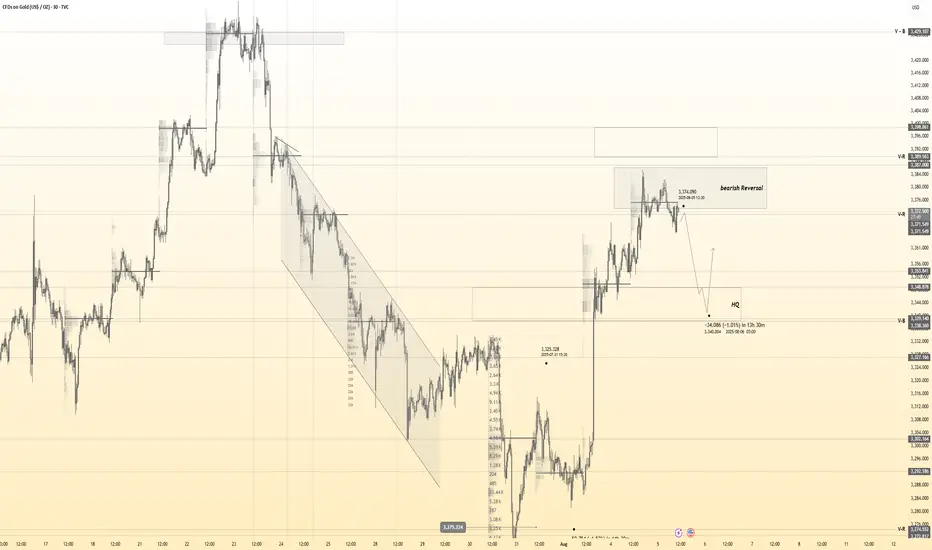
Breakout Levels in Focus for XAUUSDWhy did I say to cancel the last position? because gold is in the critical area!
Price is testing a key resistance area around 3374.
If it breaks above the first resistance level, we may see a bullish continuation toward the second breakout line.
If both levels are broken and retested successfully, the path toward the supply zone at 3430–3440 opens up.
Patience and confirmation are key here!
Gold Bounces from PRZ — Is a Short-Term Rally Underway?Gold ( OANDA:XAUUSD ) started to rise from the Support zone($3,307-$3,275) as I expected in the previous idea .
Gold is currently moving near the Support zone($3,350-$3,326) , Potential Reversal Zone(PRZ) , and $3,334 (Important price) .
From the Elliott wave theory , it seems that Gold has completed its 5 impulsive waves and now we should wait for corrective waves . Corrective waves can complete at the Potential Reversal Zone(PRZ) .
I expect Gold to rise to $3,383(at least) in the coming hours .
Second Target: $3,396
Note: Stop Loss (SL) = $3,321
Gold Analyze (XAUUSD), 1-hour time frame.
Be sure to follow the updated ideas.
Do not forget to put a Stop loss for your positions (For every position you want to open).
Please follow your strategy; this is just my idea, and I will gladly see your ideas in this post.
Please do not forget the ✅ ' like ' ✅ button 🙏😊 & Share it with your friends; thanks, and Trade safe.

XAU/USD Bullish Setup Building MomentumGold has reclaimed bullish momentum after a strong bounce from the recent demand zone around 3319–3322. The chart shows a clear Change of Character (CHOCH) and subsequent Break of Structure (BOS), suggesting buyers are regaining control. Price is now trading above the Ichimoku cloud, further confirming bullish pressure. The upward arrow highlights the potential path toward the next key resistance area near 3380–3400. As long as price sustains above the previous structural break and the cloud base, continuation toward the upside remains likely. Market structure favours buying opportunities on dips, with bulls targeting a higher move in the short term.
Entry Buy: 3334
Target Point: 3404
If you found this analysis helpful, don’t forget to drop a like and comment . Your support keeps quality ideas flowing—let’s grow and win together! 💪

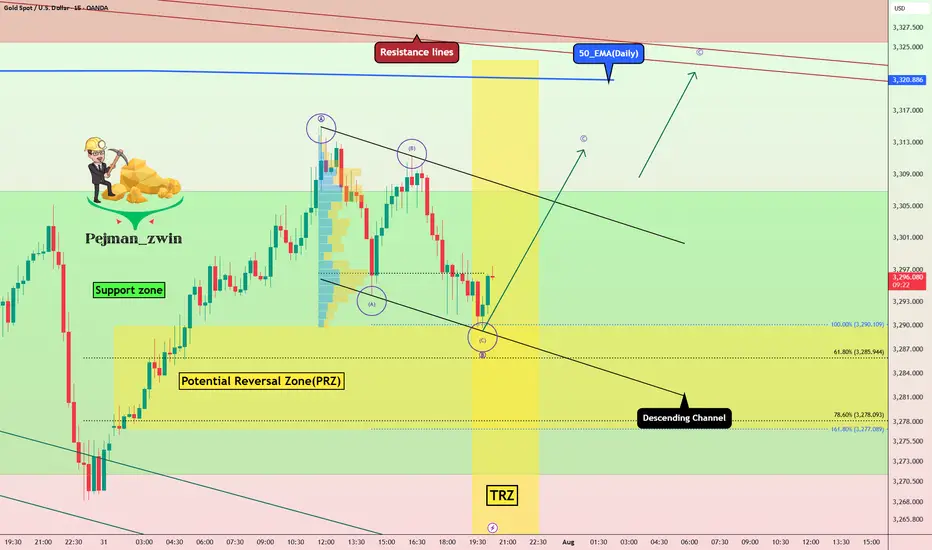
Gold in PRZ + TRZ: Is a Bullish Reversal Brewing(Short-term)?Gold , as I expected in yesterday's idea , fell to the Potential Reversal Zone(PRZ) and started to rise again .
Today's Gold analysis is on the 15-minute time frame and is considered short-term , so please pay attention .
Gold is currently trading in the Support zone($3,307-$3,275) and near the Potential Reversal Zone(PRZ) and Time Reversal Zone(TRZ) .
In terms of Elliott Wave theory , it seems that Gold can complete the microwave C of wave B at the lower line of the descending channel.
I expect Gold to trend higher in the coming hours and rise to at least $3,311 .
Note: Stop Loss (SL) = $3,267
Gold Analyze (XAUUSD), 15-minute time frame.
Be sure to follow the updated ideas.
Do not forget to put a Stop loss for your positions (For every position you want to open).
Please follow your strategy; this is just my idea, and I will gladly see your ideas in this post.
Please do not forget the ✅ ' like ' ✅ button 🙏😊 & Share it with your friends; thanks, and Trade safe.
Gold Eyes QML Resistance: Ready for a PullbackHelloooo!
Gold, after gapping up strongly, has now entered the green QML (Quasimodo Level) supply zone at roughly 3,380–3,390. This zone has acted as resistance before, so a reaction here makes perfect sense.
What I see:
Engulfed Level (3,315.66): Earlier support that got taken out. This is our logical pullback target once the QML zone does its job.
Hurricane Move: The big up-spike looks exhausted now that it’s hit the QML.
Bearish Reversal Odds: if sellers step in around current levels, expect a drop back toward 3,315.
Plan: Watch for bearish candles or a failed rally inside the 3,380–3,390 area. If we see clear rejection, target a swift move down to 3,315, with a further slide possible to the 3,260 demand zone if momentum holds.

GOLD: Be careful, It's More Complex Than it SeemsGOLD: Be careful, It's More Complex Than it Seems
After the NFP data came in at 73k vs. the expected 110k, the market reacted aggressively to the US dollar. Today, the US dollar was affected on two fronts.
One was the NFP data and the other was the mess that President Trump is creating with his tariffs against many countries. Uncertainty regarding the future impact of the tariffs remains high and unknown.
After the NFP data GOLD reacted aggressively against the US dollar by breaking easily two small structural areas towards 3315 and 3334. A possible correction is expected before gold moves further to 3370; 3400 and 3400, as shown in the chart.
You may find more details in the chart!
Thank you and Good Luck!
PS: Please support with a like or comment if you find this analysis useful for your trading day

GOLD → Consolidation after the rally...FX:XAUUSD is not falling back after a strong rally, but is consolidating against resistance at 3362.8. Continued high demand could allow the market to strengthen...
The price of gold halted its two-day rally, trading around $3362.8 on Monday morning after weak US employment data. This heightened concerns about the US economy and increased the likelihood of a Fed rate cut in September to 80%.
Additional pressure on the dollar came from the dismissal of BLS chief Erika McAntfer, which raised suspicions of statistics manipulation. Market attention is also focused on US-Canada trade talks, which could affect investor sentiment. Gold is consolidating for now, but its further growth will depend on the dynamics of the dollar and macroeconomic data.
Resistance levels: 3362.8, 3383, 3433
Support levels: 3345, 3334
As the market has now entered a consolidation phase, MM may form a retest of support before a possible rise in order to accumulate liquidity. However, a breakout of resistance at 3362.8 could trigger further growth.
Best regards, Linda!
