Lingrid | GOLD Clings to Critical Support ZoneOANDA:XAUUSD has been consolidating, moving inside a descending channel after a sharp rejection from resistance. Structure shows a wedge followed by a triangle pattern inside the downward trendline, pointing to compression before a potential breakout. A bullish scenario opens if price bounces from support near 3,315 and breaks above the 3,380 resistance handle. Overall, broader context shows gold locked in a sideways move but coiling into a corrective structure that could fuel a bullish rally.
📉 Key Levels:
Buy trigger: Rejection at 3,320
Buy zone: 3,310–3,320 support area.
Target: 3,380 then 3,431.
Invalidation: Sustained close below 3,270 support.
💡 Risks:
Failure to break the downward trendline, keeping bearish momentum intact.
Weak buying volume near support, leading to breakdown continuation.
Broader macro pressure from USD strength or yields limiting upside momentum.
If this idea resonates with you or you have your own opinion, traders, hit the comments. I’m excited to read your thoughts!
XAUUSD trade ideas

Lingrid | GOLD Broke Above Corrective Dynamic ResistanceOANDA:XAUUSD is attempting to recover after a strong sell-off from the resistance zone, with price currently testing the compression channel breakout. Structure highlights a descending sequence with a lower high, flag formations, and a downward trendline keeping the sideways tone intact. If the breakout holds above the compression channel, price could push toward 3,380, but rejection may open room back into deeper support. Broader momentum shows a corrective bearish leg softening, with potential bullish relief rally if buyers defend current levels.
📉 Key Levels:
Buy trigger: Sustained breakout above 3,320 support-turned-resistance.
Buy zone: 3,320–3,330, if buyers maintain control after breakout.
Target: 3,380 near-term resistance.
Invalidation: Breakdown below 3,250 would negate bullish setup.
💡 Risks:
Failure to sustain breakout, leading to continuation of the downtrend.
Strong USD momentum from macroeconomic releases could weigh on gold.
Geopolitical risk shifts that reprice safe-haven demand unpredictably.
If this idea resonates with you or you have your own opinion, traders, hit the comments. I’m excited to read your thoughts!

XAUUSDHello Traders! 👋
What are your thoughts on GOLD?
Gold remains trapped in a tight consolidation range between key support and resistance zones.
In the short term, the ongoing decline is expected to extend toward the support area, where a bullish reaction may occur.
As long as price stays within this range, the optimal strategy is to buy near support and sell near resistance.
A clear breakout above resistance or below support is needed to confirm the next directional move
Don’t forget to like and share your thoughts in the comments! ❤️

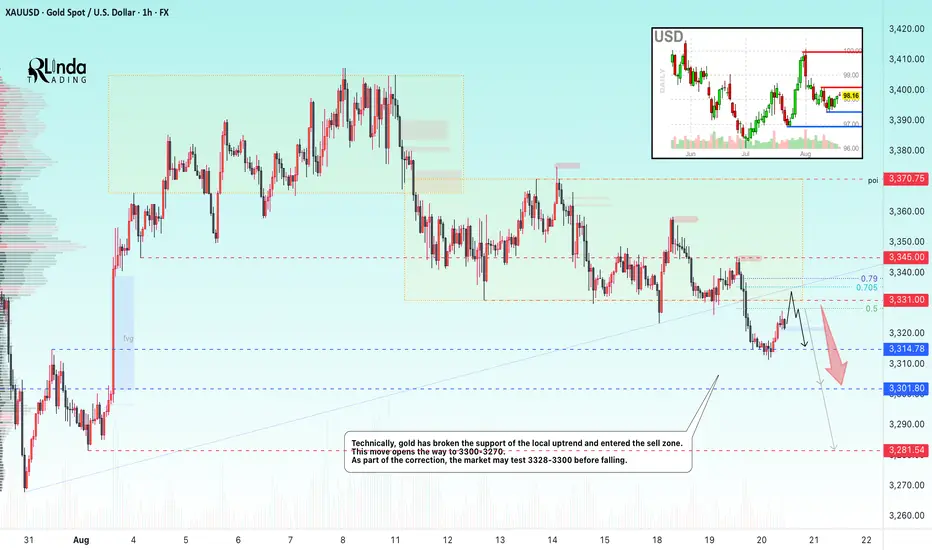
GOLD → Correction and retest of a previously broken level...FX:XAUUSD breaks through the support of the local consolidation “symmetrical triangle” and falls to a minimum of 3311...
Gold remained at a three-week low of around $3,300 in Asian trading on Wednesday as markets awaited the Fed minutes and Powell's speech in Jackson Hole. The dollar is strengthening on expectations that the Fed chair will reject the idea of aggressive rate cuts despite weak labor market and inflation data. The probability of a rate cut in September is estimated at 85%. Strong housing market data and news about negotiations on Ukraine provided additional support to the dollar. Powell's comments on Friday remain the key factor for gold, while current movements are mainly technical in nature.
Resistance levels: 3328, 3331, 3345
Support levels: 3314, 3300, 3328
Technically, a correction is forming after a bearish rally. As part of the correction, the price may test the zone of interest, which is represented by local resistance levels. Distribution could bring the price to 3300-3270.
Best regards, R. Linda!
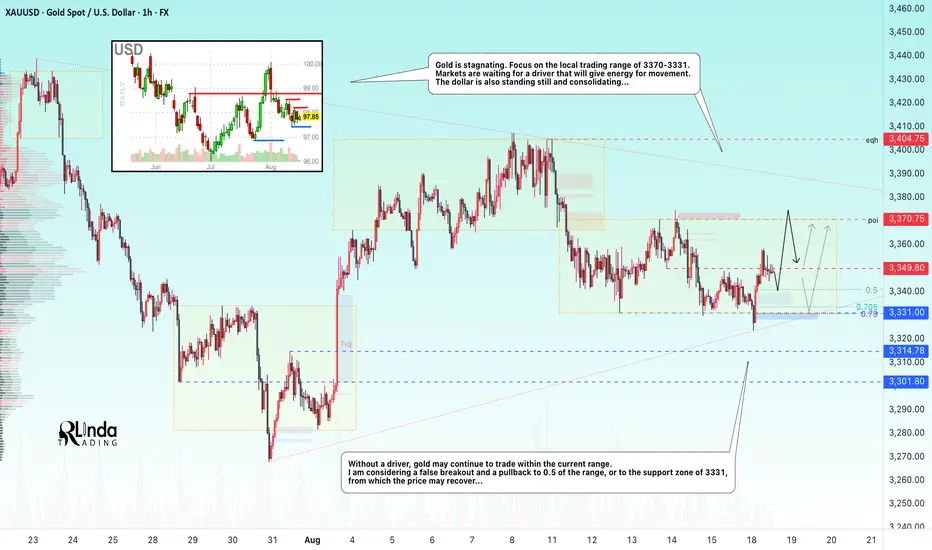
GOLD → The market is waiting for a kick (driver). ConsolidationFX:XAUUSD is in a stalemate. A “casino” pattern is forming in the form of a symmetrical triangle. The odds are 50/50, and everything depends on the fundamental background and the emergence of a driver.
Gold is stuck in a symmetrical triangle - consolidation.
Gold is trading around $3330 on Tuesday, remaining in a range with a downward bias amid caution among traders ahead of the Fed minutes.
Technically, it is possible to trade the breakout from consolidation with the price consolidating above a certain level, i.e., post-factum.
Optimism after the meeting between Trump and Zelensky, who promised to end the conflict, is reducing demand for safe assets, but expectations of a Fed rate cut this year are supporting the metal. An additional factor is the confirmation of the US rating by S&P. Powell's speech on Friday will be a key driver, while the dollar has partially recovered after its recent decline.
Resistance levels: 3349.8, 3370.7
Support levels: 3331, 3315, 3301
Volatility has been very low over the past few days, with the market waiting for someone to kick-start movement. Fundamental factors are contradictory, and technically, gold looks uncertainly weak. Based on this, I expect that a retest of the nearest resistance could end with a downward breakdown from consolidation.
Sincerely, R. Linda!

Lingrid | GOLD Weekly Market Outlook: Pullback Tests Swap ZoneOANDA:XAUUSD has pulled back from recent highs, currently around $3,335 after touching peak levels near $3,450. The pullback appears to be testing key support structures within a broader consolidation phase following the earlier breakout attempt.
4H chart shows a complex technical picture with gold trapped between the resistance zone around $3,450 and critical support near $3,270. The recent price action shows characteristics of an A-B-C corrective pullback within a compression channel, with a potential wedge formation visible in the latest consolidation phase.
Key technical levels include the downward trendline acting as dynamic resistance and the ascending support line providing a floor around current levels. The recent low near $3,270 suggests institutional players may be testing liquidity zones before establishing larger positions. Market participants should monitor the $3,310 swap zone level closely, as a break below could signal deeper retracement toward the $3,280 zone. Conversely, reclaiming the $3,380 resistance would suggest renewed bullish momentum targeting the upper resistance area.
The current consolidation phase represents a healthy pause after the previous advance, with buyers likely to emerge on any significant dip toward major support levels. Volume and momentum indicators will be crucial in determining whether this pullback represents a temporary correction or a more significant trend shift.
If this idea resonates with you or you have your own opinion, traders, hit the comments. I’m excited to read your thoughts!

Break of Structure VS Liquidity Grab. How to Identify Valid BoS
The main problem with break of structure trading is that you can easily confuse that with a liquidity grab.
But don't worry.
There is a secret SMC price model that will help you to confirm a break of structure in a second.
Learn smart money concepts trading secrets and a simple strategy to trade break of structure on any forex pair.
Let's study a break of structure that I spotted on AUDUSD forex pair.
We see that the market is bullish on a daily time frame and the price has just violated a previous high with a break of structure.
The issue with that is the fact that such a violation can easily be a liquidity grab and a bullish trap .
Buying the market immediately after a BoS, we can incur a huge loss .
We need something that would help us to accurate validate that.
Fortunately, there is a simple price model in SMC that will help.
After you spotted a break of structure on a daily time frame,
use a 4h time frame for its validation.
After a BoS on a daily time frame, the market usually starts retracing , setting a new local high.
To confirm that it is not a trap, you will need a break of THAT structure on a 4H time frame.
It will increase the probabilities that the entire bullish movement that you see on a daily is not a manipulation.
Here is what exactly we need.
After the price violated a daily structure and closed above that, we see a minor intraday retracement on a 4h time frame.
A bullish violation of the last high there is our BoS confirmation and a clear indicator of the strength of the buyers.
You can execute a buy trade, following a simple strategy then.
Set a buy limit order on a retest of a broken high on a 4H,
a stop loss should be below the last higher low,
a take profit is based on the next supply zone on a daily.
To avoid the traps, a single time frame is not enough for profitable trading break of structure.
Learn to integrate multiple time frames in smart money concepts trading. It will help you make thousands of pips weekly.
❤️Please, support my work with like, thank you!❤️
I am part of Trade Nation's Influencer program and receive a monthly fee for using their TradingView charts in my analysis.

GOLD → Breakthrough of downward resistance, news ahead...FX:XAUUSD is recovering after a fairly prolonged decline, and there are signs of bullish sentiment on the chart, but caution is advised as important news is ahead...
Gold is in a holding pattern. Its short-term fate depends on today's US economic data and, to a greater extent, on tomorrow's speech by Powell, which will set the tone for the future. The price is recovering slightly after a recent decline, but is trading cautiously.
The market is awaiting the release of S&P Global's business activity indices (PMI), which will assess the strength of the US economy and influence Fed rate forecasts. Another key event of the week is the Fed chair's speech in Jackson Hole on Friday. His comments on future interest rates will determine the further movement of gold and the dollar.
Technically, we are seeing a rebound from the support of a global symmetrical triangle, with bulls still in the market but waiting for further signals. Locally, we are seeing positive dynamics — a breakout of downward resistance and consolidation in the buying zone...
Resistance levels: 3350, 3370
Support levels: 3331, 3315
The conditions for further growth should be a positive fundamental background and the bulls holding the price above key support. A retest of the trading range boundary (0.5f) is possible before growth.
Best regards, R. Linda!

GOLD → Consolidation and news. What are the chances for growth?FX:XAUUSD is consolidating in a symmetrical triangle pattern. Market uncertainty remains high. The global trend is bullish, while the local trend is neutral. What can we expect from gold?
Gold is falling ahead of Powell's speech in Jackson Hole. The dollar is strengthening on strong US economic data (housing sales and PMI growth), which reduces the likelihood of an early easing of Fed policy.
Key factors:
Powell may confirm a cautious approach to rate cuts. The probability of a rate cut in September has fallen to 75%. The rise of the dollar as a “safe haven” is putting pressure on gold
Scenarios after the speech:
Hawkish tone from Powell → dollar rises → gold falls below $3300.
Soft signal → dollar correction → gold recovery
Technically , the gold casino continues and it is difficult to determine in advance which way the symmetrical triangle will break, but if we bet on a bullish trend and the likelihood of an imminent interest rate cut, the most likely scenario is a rebound from the support zone followed by a breakout of resistance and a rise to local levels
Resistance levels: 3350, 3358, 3370
Support levels: 3323, 3320, 3315
A false breakout of the key support level, which is being defended quite aggressively by the bulls, could trigger an active recovery phase. However, it is important to keep an eye on Powell's speech, as well as Trump's, who will also be commenting this afternoon.
Best regards, R. Linda!

GOLD → Attempt to break through 3350 for a retest of 3370FX:XAUUSD is stagnating in a range, awaiting a driver. The price is consolidating, with boundaries narrowing and forming a symmetrical triangle...
Gold is trying to consolidate above $3,350 after falling to an 11-day low of $3,325 amid geopolitical uncertainty. Markets are awaiting Trump's talks with Zelensky, which will be joined by European leaders, hoping for a quick peace agreement on Ukraine. However, general optimism is limiting demand for “safe assets.” Expectations of a dovish Fed policy and the possible lifting of sanctions against Russia are adding to the positive sentiment. At the same time, gold risks a correction if the dollar strengthens amid profit-taking ahead of the Fed minutes and Jerome Powell's speech in Jackson Hole.
Technically, if gold can break through the 3350 level, the market may test the 3370 resistance in the short term, but then return to support due to uncertainty.
Resistance levels: 3350, 3370, 3400
Support levels: 3331, 3315, 3301
At the moment, since the price is in a range, it is worth considering an intrarange trading strategy: false breakouts or rebounds from strong levels. I think that until a strong driver appears, gold will remain within the specified range.
Best regards, R. Linda!
XAUUSD: Fake Out Confirms Bearish Pressure, Eyeing 3323 & 3314Hello guys.
We recently saw a fake-out above the descending channel, which trapped early buyers and confirmed that sellers are still in control. Despite the QML formation in the highlighted zone, the bearish pressure remains dominant.
As long as the price trades below the fake-out high, the overall trend continues to point downward. My immediate downside targets are:
3323 (first key level)
3314 (secondary target, potential liquidity grab zone)
If sellers manage to hold momentum, we could see a continuation deeper into the channel.
⚠️ Keep in mind that a clean break above the fake-out level would invalidate this bearish outlook.

GOLD 1H CHART ROUTE MAP UPDATE & TRADING PLAN FOR THE WEEKHey Everyone,
Please see our updated 1h chart levels and targets for the coming week.
We are seeing price play between two weighted levels with a gap above at 3352 and a gap below at 3327. We will need to see ema5 cross and lock on either weighted level to determine the next range.
We will see levels tested side by side until one of the weighted levels break and lock to confirm direction for the next range.
We will keep the above in mind when taking buys from dips. Our updated levels and weighted levels will allow us to track the movement down and then catch bounces up.
We will continue to buy dips using our support levels taking 20 to 40 pips. As stated before each of our level structures give 20 to 40 pip bounces, which is enough for a nice entry and exit. If you back test the levels we shared every week for the past 24 months, you can see how effectively they were used to trade with or against short/mid term swings and trends.
The swing range give bigger bounces then our weighted levels that's the difference between weighted levels and swing ranges.
BULLISH TARGET
3352
EMA5 CROSS AND LOCK ABOVE 3352 WILL OPEN THE FOLLOWING BULLISH TARGETS
3374
EMA5 CROSS AND LOCK ABOVE 3374 WILL OPEN THE FOLLOWING BULLISH TARGET
3398
EMA5 CROSS AND LOCK ABOVE 3398 WILL OPEN THE FOLLOWING BULLISH TARGET
3422
BEARISH TARGETS
3327
EMA5 CROSS AND LOCK BELOW 3327 WILL OPEN THE SWING RANGE
3304
3281
As always, we will keep you all updated with regular updates throughout the week and how we manage the active ideas and setups. Thank you all for your likes, comments and follows, we really appreciate it!
Mr Gold
GoldViewFX

XAUUSDHello Traders! 👋
What are your thoughts on GOLD?
Gold failed to break through the key resistance zone near the recent highs and got rejected. Additionally, the ascending trendline has been broken, with price now trading below it.
While the long-term outlook remains bullish, the short-term bias has shifted to bearish, and we expect further downside toward the next support levels.
Don’t forget to like and share your thoughts in the comments! ❤️

THE KOG REPORT THE KOG REPORT:
In last week’s KOG Report we said we would be looking for the red box defence and potential target to hold us down and then expect a move downside unless broken. This move played well and as you can see the red box defence downside was broken, ultimately leading to us completing the move we wanted into the target level completing all the targets below before then getting that bounce from the exact level giving us the long trade.
It was only in the latter part of the week we experienced more choppy price action but red boxes worked well as did the path we had plotted out over the week.
So, what can we expect in the week ahead?
For this week we’re going to keep it short as we would like to put together further analysis and plans for the upcoming Jackson Hole symposium like we have been sharing over the last few years.
So we will start with the higher level 3350-55 which is the order region and has a hotspot. We have the lower level 3320-23 which is key level support for the opening, a tap into this level with rejection can give us the move upside into that 3350-55 level which is the level that needs to hold us down. There is an extension to this move and it’s towards that 3365 level so we have to keep that in mind.
If we break below the defence box, it’s very likely that we will be visiting the 3310-6 level initially while there sits a potential target level at the 3300-3295 level. We’re expecting a range here of 3380 and 3290 as potential for the first part of the week.
We’ll release the Jackson hold analysis and trade ideas towards the middle of the week. For now, that’s all.
KOG’s Bias of the week:
Bearish below 3355 with targets below 3330, 3320, 3317, 3310, 3306 and below that 3295
Bullish on break of 3360 with targets above 3365, 3371, 3375, 3385 and above that 3392
KOGS RED BOX TARGETS:
Break above 3337 for 3340, 3346, 3350, 3355 and 3363 in extension of the move
Break below 3317 for 3310, 3306 and 3301 in extension of the move
Please do support us by hitting the like button, leaving a comment, and giving us a follow. We’ve been doing this for a long time now providing traders with in-depth free analysis on Gold, so your likes and comments are very much appreciated.
As always, trade safe.
KOG

Gold 30Min Engaged ( Buy & Sell / Break Out Entry Detected )Time Frame: 30-Minute Warfare
Entry Protocol: Only after volume-verified breakout
🩸Bullish After break - 3342
🩸Bearish After Break Out - 3327
➗ Hanzo Protocol: Volume-Tiered Entry Authority
➕ Zone Activated: Dynamic market pressure detected.
The level isn’t just price — it’s a memory of where they moved size.
Volume is rising beneath the surface — not noise, but preparation.
🔥 Tactical Note:
We wait for the energy signature — when volume betrays intention.
The trap gets set. The weak follow. We execute.
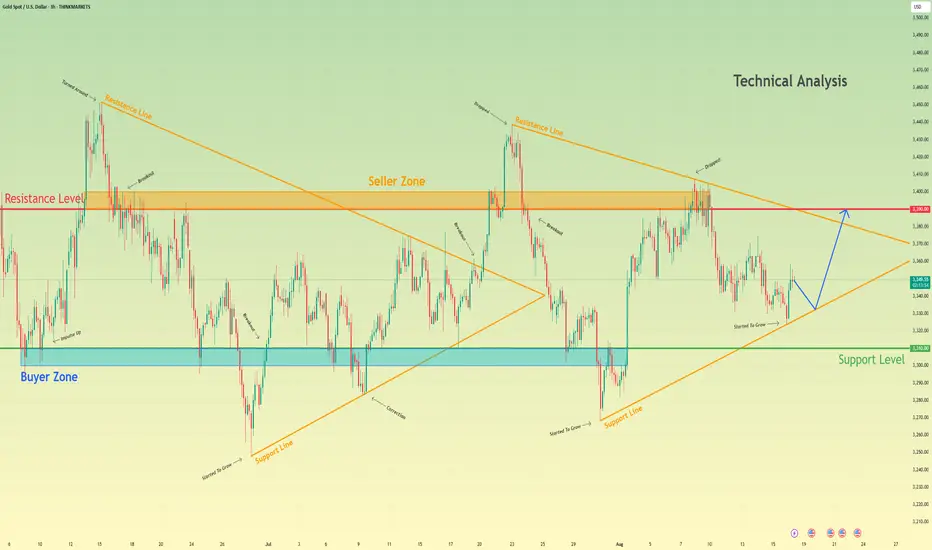
Gold can make correction and then continue to move upHello traders, I want share with you my opinion about Gold. The price market is currently in a state of equilibrium, consolidating within a large symmetrical triangle after a significant upward rebound from the recent lows near the 3310 buyer zone. This reversal invalidated the prior downward trend and has since forced the price into a period of balance, characterized by contracting volatility between a descending resistance line and an ascending support line. The price has been methodically rotating within this structure, with the seller zone around the 3390 resistance level consistently rejecting bullish attempts. At present, the asset is undergoing another downward correction, approaching the critical ascending support line of the triangle for a key test. The primary working hypothesis is a long scenario, based on the expectation that buyers will once again defend this dynamic support and maintain the integrity of the consolidation pattern. A confirmed and strong bounce from this support line would signal the start of another major upward rotation within the triangle. Therefore, the tp for this long idea is strategically placed at the 3390 level. Please share this idea with your friends and click Boost 🚀
Disclaimer: As part of ThinkMarkets’ Influencer Program, I am sponsored to share and publish their charts in my analysis.
XAUUSD Bearish SetupGold (XAUUSD) is trading around 3349, showing signs of bearish momentum after multiple rejections from the upper resistance zone. Price may retest 3312 before extending lower toward the key target zone near 3270. Resistance remains strong at 3377, while a breakdown below 3312 could accelerate the downside move.

What Bees Can Teach Us About Trading!At first glance, bees and trading seem worlds apart. But look closer, and you’ll find powerful lessons traders can learn from the hive:
🏗️ Discipline & Structure
Every bee knows its role and sticks to it. Traders too must follow their plan with precision.
🛡️ Risk Management
Forager bees never all leave at once; they manage risk for the colony. Traders should also protect capital and avoid going “all in” on one setup.
🔍 Pattern Recognition
Bees know when and where to collect nectar. Traders rely on recognizing price patterns and market cycles.
⏳ Patience & Consistency
A single bee’s contribution is small, but millions of trips create honey. Trading success also comes from consistent small gains that compound.
🧘 Emotional Control
Bees don’t let fear or greed guide them; they follow their system. The same applies to traders who stay calm and disciplined.
👉 In short: Trade like a bee — structured, patient, and focused on the bigger picture.
📚 Always follow your trading plan regarding entry, risk management, and trade management.
Good luck!
All Strategies Are Good; If Managed Properly!
~Richard Nasr
Disclosure: I am part of Trade Nation's Influencer program and receive a monthly fee for using their TradingView charts in my analysis.

XAUUSD – Watching 3,310 as Price Pulls BackHey Traders, in today's trading session we are monitoring XAUUSD for a buying opportunity around 3,310 zone, Gold (XAUUSD) has been moving lower after its recent swing high, with price now correcting toward the 3,310 area.
Structure: The broader bias has been bullish overall, but recent price action shows a corrective move.
Key level in focus: 3,310 — previously acted as support/resistance.
Next move: Holding above this zone could maintain the medium-term bullish bias, while a clear break below may open the way for deeper retracement.
Monitoring how price behaves around 3,310 to understand whether buyers will step in or if weakness continues.
Trade safe, Joe.

Gold 30Min Engaged ( x2 Bullish Entry Detected )Time Frame: 30-Minute Warfare
Entry Protocol: Only after volume-verified breakout
🩸Bullish Reversal - 3343
🩸Bullish Break Out - 3358
➗ Hanzo Protocol: Volume-Tiered Entry Authority
➕ Zone Activated: Dynamic market pressure detected.
The level isn’t just price — it’s a memory of where they moved size.
Volume is rising beneath the surface — not noise, but preparation.
🔥 Tactical Note:
We wait for the energy signature — when volume betrays intention.
The trap gets set. The weak follow. We execute.
XAUUSD I Daily range I Key Level - OB I Target Daily HighsDailyrange was manipulated and price reacted at the order block followed by rejection and OB creation = Its bullish now.
Targeting mid range and then full range highs.
Let me know your opinions
Good luck
David Perk aka Dave FX Hunter

Gold Market Update and SWING Trade Plan with SL/TP ________________________________________
📊 Gold Technical Outlook Update – H4 & 2H Chart
📰 Latest Summary Headlines
• 🟡 Gold edges firmer as weaker USD provides short-term lift.
• 📉 Technical compression on charts signals potential sharp move.
• ⚠️ Rising wedge formation hints at possible breakdown risk.
• 🎯 Traders eye a slide toward $3,225 if bearish pattern confirms.
________________________________________
🏆 Market Overview
• 💰 Current gold price hovers near $3,345–3,348 per ounce, consolidating in a tight range.
• 🔄 Price action remains choppy, with no breakout beyond key levels in recent sessions.
• ⛔ Strong resistance sits at $3,410–3,420 USD, keeping rallies capped.
• ⚖️ Major support remains at $3,300–3,310 USD, forming the lower boundary of the range.
• 💱 Market sentiment is driven by softer USD and yields, with gold unable to gain decisive momentum.
• 🌪️ Volatility expected to persist as traders await stronger catalysts.
________________________________________
⭐️ Recommended Trade Strategy
• 🎯 Bearish Setup (2H/H4): Short gold near $3,410–3,420 resistance.
• 🛑 Stop-loss: Above $3,430 recent highs.
• ✅ Take profit: Initial target $3,310 USD, extension to $3,300 USD.
• 📊 Range trading remains the favored play—sell near resistance, buy near support.
• ⚡ Stay nimble for sharp moves if the wedge pattern resolves.
• 🛡️ Risk management is critical: use tight stops and scale positions accordingly.
________________________________________
💡 Gold Market Highlights
• 🛡️ Safe-haven demand underpins gold as investors hedge against uncertainty.
• 🏦 Institutional flows remain strong, though short-term pullbacks are likely.
• 💥 Compression on charts suggests an explosive move once direction is chosen.
• 📈 Current market levels: Gold spot ~$3,345–3,348, ETF (GLD) trades around $307.
________________________________________
📌 Summary
• 📏 Gold remains locked in a multi-week range between $3,300 support and $3,410 resistance.
• 📉 The wedge pattern on short-term charts favors a potential breakdown toward $3,225.
• 🐻 Short-sellers should wait for confirmation, while 🐂 bulls will defend key support zones.
• 🧭 Tactical range trading remains the best approach until a decisive breakout occurs.
________________________________________

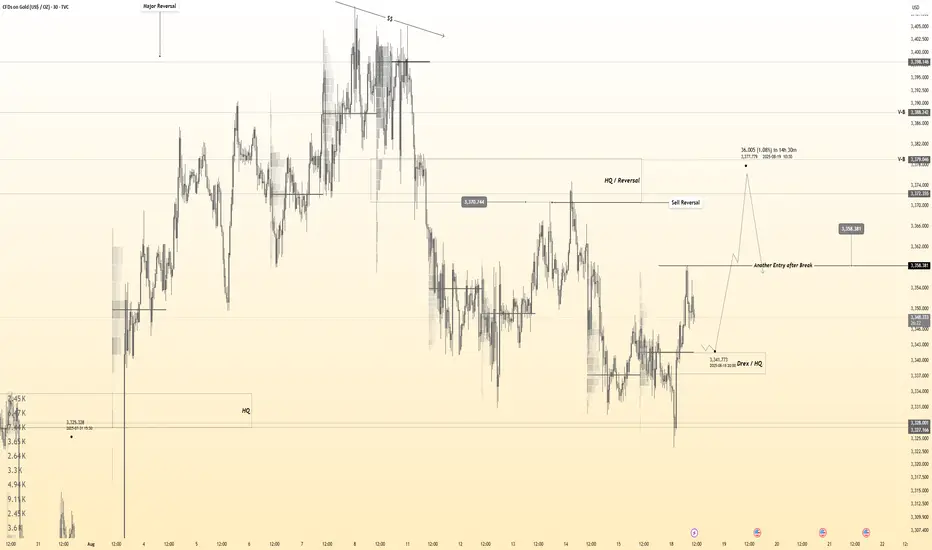
Gold Breaks Descending Trendline After Support RejectionHello guys!
Price touched the major support level at the recent low, confirming buyers’ activity.
After that, a QM (Quasimodo) pattern formed, often seen before reversals.
The descending trendline has been broken, showing weakness in bearish momentum and a potential shift to the upside.
A long entry can be considered in the QM blue zone, which is now acting as a demand area.
As long as price holds above this zone, the bias remains bullish, with potential for continuation higher.
