XAUUSDHello Traders! 👋
What are your thoughts on GOLD?
Gold remains trapped in a tight consolidation range between key support and resistance zones.
In the short term, the ongoing decline is expected to extend toward the support area, where a bullish reaction may occur.
As long as price stays within this range, the optimal strategy is to buy near support and sell near resistance.
A clear breakout above resistance or below support is needed to confirm the next directional move
Don’t forget to like and share your thoughts in the comments! ❤️
XAUUSD trade ideas

Lingrid | GOLD Broke Above Corrective Dynamic ResistanceOANDA:XAUUSD is attempting to recover after a strong sell-off from the resistance zone, with price currently testing the compression channel breakout. Structure highlights a descending sequence with a lower high, flag formations, and a downward trendline keeping the sideways tone intact. If the breakout holds above the compression channel, price could push toward 3,380, but rejection may open room back into deeper support. Broader momentum shows a corrective bearish leg softening, with potential bullish relief rally if buyers defend current levels.
📉 Key Levels:
Buy trigger: Sustained breakout above 3,320 support-turned-resistance.
Buy zone: 3,320–3,330, if buyers maintain control after breakout.
Target: 3,380 near-term resistance.
Invalidation: Breakdown below 3,250 would negate bullish setup.
💡 Risks:
Failure to sustain breakout, leading to continuation of the downtrend.
Strong USD momentum from macroeconomic releases could weigh on gold.
Geopolitical risk shifts that reprice safe-haven demand unpredictably.
If this idea resonates with you or you have your own opinion, traders, hit the comments. I’m excited to read your thoughts!

Lingrid | GOLD Clings to Critical Support ZoneOANDA:XAUUSD has been consolidating, moving inside a descending channel after a sharp rejection from resistance. Structure shows a wedge followed by a triangle pattern inside the downward trendline, pointing to compression before a potential breakout. A bullish scenario opens if price bounces from support near 3,315 and breaks above the 3,380 resistance handle. Overall, broader context shows gold locked in a sideways move but coiling into a corrective structure that could fuel a bullish rally.
📉 Key Levels:
Buy trigger: Rejection at 3,320
Buy zone: 3,310–3,320 support area.
Target: 3,380 then 3,431.
Invalidation: Sustained close below 3,270 support.
💡 Risks:
Failure to break the downward trendline, keeping bearish momentum intact.
Weak buying volume near support, leading to breakdown continuation.
Broader macro pressure from USD strength or yields limiting upside momentum.
If this idea resonates with you or you have your own opinion, traders, hit the comments. I’m excited to read your thoughts!

XAU/USD | Breakout or Pullback? (READ THE CAPTION)By analyzing the gold chart on the 4-hour timeframe, we can see that after Jerome Powell’s speech on Friday, where he hinted at the possibility of upcoming interest rate cuts, gold experienced a strong bullish rally and surged up to $3379! Currently, gold is trading around $3373, and if the price manages to stabilize below $3379, we could expect a potential pullback towards lower levels to fill the FVG area.
However, if the price breaks above $3380, we may see further upside momentum, with the next bullish targets set at $3385 and $3398. This analysis will be updated soon depending on which scenario plays out, so stay tuned for the upcoming updates!
Please support me with your likes and comments to motivate me to share more analysis with you and share your opinion about the possible trend of this chart with me !
Best Regards , Arman Shaban

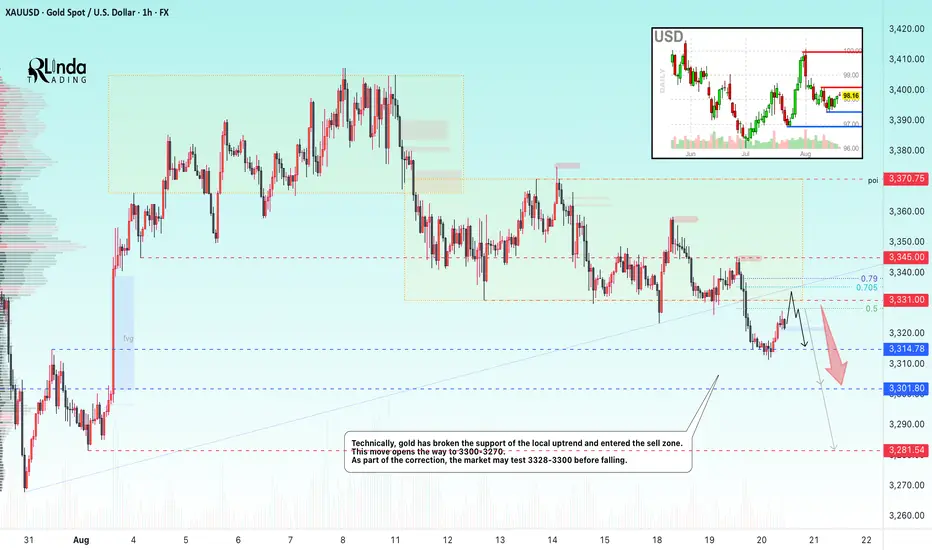
GOLD → Correction and retest of a previously broken level...FX:XAUUSD breaks through the support of the local consolidation “symmetrical triangle” and falls to a minimum of 3311...
Gold remained at a three-week low of around $3,300 in Asian trading on Wednesday as markets awaited the Fed minutes and Powell's speech in Jackson Hole. The dollar is strengthening on expectations that the Fed chair will reject the idea of aggressive rate cuts despite weak labor market and inflation data. The probability of a rate cut in September is estimated at 85%. Strong housing market data and news about negotiations on Ukraine provided additional support to the dollar. Powell's comments on Friday remain the key factor for gold, while current movements are mainly technical in nature.
Resistance levels: 3328, 3331, 3345
Support levels: 3314, 3300, 3328
Technically, a correction is forming after a bearish rally. As part of the correction, the price may test the zone of interest, which is represented by local resistance levels. Distribution could bring the price to 3300-3270.
Best regards, R. Linda!
Lingrid | GOLD Weekly Market Analysis: Triangle Breakout AttemptThe price perfectly fulfilled my previous weekly outlook . OANDA:XAUUSD has closed around $3,371 as the market approaches a critical juncture within a well-defined triangle consolidation pattern. The recent price action suggests accumulation near key support levels with potential for a decisive directional move ahead.
Current timeframe reveals gold forming a classic triangle pattern over month, with the apex narrowing as volatility contracts. The $3,310 level has emerged as crucial support, representing a higher low formation that maintains the bullish structure. Above, the resistance zone around $3,440 continues to cap upside attempts, creating the horizontal ceiling of the triangle.
The daily timeframe shows fake break at both resistance and support levels, indicating institutional players are testing liquidity before committing to larger positions. The current positioning near $3,350 support suggests gold is building energy for the next significant move, with its apex where resolution typically occurs in explosive fashion.
A notable price projection annotation indicates potential future movement based on historical price action, suggesting the market may be preparing for a significant directional move. This technical forecast aligns with the triangle's measured move potential, highlighting the importance of the current consolidation phase as the pattern nears completion.
Next week key levels to monitor include the $3,350 support floor and the $3,410-$3,440 resistance ceiling. A clean break above $3,440 with volume would target the $3,500+ area, while failure at current support could see a retest of the $3,270 zone. The downward trendline from the July peak continues to act as dynamic resistance, requiring a sustained break to confirm bullish continuation. Triangle patterns often produce moves equal to their widest point, suggesting potential for significant volatility once resolution occurs.
If this idea resonates with you or you have your own opinion, traders, hit the comments. I’m excited to read your thoughts!

Break of Structure VS Liquidity Grab. How to Identify Valid BoS
The main problem with break of structure trading is that you can easily confuse that with a liquidity grab.
But don't worry.
There is a secret SMC price model that will help you to confirm a break of structure in a second.
Learn smart money concepts trading secrets and a simple strategy to trade break of structure on any forex pair.
Let's study a break of structure that I spotted on AUDUSD forex pair.
We see that the market is bullish on a daily time frame and the price has just violated a previous high with a break of structure.
The issue with that is the fact that such a violation can easily be a liquidity grab and a bullish trap .
Buying the market immediately after a BoS, we can incur a huge loss .
We need something that would help us to accurate validate that.
Fortunately, there is a simple price model in SMC that will help.
After you spotted a break of structure on a daily time frame,
use a 4h time frame for its validation.
After a BoS on a daily time frame, the market usually starts retracing , setting a new local high.
To confirm that it is not a trap, you will need a break of THAT structure on a 4H time frame.
It will increase the probabilities that the entire bullish movement that you see on a daily is not a manipulation.
Here is what exactly we need.
After the price violated a daily structure and closed above that, we see a minor intraday retracement on a 4h time frame.
A bullish violation of the last high there is our BoS confirmation and a clear indicator of the strength of the buyers.
You can execute a buy trade, following a simple strategy then.
Set a buy limit order on a retest of a broken high on a 4H,
a stop loss should be below the last higher low,
a take profit is based on the next supply zone on a daily.
To avoid the traps, a single time frame is not enough for profitable trading break of structure.
Learn to integrate multiple time frames in smart money concepts trading. It will help you make thousands of pips weekly.
❤️Please, support my work with like, thank you!❤️
I am part of Trade Nation's Influencer program and receive a monthly fee for using their TradingView charts in my analysis.

GOLD → The market is waiting for a kick (driver). ConsolidationFX:XAUUSD is in a stalemate. A “casino” pattern is forming in the form of a symmetrical triangle. The odds are 50/50, and everything depends on the fundamental background and the emergence of a driver.
Gold is stuck in a symmetrical triangle - consolidation.
Gold is trading around $3330 on Tuesday, remaining in a range with a downward bias amid caution among traders ahead of the Fed minutes.
Technically, it is possible to trade the breakout from consolidation with the price consolidating above a certain level, i.e., post-factum.
Optimism after the meeting between Trump and Zelensky, who promised to end the conflict, is reducing demand for safe assets, but expectations of a Fed rate cut this year are supporting the metal. An additional factor is the confirmation of the US rating by S&P. Powell's speech on Friday will be a key driver, while the dollar has partially recovered after its recent decline.
Resistance levels: 3349.8, 3370.7
Support levels: 3331, 3315, 3301
Volatility has been very low over the past few days, with the market waiting for someone to kick-start movement. Fundamental factors are contradictory, and technically, gold looks uncertainly weak. Based on this, I expect that a retest of the nearest resistance could end with a downward breakdown from consolidation.
Sincerely, R. Linda!

Gold Key Level at 3357 –> Breakout or Breakdown?Hello guys!
Let's analyze gold!
Gold is testing a critical zone around 3357.
If price breaks below 3357 , we can expect another drop towards the 3337 support area.
But if 3357 holds as support, then a bullish continuation is likely, with buyers pushing price higher.
This makes 3357 the decisive level to watch for the next move.

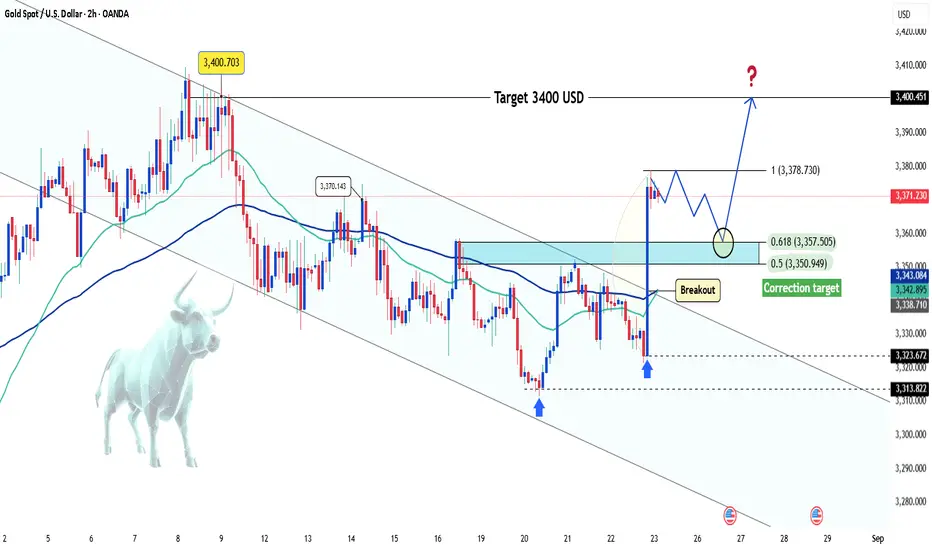
Gold's Explosive SurgeHello everyone, let’s dive into how OANDA:XAUUSD is moving!
Yesterday, just as we expected , gold made an impressive surge. The precious metal rocketed upwards from the 3321 USD range, hitting 3378 USD, gaining more than 500 pips in a short time.
So, what’s behind this move? The answer lies in the speech by Fed Chair Jerome Powell.
His remarks at the Jackson Hole symposium sent shockwaves through the market. Powell emphasized that the Fed might pause or even reduce interest rates soon due to concerns about the negative impact on the economy.
This has weakened the USD, providing an opportunity for gold (XAUUSD) to rise sharply. As the USD loses value, gold becomes a safe-haven for investors, pushing prices higher.
From a technical perspective, gold has overcome its previous downtrend, successfully conquering the 3370 USD peak. A trend correction could occur, but given the favorable environment, the upward trend still holds dominance. Watch for the 3400 USD level, as that’s our next target.
Do you agree with my analysis? Drop your thoughts in the comments and don’t forget to like the post—I’d really appreciate it!
Good luck!
GOLD → Breakthrough of downward resistance, news ahead...FX:XAUUSD is recovering after a fairly prolonged decline, and there are signs of bullish sentiment on the chart, but caution is advised as important news is ahead...
Gold is in a holding pattern. Its short-term fate depends on today's US economic data and, to a greater extent, on tomorrow's speech by Powell, which will set the tone for the future. The price is recovering slightly after a recent decline, but is trading cautiously.
The market is awaiting the release of S&P Global's business activity indices (PMI), which will assess the strength of the US economy and influence Fed rate forecasts. Another key event of the week is the Fed chair's speech in Jackson Hole on Friday. His comments on future interest rates will determine the further movement of gold and the dollar.
Technically, we are seeing a rebound from the support of a global symmetrical triangle, with bulls still in the market but waiting for further signals. Locally, we are seeing positive dynamics — a breakout of downward resistance and consolidation in the buying zone...
Resistance levels: 3350, 3370
Support levels: 3331, 3315
The conditions for further growth should be a positive fundamental background and the bulls holding the price above key support. A retest of the trading range boundary (0.5f) is possible before growth.
Best regards, R. Linda!

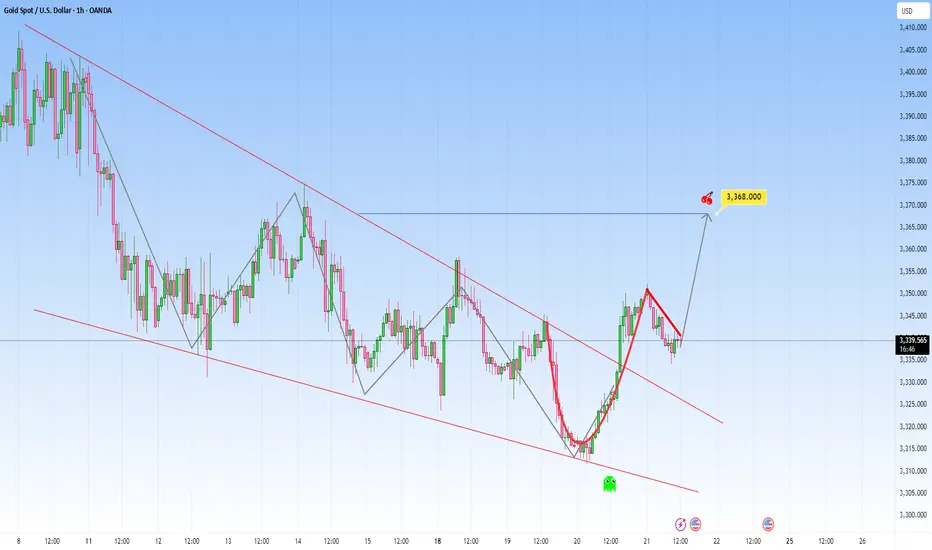
Cup and handle pattern spotted: Optimistic view for GoldOANDA:XAUUSD is showing a clean Cup and Handle setup. The price dipped to around 3,310, rounded out, and climbed back to the 3,350–3,360 zone, that’s our cup. Now it's pulling back slightly into a tight handle.
If price breaks above it with strength, I’d be expecting a move toward 3,368$. Until then, it’s a waiting game, no breakout, no trade.
Classic bullish setup forming, as anticipation is building up.
GOLD → Consolidation and news. What are the chances for growth?FX:XAUUSD is consolidating in a symmetrical triangle pattern. Market uncertainty remains high. The global trend is bullish, while the local trend is neutral. What can we expect from gold?
Gold is falling ahead of Powell's speech in Jackson Hole. The dollar is strengthening on strong US economic data (housing sales and PMI growth), which reduces the likelihood of an early easing of Fed policy.
Key factors:
Powell may confirm a cautious approach to rate cuts. The probability of a rate cut in September has fallen to 75%. The rise of the dollar as a “safe haven” is putting pressure on gold
Scenarios after the speech:
Hawkish tone from Powell → dollar rises → gold falls below $3300.
Soft signal → dollar correction → gold recovery
Technically , the gold casino continues and it is difficult to determine in advance which way the symmetrical triangle will break, but if we bet on a bullish trend and the likelihood of an imminent interest rate cut, the most likely scenario is a rebound from the support zone followed by a breakout of resistance and a rise to local levels
Resistance levels: 3350, 3358, 3370
Support levels: 3323, 3320, 3315
A false breakout of the key support level, which is being defended quite aggressively by the bulls, could trigger an active recovery phase. However, it is important to keep an eye on Powell's speech, as well as Trump's, who will also be commenting this afternoon.
Best regards, R. Linda!

Gold Watching 3,360 Support as Powell Dovish Tone Weighs on USDHey Traders, in tomorrow's trading session we are monitoring Gold for a buying opportunity around 3,360 zone, Gold (XAUUSD) recently broke above the 3,360 resistance, turning it into an important support level to watch on any pullback. A retracement into this zone could help determine whether the breakout has strength to extend toward higher levels.
On the fundamental side, Fed Chair Powell struck a dovish tone, signaling support for a potential September rate cut, citing lower inflation pressures and risks in the labor market. This backdrop keeps USD under pressure and maintains a bullish bias for Gold in the near term.
Monitoring price action around 3,360 to assess whether buyers defend this level or if deeper consolidation unfolds.
Trade safe, Joe.

THE KOG REPORTTHE KOG REPORT
In last week’s KOG Report we said we would be looking for price to test that 3550-55 region and hopefully get a rejection there taking us downside into the lower levels and targets. This move worked well, although we got 3358 it completed into the red box defence. It’s at that defence level and the one below that we said opportunities to long may arise, which as you can see they did.
We then released the back test and report for Jackson hole mid-week. In this report we said we would be looking for a test on the low, and as long as it held we should see price push upside into the red box target levels. Again, a point to point, level to level move on this report hitting that target to a tee on the close!
So, what can we expect in the week ahead?
For this week we’re going to stick with the Jackson Hole report for the first couple of days of the week.
As you can see from last week the low held us well and the move completed into the red box that we wanted. We did have a arrow down here suggesting a short, and there was a reaction from this point, however, it’s a new week now so we’ll play price up here.
We have resistance above at the 3385-90 level with support below at the 3365-70 level. These are the levels that need to be watched hence we’ve put a range box on the chart. What we’re looking for here is price to attempt to play between the red boxes and inside this range due to there being now news in the early part of the week.
If we break above and support 3370, we’re likely to see this attempt the break of 3400 but the first destination is only slightly above 3420-25. A break below and we would hope to see price correct the whole move from Jackson Hole before then again attempting to rise, which for us is the ideal scenario here.
What we want traders to understand is that although we saw volume for Jackson Hole, we’re still playing the same range we’ve been in for the last two months. Price is simply in one huge accumulation before a bigger breakout!
That’s all for this report, as always, we’ll update as we go along through the week.
RED BOX TARGETS:
Break above 3375 for 3378, 3383, 3385, 3388 and 3392 in extension of the move
Break below 3365 for 3355, 3351, 3345 and 3335 in extension of the move
Please do support us by hitting the like button, leaving a comment, and giving us a follow. We’ve been doing this for a long time now providing traders with in-depth free analysis on Gold, so your likes and comments are very much appreciated.
As always, trade safe.
KOG

Gold Breaks Descending Trendline After Support RejectionHello guys!
Price touched the major support level at the recent low, confirming buyers’ activity.
After that, a QM (Quasimodo) pattern formed, often seen before reversals.
The descending trendline has been broken, showing weakness in bearish momentum and a potential shift to the upside.
A long entry can be considered in the QM blue zone, which is now acting as a demand area.
As long as price holds above this zone, the bias remains bullish, with potential for continuation higher.

Gold Targets Historic Resistance ZoneHello, what do you think about the trend of OANDA:XAUUSD ?
Gold has just posted a strong rally following the Jackson Hole speech, where Fed Chair Jerome Powell signaled a more dovish stance and left the door open for potential rate cuts in the near future. The U.S. dollar and bond yields eased, creating favorable conditions for gold to climb higher. At present, the precious metal is trading around 3,371 USD and continues its upward momentum.
From a technical perspective, the chart is shaping an ascending triangle pattern with a flat resistance zone in the 3,400–3,450 range and a rising trendline providing support below. This formation typically signals the continuation of an uptrend. Should the price break out and close above this resistance area, higher targets will open up — aligning with my long-term outlook.
A clear breakout above this critical resistance zone is needed to confirm the next directional move.
What about you — how do you see gold’s next move? Share your ideas and thoughts in the comments.
Good luck!

GOLD → Correction before continuing distribution to 3400FX:XAUUSD entered a correction phase at the start of the session after Friday's rally, triggered by positive fundamentals...
Gold is falling after Friday's rise, triggered by Powell's unexpectedly dovish comments in Jackson Hole. He confirmed the Fed's readiness to cut rates in September amid risks to employment and economic growth. The probability of a September rate cut has risen to 88%.
Gold is correcting after a sharp jump, but the downside potential is limited. Market attention is focused on PCE inflation data this week
Technically, the decline in gold prices may be temporary as the market continues to reassess the prospects for the Fed's dovish policy. The key factor will be Friday's PCE data, which will confirm or adjust expectations for an aggressive rate cut.
Support levels: 3358, 3350, 3340
Resistance levels: 3375, 3405
The 3358-3350 area acts as a strong support zone, and it is also worth paying attention to the previously broken downward consolidation resistance. The market may test the support zone before rising, and a false breakdown and consolidation above the support level could have a bullish impact on the market...
Best regards, R. Linda!

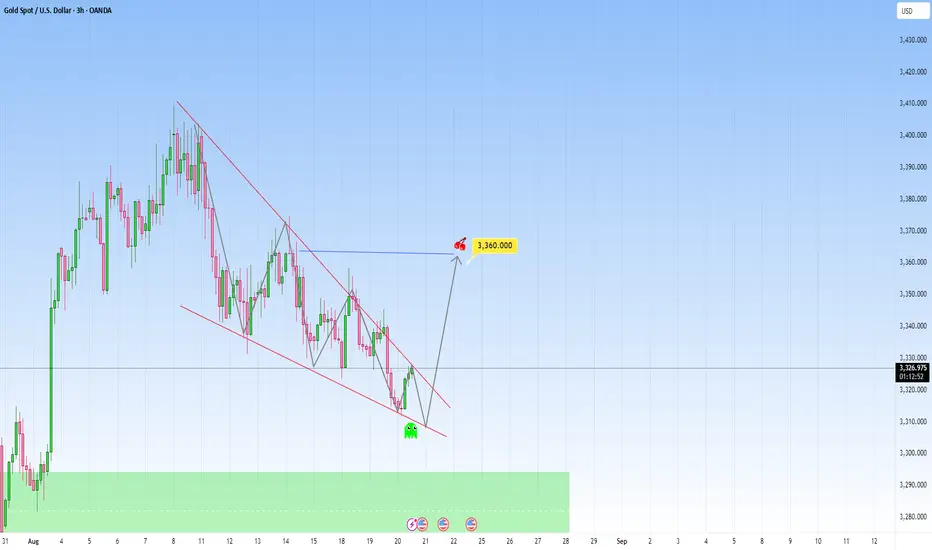
Gold in a falling wedge pattern: Ready for a strong ride upPrice on XAUUSD looks quite interesting right now, this recent has brought a new look to it, as it's forming a more optimistic pattern.
The most recent interaction here is particularly interesting, because it's already showing early signs of recovering and decreased bearish momentum. What may follow: low-volume candles suggesting exhaustion and potential upwards.
My target would be toward 3360. If this move plays out, it will make a beautiful play of a narrative that’s we've been following for Gold.
This setup is so compelling. It’s a story being shown, but still requires patience and confirmation.
Though a scenario for more downside is possible as we have a clear support zone below. Still, I am taking the side for more upside because of the pattern forming here.
Dow Theory: Unlocking Market Trends for Consistent ProfitsDow Theory is the foundation of modern technical analysis. Developed by Charles H. Dow in the late 19th century, this theory asserts that the market reflects all information and price movements always follow identifiable trends. To this day, Dow Theory remains a "compass" for traders in understanding price behavior.
6 Core Principles of Dow Theory:
The Market Reflects All
Price includes all information: news, expectations, psychology, and economic data. Therefore, the chart is the most reliable source of information.
The Market Has 3 Trends
Primary Trend: Lasts for several months to years.
Secondary Trend: Adjustments within the primary trend, usually lasting a few weeks.
Minor Trend: Fluctuates over a few days, less significant.
The Primary Trend Has 3 Phases
Accumulation: Smart investors quietly buy.
Public Participation: Large capital flows in, and the trend becomes clear.
Distribution: Large institutions begin to offload, preparing for reversal.
Indices Must Confirm Each Other
Dow used the industrial and railroad indices; today, this means trends are only valid when multiple markets/inter-markets confirm the same direction.
Volume Confirms the Trend
In an uptrend, volume should increase when the price rises and decrease during corrections. The opposite is true for downtrends.
Trends Continue Until Clear Reversal Signals Appear
Traders shouldn’t try to pick bottoms or tops, but rather follow the trend until there's confirmation of a change.
Practical Significance for Traders:
Helps identify the main trend to follow the big money.
Aids in risk management by avoiding trading against the trend.
Provides a comprehensive view: price, volume, and market phases.
GOLD 1H CHART ROUTE MAP UPDATE & TRADING PLAN FOR THE WEEKHey Everyone,
Please see our updated 1h chart levels and targets for the coming week.
We are seeing price play between two weighted levels with a gap above at 3390 and a gap below at 3365. We will need to see ema5 cross and lock on either weighted level to determine the next range.
We will see levels tested side by side until one of the weighted levels break and lock to confirm direction for the next range.
We will keep the above in mind when taking buys from dips. Our updated levels and weighted levels will allow us to track the movement down and then catch bounces up.
We will continue to buy dips using our support levels taking 20 to 40 pips. As stated before each of our level structures give 20 to 40 pip bounces, which is enough for a nice entry and exit. If you back test the levels we shared every week for the past 24 months, you can see how effectively they were used to trade with or against short/mid term swings and trends.
The swing range give bigger bounces then our weighted levels that's the difference between weighted levels and swing ranges.
BULLISH TARGET
3390
EMA5 CROSS AND LOCK ABOVE 3390 WILL OPEN THE FOLLOWING BULLISH TARGETS
3422
EMA5 CROSS AND LOCK ABOVE 3422 WILL OPEN THE FOLLOWING BULLISH TARGET
3439
BEARISH TARGETS
3365
EMA5 CROSS AND LOCK BELOW 3365 WILL OPEN THE FOLLOWING BEARISH TARGET
3347
EMA5 CROSS AND LOCK BELOW 3347 WILL OPEN THE FOLLOWING BEARISH TARGET
3324
EMA5 CROSS AND LOCK BELOW 3324 WILL OPEN THE SWING RANGE
3304
3281
As always, we will keep you all updated with regular updates throughout the week and how we manage the active ideas and setups. Thank you all for your likes, comments and follows, we really appreciate it!
Mr Gold
GoldViewFX

XAUUSD – Bullish Outlook Confirmed1. Yesterday’s Context
In my yesterday’s analysis, I mentioned that although Gold had broken below the 3330 support, it was most probably a false break.
Yesterday’s price action confirmed this view: Gold pushed back above the broken level, accelerated higher, and even broke above the falling wedge trendline, reaching a high around 3352. On top of that, the daily chart closed with a strong bullish engulfing pattern.
________________________________________
2. The Key Question
Is this the start of a larger bullish continuation?
________________________________________
3. Why the Setup Looks Bullish
• False break below 3330 quickly reversed.
• Break above the falling wedge trendline = strong bullish signal.
• Daily bullish engulfing confirms momentum shift.
• Technical structure now favors continuation to the upside.
________________________________________
4. Trading Plan
At the time of writing, Gold is in a normal correction after yesterday’s strong rally.
• I remain bullish.
• I am looking to buy dips into support zones.
• Target: around 3380 as the next upside level of interest.
________________________________________
5. Final Note 🚀
The outlook remains unchanged: the bias is bullish, and yesterday’s breakout gives conviction that buying dips is the right strategy.
Disclosure: I am part of TradeNation's Influencer program and receive a monthly fee for using their TradingView charts in my analyses and educational articles.

XAUUSD: Fake Out Confirms Bearish Pressure, Eyeing 3323 & 3314Hello guys.
We recently saw a fake-out above the descending channel, which trapped early buyers and confirmed that sellers are still in control. Despite the QML formation in the highlighted zone, the bearish pressure remains dominant.
As long as the price trades below the fake-out high, the overall trend continues to point downward. My immediate downside targets are:
3323 (first key level)
3314 (secondary target, potential liquidity grab zone)
If sellers manage to hold momentum, we could see a continuation deeper into the channel.
⚠️ Keep in mind that a clean break above the fake-out level would invalidate this bearish outlook.
