XAUUSD: Channel Ride to the Top or Fakeout Incoming?Gold is moving inside an uptrend channel, building momentum after bouncing from support. Right now, price is testing the key zone 3344 – 3348 – this is where the market will decide its next move.
📊 MMFLOW Outlook
✅ Scenario 1: Trend continuation (main bias)
Holding above 3344 – 3348 keeps the bullish structure intact.
A clean breakout over 3348.7 opens the path to:
→ Target 1: 3361.2
→ Target 2: 3369.8 (top of the channel)
⚠️ Scenario 2: Deeper retest before the move
If price rejects 3348 – 3351, a dip back to 3334 is likely.
Buyers may step in here to reload positions and push price higher.
A break below 3334 would weaken the bullish setup short-term.
📌 Key Levels (NY Session):
Support: 3334 | 3344 – 3348
Resistance: 3361.2 | 3369.8
✨ MMFLOW Note:
👉 Bias stays bullish, but patience at liquidity zones is key.
👉 Follow the flow – manage risk before the market makes the move.
XAUUSD trade ideas

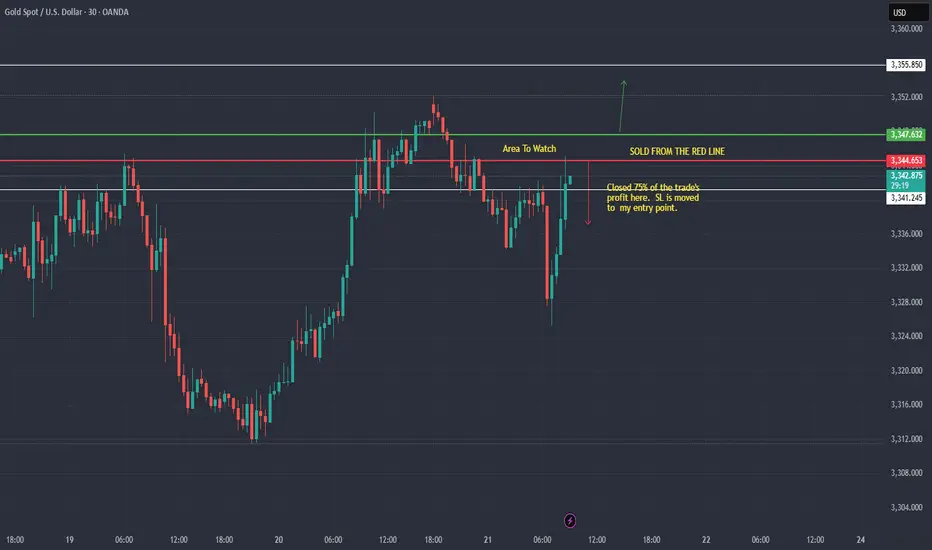
XAU / USD 30 Minute Chart ( scalp sell in progress)Hello traders. We just had news and although I missed the push up, I sold from the red line and just secured around 30 pips or so of profit. SL is now at my entry point, so no loss. 75% of the trade's profit was closed and secured, and my runner is running ( the remaining 25% of the trade). Big G gets a shout out. Let's see what the NY open does in half an hour. Be well and trade the trend. 30 pips may not sound like much, but when you are using a high leveraged account, that is all one needs. Thanks so much
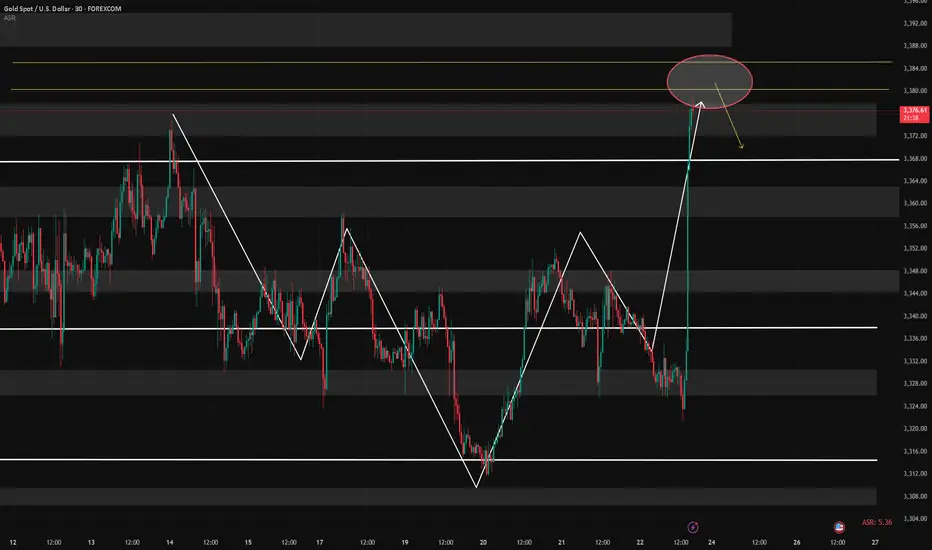
XAU / USD 4 Hour ChartHello traders. We had a nice little push up with gold. I have marked my current area of interest for potential short / long scalp trades. My feeling, which means nothing in trading, is that we may see a push down, but that remains to be seen. Let's see how the daily closes and what the overnight sessions bring. Be well and trade the trend. Big G gets a shout out as always.

How to correctly grasp the gold trading opportunities?Gold has been fluctuating recently, and the continuity is not strong. Don't chase long easily for the time being. Since it is a volatile market, then now it has rebounded to a high level, you should continue to short. Continue to short gold below 3350 in the US trading session. Gold bottomed out and rebounded in one hour. Although it seems that there has been a strong pullback, it is not certain that gold has reversed for the time being, but it is still within the range of large range fluctuations. Gold has not effectively broken through 3350 and stabilized, so it is still fluctuating in a large range. Continue to short gold in the US trading session. The market is changing rapidly, but gold has not formed a unilateral trend, so don't chase long easily. If gold falls back again and does not break the low point, then gold will continue to fluctuate.

XAUUSD Update | Gold Builds Energy Ahead of FOMCGold continues to consolidate within a tight range, with selling pressure becoming more visible. With just over a day left until the FOMC meeting – a key event that could set the tone for the next major trend – the market seems to be loading up for a liquidity sweep.
👉 While price action may look messy and indecisive, for KeyLevel traders, this is the perfect hunting ground. Liquidity zones are being respected with precision, offering clean setups for those who understand MMFLOW structures.
📉 Market Outlook
Primary Bias: Short-term corrective downside.
Possible Play: Liquidity grab into the 331x area before a strong rebound higher.
🔑 Key Trading Levels
Sell Zone: 3340 – 3345 | Tight SL: 4 – 5 pts
🎯 Targets: 3325 → 3317 → stretch 3310
📌 Note: Stay disciplined around these KeyLevels. One sharp BreakOut post-FOMC could trigger the next big directional move.
✨ As always with MMFLOW: KeyLevels = Profits ✅
🔥 Follow MMFLOW TRADING to catch daily setups, smart money footprints, and precision KeyLevels.

Gold (XAU/USD) Analysis – Daily PerspectiveGold is currently trading around 3,334 USD. From a daily perspective, the market shows a corrective structure with potential for further downside pressure. As long as the resistance zone around 3,366 USD is not broken convincingly, the bias remains bearish.
Downside targets are projected at 3,247 USD, with an extended move possible towards 3,145 USD (FE 1.618). A clear breakout above 3,366 USD, however, could shift the outlook and open the way for renewed bullish momentum.

Gold Plan M15 – Captain VincentContext:
The M15 chart shows price currently sitting right at the Premium Supply zone — a level that has repeatedly held and triggered bullish reactions in the past. However, with the short-term trend leaning bearish, this zone may no longer serve as a strong “shield.”
Today’s focus:
Sell in line with the main downtrend at the nearest resistance zone.
Buy from deeper levels if price breaks support and forms an FVG gap below.
1. Sell Zone – Premium Defense 🛡️
Entry: 3345 – 3347
SL: 3351
TP: 3343 → 3340 → 3337 → 3333 → 33xx
Meaning: A short-term resistance area, ideal for selling in line with the bearish momentum.
2. Buy Setup – Hidden FVG ⚓
Entry: Will wait at the lower FVG zone (to be updated once price approaches).
Meaning: If price breaks through the current Supply zone, shift bias to Buy at the lower FVG, taking advantage of a technical rebound.
Scenarios for today:
If price retests 3345 – 3347 → Sell with the trend.
If price breaks the Premium Supply zone → Watch for rebound strength and prepare to Buy at the lower FVG.
If neither zone is reached → Stay out, wait for a clear signal.
Captain’s Note:
“Lower timeframes like M15 are often stormy seas 🌊. Keep discipline: Sell only at the right zones, Buy only at the right levels, and never FOMO in the middle of the ocean. 🏴☠️”

Gold Intraday Trading Plan 8/18/2025According to my weekly forecast, gold should drop at least to the support lines around 3290-3300. Right now it is facing 3330 support. I will sell if this is broken or if it retests 3345 resistance. My target for today is 3300.

xausd Long.We have an Order block on 4 hours. Waiting for the pair to touch the fait value gap at the 3320 in order to go long at those zones. Lets see how it goes.

Gold is Ready For Bull After Forming a Strong SupportHello Traders
In This Chart GOLD HOURLY Forex Forecast By FOREX PLANET
today Gold analysis 👆
🟢This Chart includes_ (GOLD market update)
🟢What is The Next Opportunity on GOLD Market
🟢how to Enter to the Valid Entry With Assurance Profit
This CHART is For Trader's that Want to Improve Their Technical Analysis Skills and Their Trading By Understanding How To Analyze The Market Using Multiple Timeframes and Understanding The Bigger Picture on the Charts

XAUUSD ShortElite Analysis
All confirmations were met from high time frame to 1m time frame
Executed in smaller time frame
Targeting lower liquidity pools

Gold eyeing higher liquidity targetsPrice tapped into the Fair Value Gap (FVG) and rejected strongly from the descending channel support.
A bullish breakout above the trendline confirms momentum shift.
Targeting liquidity towards the previous swing high around 3409.

XAUUSD BUYXAUUSD showed an impulsive break of structure, the retraced back to a 4hr AOI.
Looks like a nice swing trade for a decent amount of profit
Let's see what price does
Like & comment your thoughts
Follow for more ideas

GOLD BEARS ARE STRONG HERE|SHORT
GOLD SIGNAL
Trade Direction: short
Entry Level: 3,330.62
Target Level: 3,305.39
Stop Loss: 3,347.39
RISK PROFILE
Risk level: medium
Suggested risk: 1%
Timeframe: 1h
Disclosure: I am part of Trade Nation's Influencer program and receive a monthly fee for using their TradingView charts in my analysis.
✅LIKE AND COMMENT MY IDEAS✅

GOLD Bearish Breakout! Sell!
Hello,Traders!
GOLD made a bearish
Breakout of the key
Horizontal level of 3,329$
Which is now a resistance
And the breakout is confirmed
So after the potential pullback
And retest we will be expecting
A further bearish move down
Sell!
Comment and subscribe to help us grow!
Check out other forecasts below too!
Disclosure: I am part of Trade Nation's Influencer program and receive a monthly fee for using their TradingView charts in my analysis.

Gold Price Analysis August 18Gold has just had a liquidity sweep to 3323 and quickly closed the H4 candle above the Fibonacci 0.5 level, showing that the bullish wave structure is still maintained. The next target that the market is aiming for is the resistance zone of 3358 - where Fibonacci 0.618 and the new trendline formed last week converge.
If the buying force remains stable, there is a high possibility that gold will soon conquer the 3400 level.
📌 Trading strategy
BUY when the price breaks the trendline, resistance or exceeds Fibonacci at 3358.
BUY around Fibonacci 0.5 with a confirmation signal of buying force at the 3345 area.
Target: 3400.
SELL trigger when the price breaks 3331 with a candle confirmation signal.

GOLD TARGETS BUY STOPSgold targets buy stops from a reclaimed breaker block. An imbalance fill is a very strong point of interest , the breaker block aligns with an imbalance, this combination has proven to be lethal so many times, watch out for it

3330 Under Pressure – New York Could Decide the MoveYesterday’s Move
Yesterday, after the initial rejection from the 3370 resistance zone, Gold broke below the 3350 confluence support and tumbled toward the 3330 key support. Since then, the price has been consolidating, with low volatility — largely due to the European bank holiday.
Key Question
Has the market gathered enough energy for another leg down, or will buyers manage to defend 3330?
Why a Bearish Continuation Is Possible
- The 3330 zone is now being tested repeatedly, showing weakening buying interest
- A confirmed break under 3330 would open the way toward the 3280 support zone.
Trading Plan
I will watch for a clear break under 3330 during the New York session, aiming for a move toward 3280. Any long position becomes interesting only if we get a daily close above 3360.
Final Note
The market still needs to confirm — patience is key.
Disclosure: I am part of TradeNation's Influencer program and receive a monthly fee for using their TradingView charts in my analyses and educational articles.

Gold is Ready For Bull After Forming a Strong SupportHello Traders
In This Chart GOLD HOURLY Forex Forecast By FOREX PLANET
today Gold analysis 👆
🟢This Chart includes_ (GOLD market update)
🟢What is The Next Opportunity on GOLD Market
🟢how to Enter to the Valid Entry With Assurance Profit
This CHART is For Trader's that Want to Improve Their Technical Analysis Skills and Their Trading By Understanding How To Analyze The Market Using Multiple Timeframes and Understanding The Bigger Picture on the Charts

What are your expectations for GOLD Medium to Long Term?Gold Outlook – Quick Summary
Gold has been consolidating for months, stuck between 3280 – 3450, and the time for a decisive breakout is approaching, likely in September or October.
Upside breakout (above 3409): targets could extend toward 3451 → 3500 → 3664 → 4000.
Downside break (below 3281): could trigger a deeper correction toward 3120 → 3005 → 2926 → 2742.
Medium to Long Term trend remains bullish, but a correction to 2780–2558 is still possible before higher levels are reached.
For the last three consecutive months, gold has closed with red candles, and no monthly candle has managed to close above 3305.
After reaching 3500 in April 2025 (triggered by Trump’s tariffs) and dropping to 3120, the following months consistently rejected the 3434–3451 zone.
On both the monthly and weekly charts, gold has been moving sideways in a narrowing range. It seems that the time has come—likely in September or October—for the market to choose a clear direction, either upward or downward.
Technically, the price is expected to correct downward, at least toward 2780–2558, even if the long-term trend remains bullish and price aims to reach above 3500 later.
My long-term outlook (not for daily trading, but for investment positioning):
If 3409 breaks upward: targets will be 3434–3438 → 3451 → 3500 → 3547 → 3664 → 3800 → 4000.
(However, I don’t expect these levels to be reached before a correction to 2780–2558 takes place.)
If 3281 breaks downward: targets will be 3268 → 3255 → 3247 → 3202 → 3167 → 3120 → 3086 → 3005 → 2954 → 2926 → 2880 → 2832 → 2790 → 2742 → 2721.
I know many will say these expectations are crazy or impossible. But anyone with trading experience knows that we have already witnessed the “impossible” in the markets—and even what we could never imagine in our dreams.
Geopolitical conditions keep changing, and even if there were none, the market would still create reasons to manipulate price action, mislead traders, and hit their accounts.
So, what are your views? Do you think these long-term scenarios are really impossible and illogical, whether to the upside or the downside?
Attached are the monthly and weekly charts, based on the close of Friday, Aug 22, 2025 (price: 3371).
Your feedback and insights are welcome – let’s see if the market proves the impossible again.
⚠️ Disclaimer: This analysis is for educational and informational purposes only. It does not represent financial advice or investment recommendations. Please trade responsibly and manage your risk accordingly.

GOLDTHE Fed Chair Jerome Powell Speaks and market moves,powell delivering a keynote address at the Jackson Hole Economic Symposium.
Powell’s speech, titled “Monetary Policy and the Fed’s Framework Review,” is highly anticipated as it may signal the Fed’s plans for interest rates and address challenges like inflation (currently ~2.6-3.1% above the Fed’s 2% target), a slowing labor market (July job growth at 35,000, unemployment at 4.2%), and President Trump’s tariffs. Powell has emphasized data-driven decisions and Fed independence amid political pressure from Trump to cut rates. He suggested that current conditions “may warrant” a rate cut, with markets pricing in a 91% chance of a 25-basis-point cut in September.
Significance: This speech could move markets, as Powell’s comments often set expectations for monetary policy. A rate cut could lower borrowing costs, potentially benefiting agricultural sectors (e.g., mint farmers) by reducing loan rates for equipment or land. However, persistent inflation from tariffs could counteract these benefits by raising input costs.
4:30 PM USD: FOMC Member Beth Hammack Speaks: Beth Hammack, President of the Cleveland Fed and an FOMC voting member.
Hammack, alongside other Fed officials like Raphael Bostic, has expressed skepticism about an immediate rate cut, citing inflation above the 2% target and robust business activity. Her remarks may focus on balancing inflation control with labor market stability.
Hammack’s comments could temper expectations for aggressive rate cuts, influencing market sentiment. Her perspective may highlight structural economic shifts, such as tariff impacts, which could indirectly affect commodity markets
Day 2: Jackson Hole Symposium What: An annual economic conference hosted by the Federal Reserve Bank of Kansas City, themed in 2025 as “Labor Markets in Transition: Demographics, Productivity, and Macroeconomic Policy.”
The symposium gathers central bankers, policymakers, and academics to discuss critical economic issues. This year’s focus on labor markets aligns with concerns about slowing job growth (down to 35,000/month in July) and reduced labor force participation due to tighter immigration policies. Powell’s speech is a highlight, but other Fed officials, like Collins and Hammack, and global central bankers (e.g., ECB’s Olli Rehn) also contribute. Discussions may cover AI’s role in monetary policy, tariff effects, and debt sustainability.
The symposium shapes global economic narratives. For agriculture (e.g., mint production), policy signals from Jackson Hole could influence input costs (via inflation) and export markets (via trade policies).
watch 3374 supply roof and see the correction into our zone and look for buy opportunity again.

Rate Cut Expectations Boost Gold — Caution on HighsFed Chair Powell noted that shifting economic risks strengthen the case for rate cuts, signaling potential support for a 25bp cut at the September meeting. In response, gold bulls surged, breaking through the 3358–3366 resistance and reaching around 3378.
⚠️ Caution: After sharp rallies, pullbacks are common. Avoid blind chasing — if you do, keep positions light and be ready to close quickly.
📌 My outlook: I’ve started entering sell positions, with key supports to watch at 3366–3358–3352 during pullbacks.
Importantly, this rally has shifted the 1D structure; holding above 3350 could open the door for a bullish move toward the 3400 level.
Rebuilding Confidence After LossesSomething that losses can really impact is our confidence.
After a loss or a losing streak, it’s so easy to get caught up in self-criticism and doubt. Closing yet another red trade can feel crushing. Frustration, discouragement, even sadness… it all piles up.
Suddenly, you don’t feel motivated to step back into the market. You start questioning your skills, your edge, maybe even yourself.
We hope that one day we’ll wake up feeling positive and confident. We wait for motivation to magically return. We wait for confidence to “show up.”
But here’s the truth: confidence isn’t a feeling you wait for.
👉 Real confidence comes from taking action—even when you feel doubt.
👉 It’s about trusting yourself enough to follow your process, even with nerves and self-criticism whispering in the background.
It’s about trusting yourself to do what’s important in your trading. To reconnect with how you want to show up as a trader.
Because research is clear: taking steps toward what matters (your process, your long-term trading success) is what quiets the inner critic.
Not affirmations. Not waiting for the “right mood.”
The best way to get your motivation back after losses is to move. One step. One action. Back toward your process.
Ask yourself:
👉How do I want to show up as a trader?
👉How can I act in line with my strategy today?
👉How do I want to look back on my trading journey?
It won’t always feel great in the moment. But small, consistent steps create the positive spiral you need.
And maybe one day, you’ll be proud that you kept going—not because you felt confident, but because you acted with courage despite the doubt.
💡 Pro tip:
After a losing streak, give yourself space to reset. Then choose one step—just one—that aligns with the trader you want to be. That’s how you rebuild.
Happy compassionate trading! 💙
/ Tina the Trading Psychologist
