Trading Strategies Amid Geopolitical and Policy GamesToday's gold price rebounded above $3,280 after opening with a dive to a low of $3,247, showing a volatile trend.
Influencing Factors
- Geopolitics: The ceasefire between Israel and Iran earlier caused gold prices to fall, but Trump's threat to bomb Iran again and maintain sanctions has revived market risk aversion, supporting gold prices with some bargain hunting.
- Monetary Policy: Expectations for Fed rate cuts have fluctuated. The CME FedWatch Tool shows an 81.9% probability of unchanged rates in July and a 76% probability of a cumulative 25-basis-point cut by September. U.S. economic data (e.g., personal consumption expenditure) and tariff policies are influencing gold's trajectory.
- Capital Flows: Global gold ETF demand turned negative in May, with outflows led by North American and Asian funds, putting downward pressure on gold prices.
Technical Analysis
Gold rebounded after a pullback last week, closing with two consecutive weekly gains. The $3,300-$3,310 range is a key resistance zone: a firm break above could signal a short-term trend reversal, while failure to do so may lead to a test of $3,200. On the daily chart, moving averages are bearish, MACD forms a death cross below the zero axis with expanding green bars (indicating dominant bearish momentum), but RSI at 39 near oversold levels suggests potential short-term rebound for correction.
Trading Strategy
Short gold on a rebound to the $3,305-$3,310 resistance zone, setting a stop-loss at $3,320. Initial targets are $3,280-$3,290, where profits can be gradually taken based on price action and market sentiment. If the decline continues, adjust targets downward to around $3,250, and flexibly adapt to real-time market conditions.
XAUUSD
sell@3300~3310
SL:3320
TP:3290~3280-3270
I am committed to sharing trading signals every day. Among them, real-time signals will be flexibly pushed according to market dynamics. All the signals sent out last week accurately matched the market trends, helping numerous traders achieve substantial profits. Regardless of your previous investment performance, I believe that with the support of my professional strategies and timely signals, I will surely be able to assist you in breaking through investment bottlenecks and achieving new breakthroughs in the trading field.
XAUUSD trade ideas

Gold Threatens Yearly Support- Bulls on NoticeGold is threatening a break of the yearly uptrend with Friday’s decline clearing the monthly range low. The focus into the start of the month is on technical support at the 5/29 swing low / May low-day close (LDC) 3240/45.
A break / close below this threshold would be needed to suggest a more significant correction is underway towards the 38.2% retracement of the November rally at 3132 and the 100% extension of the April decline at 3072- both areas of interest for possible downside exhaustion / price inflection IF reached. Resistance now at 3355/80 with a breach above the Record high-close at 3431 needed to mark resumption of the broader uptrend.
-MB

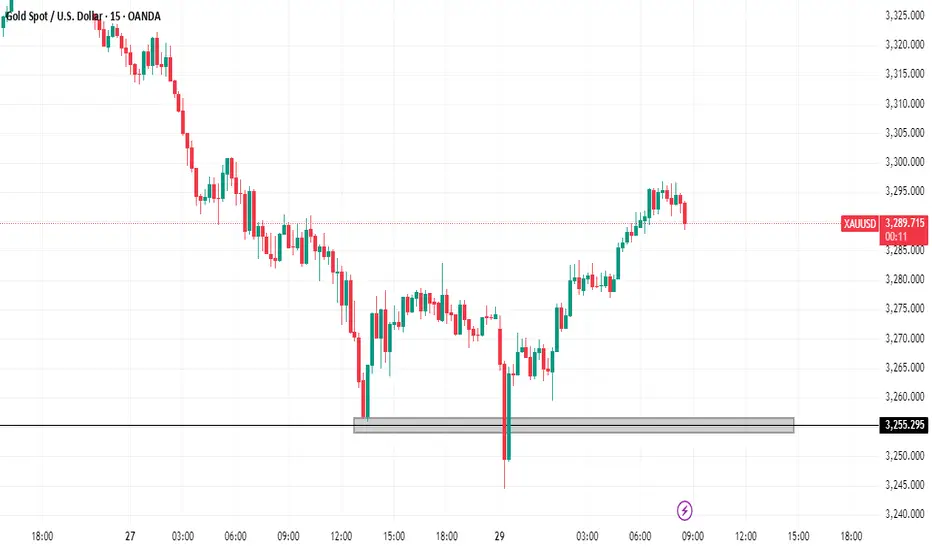
Daily XAUUSD AnalysisGold Took Supprt From The 3255 Level So a Pullback Could Be a Buying Opportunity
June 30, 2025 - XAUUSD GOLD Analysis and Potential OpportunitySummary:
Keep a close eye on fundamental news — any major headlines could instantly invalidate technical levels and short-term indicators.
From the current chart structure, the trend remains clearly bearish, so the primary strategy is to sell on pullbacks to resistance.
Watch key levels like 3283, 3300, and 3350 closely — if price breaks above these, it could signal weakening bearish momentum, requiring a quick strategy adjustment.
🔍 Key Levels to Watch:
• 3310–3312 – Resistance zone
• 3300 – Psychological level
• 3295 – Resistance
• 3283 – Intraday key resistance
• 3266 – Intraday key support
• 3250–3255 – Support zone
• 3245 – Support
• 3233 – Support
📈 Intraday Strategy:
• SELL if price breaks below 3266 → target 3260, then 3250, 3245, 3233
• BUY if price holds above 3283 → target 3295, then 3301, 3312, 3320
👉 If you want to know how I time entries and set stop-losses, hit the like button so I know there's interest — I may publish a detailed post by the weekend if support continues!
Disclaimer: This is my personal opinion, not financial advice. Trade with caution and always manage your risk.

XAUUSD Elliot wave update: Is wave 4 still in play?From our previous count we were anticipating a drop for 4th wave completion. We can see now we have been dropping as anticipated. Given the current wave structure I am expecting a double 3 (wxy) to complete this 4th wave. If we are correct then we should expect price to continue down from current position before pulling back up and fall one more time. To take advantage of the move if not caught at the top, one should find areas where price will find resistance to short the market.

Definitive Micro-Analysis & Actionable Forecast: XAUUSDHigh-Level Strategy (Monthly/Weekly/Daily Recap)
Overall Market Condition: The primary trend has shifted from Bullish to Bearish/Corrective due to the Monthly Bearish Engulfing and Weekly Three Black Crows patterns.
Immediate Tactical Bias: The Daily Bullish Harami pattern strongly indicates a pause in the downtrend and the high probability of a short-term corrective rally (a "bounce").
Our Goal: To map out the entry, targets, and invalidation levels for this anticipated bounce.
Deep Dive: The Lower Timeframes (4H, 1H, 30M, 15M, 5M)
Consolidation After the Low (4H & 1H):
Candlestick Reading : As observed, after the low was made (~2318), the price action on the 1H and 4H charts has stopped making new lows. Instead, it is building a base, characterized by a series of Dojis and Spinning Tops. This is a classic sign of indecision and absorption, where selling pressure is drying up and buyers are beginning to tentatively step in. This is the "coiling spring" phase before the bounce.
The Trigger (15M & 5M):
Candlestick Reading: On the 15M and 5M charts, we are looking for the very first sign that buyers are taking control. The ideal trigger would be a clear, small-scale Bullish Engulfing or Tweezer Bottom pattern forming at the bottom of this consolidation range. As of the last candle on the 5M chart, we see a small green candle attempting to move up, but the trigger is not yet confirmed.
The Full Storyboard: From Entry to Exit with Price Levels
For those interested in further developing their trading skills based on these types of analyses, consider exploring the mentoring program offered by Shunya Trade.
I welcome your feedback on this analysis, as it will inform and enhance my future work.
Regards,
Shunya Trade
⚠️ Disclaimer: This post is educational content and does not constitute investment advice, financial advice, or trading recommendations. The views expressed here are based on technical analysis and are shared solely for informational purposes. The stock market is subject to risks, including capital loss, and readers should exercise due diligence before investing. We do not take responsibility for decisions made based on this content. Consult a certified financial advisor for personalized guidance.

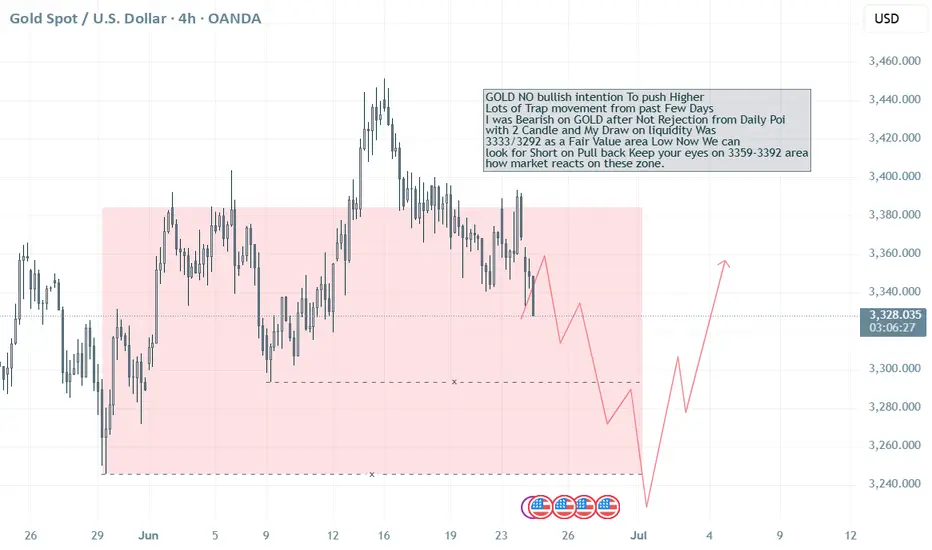
No Bullish intention on GOLD, Seller on Control? Target 3292?
GOLD NO bullish intention To push Higher
Lots of Trap movement from past Few Days
I was Bearish on GOLD after Not Rejection from Daily Poi
with 2 Candle and My Draw on liquidity Was
3333/3292 as a Fair Value area Low Now We can
look for Short on Pull back Keep your eyes on 3359-3392 area
how market reacts on these zone.
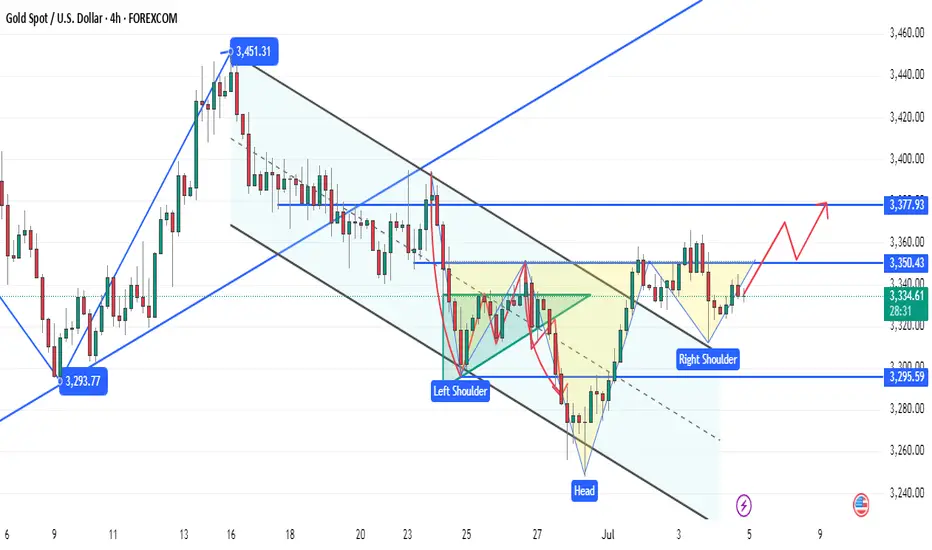
GOLD (XAUUSD) | 4H OB Respected | waiting for 30m LH BreakPair: XAUUSD
Bias: Bullish
Timeframes: 4H, 30M, LTFs
• 4H showing strong bullish structure — OB respected cleanly, confirming higher timeframe demand.
• On 30M, now patiently waiting for the break of LH to confirm continued bullish intent. After that, looking for a sweep off a fresh internal OB for LTF entry confirmation.
🔹 Entry: After LH break + sweep + CHoCH on LTFs
🔹 Entry Zone: Within fresh internal OB post-LH break
🔹 Target: Near structure highs
Mindset: Let the structure speak. No guesswork — wait for your levels, your break, and your confirmation. Precision over prediction.
Bless Trading!

Gold Daily Review
Dear traders, the sell-off last night directly brought the bulls back to their original form. The closing price of 3325 made most of the gains accumulated hard this week spit back. To me, this wave of market is a typical "data killing". The June non-agricultural data came out halfway, and the employment data was so strong that even the old foxes on Wall Street were surprised. Now the market's bet on the September rate cut has dropped directly from 70% to less than 50%. How can gold, which is "interest rate sensitive", withstand such a critical blow?
From a technical perspective, the negative line of the daily line is indeed ugly, but I think the bulls should not die. Look at the 4-hour chart. The Bollinger Bands have begun to "tighten their belts", and the 3310-3365 box is clearly drawn. Today is Independence Day. The US market closed early. Those Wall Street wolves probably ran to the Hamptons for a pool party. We are likely to play a "lying flat" market in the Asian and European markets. I calculated with my fingers that the 40 USD range of 3310-3350 is enough for us to toss around. Remember - short orders at the upper edge of 3345 should be as fast, accurate and ruthless as "whack-a-mole", and long orders at the lower edge of 3325 should be as patient as a fisherman!
The news is now "ice and fire". On the one hand, Trump's "big and beautiful" tax cut bill has just passed the test successfully. After this shot of booster, the US dollar and US bond yields are soaring like stimulants; on the other hand, drones in the Middle East are causing trouble again, and the small flame of geopolitical risk has not been extinguished. If you ask me, gold is like a "schizophrenic patient" now, jumping back and forth between inflation narratives and risk aversion sentiment.
Specific strategy:
① Directly "operate from a height" near the rebound of 3345, set the stop loss at 3352, and the target position is the 3330-3320 range. Remember that this position is the "previous high neckline position" and the probability of breaking is not high.
② You can "lighten your position and fish" when it falls back to 3325. The defensive position of 3315 must be strictly guarded, and the target position is the pressure zone of 3335-3345
Why is the 147k Beat in Payrolls Data Not as Strong as it Seems?Yesterday’s U.S. nonfarm payrolls report came in above expectations, but a closer look at the details reveals a less encouraging picture. Despite the headline beat, market reactions quickly faded. For instance, gold initially dropped from 3350 to 3311 in the first 15 minutes after the release but has since recovered more than 75% of that decline. So why is the June jobs report not as strong as it first appeared?
According to the BLS report, nonfarm payrolls increased by 147k in June, surpassing the consensus estimate of 106k. However, when breaking down the numbers, private payrolls rose by just 74k, well below expectations. Most of the gains came from government and healthcare hiring. Government jobs accounted for 73k new positions, and 63k of those came from the education sector alone.
Some analysts suggest the high net hiring in education may be due more to a lack of firings, a consequence of a tight labor market in that sector. Meanwhile, the 59k increase in healthcare jobs is part of a long-term trend. Over the past two years, the U.S. has added an average of 70k healthcare jobs per month. This growth is largely driven by the needs of an aging population and reduced payrolls during and after the pandemic that have yet to fully recover.
If you exclude government and healthcare hiring, U.S. payrolls increased by just 15k in June.
The unemployment rate also came in better than expected, falling to 4.1% from 4.2%, while markets had anticipated a rise to 4.3%. However, this decline was driven by a drop in the labor force participation rate, which fell to 62.3% from 62.6% in just two months , a worrying sign that fewer people are actively participating in the labor market.
In the first 15 minutes after the data came, gold fell to 3311 from 3350. In the following 18 hours, gold recaptures 85% of the loss. Gold is still over the broken bearish trendline in 1-H timeframe. With tariff deadline in 9th July and incoming 10-12 tariff letters coming in from Trump in the next few days, gold could have potential to go upwards with market understands this jobs data is not strong as it seems.

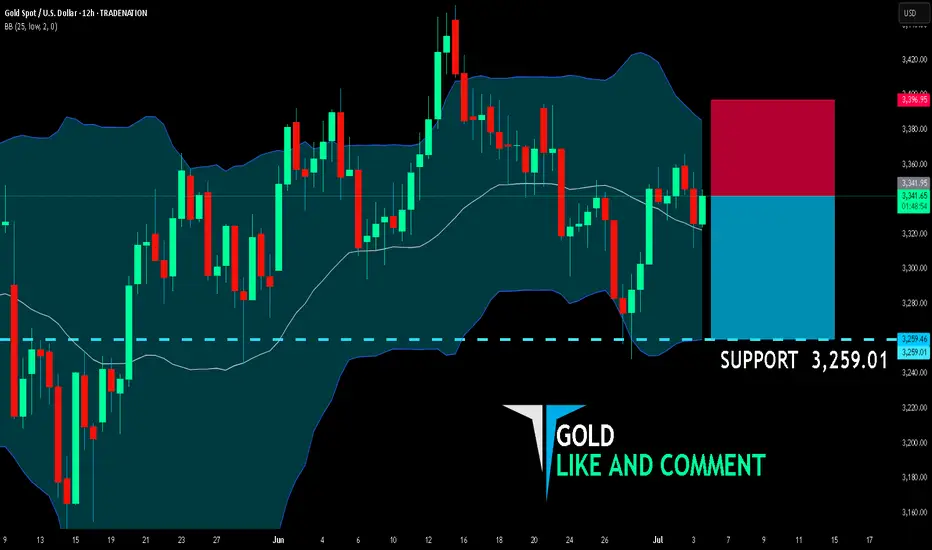
GOLD BEARS ARE STRONG HERE|SHORT
GOLD SIGNAL
Trade Direction: short
Entry Level: 3,341.95
Target Level: 3,259.01
Stop Loss: 3,396.95
RISK PROFILE
Risk level: medium
Suggested risk: 1%
Timeframe: 12h
Disclosure: I am part of Trade Nation's Influencer program and receive a monthly fee for using their TradingView charts in my analysis.
✅LIKE AND COMMENT MY IDEAS✅
Indicates the target for potential bearish liquidity grab.BSL (Buy-Side Liquidity):
Marked near $3,360 at the top (gray zone).
Represents an area where buy stops may be resting above recent highs.
SSL (Sell-Side Liquidity):
Marked around $3,260 at the bottom (red zone).
Indicates the target for potential bearish liquidity grab.
FVG (Fair Value Gap):
Highlighted in yellow near $3,270–$3,280.
Unfilled imbalance that may attract price.
ChoCH (Change of Character):
Two ChoCH labels are marked:
One minor bullish ChoCH around the $3,328 area indicating a short-term shift in structure.
One bearish ChoCH below $3,310, suggesting a possible return to bearish bias if broken.
Blue Supply Zone:
An area of previous supply or resistance where price may reverse.
📉
Projected Price Path:
Initial move up into the blue supply zone, possibly to induce buyers or sweep short-term highs.
Followed by a strong bearish rejection, breaking below the lower ChoCH level (~$3,310).
A drop is anticipated all the way to the SSL zone (~$3,260), possibly filling the FVG on the way.
🧠 Summary:
This chart implies a smart money bearish setup:
Short-term liquidity sweep to the upside.
Break of structure (ChoCH) to confirm reversal.
Bearish continuation targeting:
Fair Value Gap (FVG) → ~$3,270s
Sell-Side Liquidity (SSL) → ~$3,260

7.4 Non-farm payrolls exploded, and expectations for the Fed’s rOn Thursday, as the strong US employment data dispelled the market's expectations of the Fed's recent rate cut, the US dollar index rose sharply before the US market, returned to above the 97 mark, and once rose to an intraday high of 97.42.
Spot gold fell sharply, once falling to $3311 during the session, a drop of more than $50 from the intraday high, and then recovered some of its losses and remained near 3330 for consolidation.
The current upper suppression position of the daily line is almost here at 3350, and the lower support is located at 3320-25.
So if it is maintained in the range of consolidation, it is likely to be rectified at 3320-50.
Secondly, from the hourly chart:
It can be seen from the trend of 3247 to 3365.
The Fibonacci 618 position is exactly here at 3320.
Although the lowest point last night was pierced to around 3311, it can be seen that the entity still closed above 3320.
As long as 3320 cannot be broken, the best case scenario is to maintain it at 3320-50 for consolidation. If not, once 3350 is broken, the high point of 3365 will definitely not be able to be maintained.
Therefore, for today's operation, try to maintain the high-selling and low-buying range of 3320-50.

XAUUSD – Bearish Month?🧭 Fundamental Bias: Bearish (-7/10)
– 🔥 NFP beat: 147K vs 110K → Fed cuts unlikely soon
– 💵 Dollar & Bond Yields UP
– 📈 Risk-on (Stocks ATH)
– 🛢️ Oil dropped = easing inflation
– 🏛️ No fresh Fed dovish hints
– 🕊️ Geopolitics stable for now (Iran/Trump)
📍 Technical View:
Price consolidating under supply zone (~3330).

Gold Latest Market Trend AnalysisThe data released by the U.S. Bureau of Labor Statistics showed that the U.S. seasonally adjusted non-farm payroll employment in June was 147,000, with the consensus forecast at 110,000. The previous value was revised up from 139,000 to 144,000. The annual rate of average hourly earnings in June stood at 3.7%, below the expected 3.90%, while the prior figure was revised down from 3.90% to 3.8%.
Following the release of the non-farm payroll report, interest rate futures traders abandoned their bets on a Federal Reserve rate cut in July. Currently, the market-implied probability of a Fed rate cut in September is approximately 80%, down from 98% prior to the report. On Thursday, gold exhibited a seesaw pattern, surging initially to hit resistance near $3,365 per ounce before retreating. During the U.S. session, it broke below support levels and further declined to hover around $3,311, where it staged a rebound. Gold remains in a high-range consolidation under selling pressure.
you are currently struggling with losses,or are unsure which of the numerous trading strategies to follow,You have the option to join our VIP program. I will assist you and provide you with accurate trading signals, enabling you to navigate the financial markets with greater confidence and potentially achieve optimal trading results.
Trading Strategy:
sell@3350-3355
TP:3320-3325

Gold Ready to Explode Ahead of NFP and Trump’s “Super Bill”?Gold Ready to Explode Ahead of NFP and Trump’s “Super Bill”? | Global Macro Focus
🌍 MACRO UPDATE – What the World is Watching:
Gold continues its bullish trajectory as the USD weakens sharply following last night’s disappointing ADP jobs report (-33K vs expected +99K). This soft labour data has fueled further speculation that the Fed could begin rate cuts as early as September, with a 90% probability now being priced in.
In the political arena, Donald Trump’s recent statement that House Republicans are aligned to push forward a so-called “Super Bill” has triggered fresh uncertainty around US fiscal policy. This could elevate safe-haven demand for gold, especially if it leads to increased tensions over debt ceilings or government spending.
With the US Non-Farm Payrolls (NFP) due later today and the UK and US markets heading into a long weekend, traders should brace for heightened volatility and liquidity gaps.
📈 TECHNICAL OUTLOOK – What the Charts Are Saying:
Overall Trend: Bullish structure remains intact as gold breaks and holds above 3365.
EMA Setup: Price trades above EMA 13/34/89/200 – signaling strong upside momentum.
Fair Value Gap (FVG): 3374 – 3388 area remains an unfilled FVG zone; possible magnet for short-term price action.
Key Resistance Levels: 3365, 3374, 3380, 3388, 3393
Key Support Levels: 3343, 3335, 3325, 3316, 3304
Trendline & Structure: The ascending trendline from 3316 remains unbroken, providing a potential bounce point if price corrects.
🎯 TRADE SETUPS – Strategic Zones to Watch:
🔵 Buy (Short-Term Scalp):
Entry: 3335 – 3333
SL: 3329
TP: 3340 → 3350 → 3360 → 3370
🟢 Buy Zone (Swing Perspective):
Entry: 3316 – 3314
SL: 3310
TP: 3320 → 3336 → 3350 → 3360
🔴 Sell Scalp (Reversal Zone)
Entry: 3374 – 3376
SL: 3380
TP: 3370 → 3360 → 3350
⚠️ Sell Zone (High-Risk Rejection):
Entry: 3388 – 3390
SL: 3394
TP: 3380 → 3370 → 3360
🔎 NOTE FOR GLOBAL TRADERS:
With UK markets partially closed and US session shortened ahead of the Independence Day holiday, liquidity may be thin and volatility could spike unexpectedly. Always place stop-loss and avoid emotional entries near key resistance.
💬 Do you believe gold can break and close above the FVG zone (3388) before the weekend volatility hits full throttle? Let’s discuss.

7/3: Focus on Short Positions, Watch Support Near 3320Good morning, everyone!
Yesterday, gold tested support near 3328 but failed to break below it effectively. The price then rebounded toward the 3350 level. At today’s open, gold briefly extended to around 3365 before pulling back.
Technically:
On the daily (1D) chart, the price remains capped by the MA20, with no confirmed breakout yet.
Support levels below are relatively dense, and moving averages are increasingly converging, suggesting a breakout in either direction is approaching.
Key intraday support lies in the 3321–3316 zone.
On the 2-hour chart, we are seeing the first signs of a bearish divergence, indicating a need for technical correction. Much like Tuesday’s setup, there are two possible scenarios:
If 3342–3334 holds, the price may extend slightly higher, intensifying divergence before pulling back;
If 3337 breaks, we could see a drop toward 3320, where correction would occur through a direct decline.
From a fundamental perspective, several high-impact U.S. data releases are scheduled for the New York session, which may increase volatility and make trading more challenging.
Trading suggestion:
For most traders, the safest approach is to wait for data to be released, then look for oversold rebounds or overbought corrections following sharp market reactions.
This style requires patience and strong risk control—avoid being overly aggressive or greedy, as such behavior can easily lead to trapped positions or even liquidation.

GOLD XAUUSD 4H – Smart Money SELL Opportunity
Gold (XAUUSD) is currently trading around 3,328.96, showing signs of exhaustion near previous highs. Price failed to break above 3,355 zone, indicating liquidity build-up and potential for Smart Money manipulation.
This is a SELL-ONLY setup — waiting for price to react from premium levels to short the market.
---
SELL Trade Plan:
🔻 Sell Limit: 3,340.00 - 3,355.00
🛑 Stop Loss: 3,360.00 (Above liquidity grab zone)
🎯 Take Profit 1: 3,300.00
🎯 Take Profit 2: 3,280.00
---
Why Sell?
✅ Price is approaching major distribution zone.
✅ Liquidity resting above 3,340 - 3,355 likely to attract manipulation wicks.
✅ After manipulation, Smart Money expected to drive price lower.
No buy confirmation. Structure favors sellers — trade what you see, not what you feel.
---
Summary:
Bias: SELL ONLY 🔥
Setup: Wait for price to tap 3,340 - 3,355, rejection confirms entry.
Risk Management: Mandatory — Protect your capital.
---
💬 Drop your thoughts below — are you catching this sell move?
#Gold #XAUUSD #Forex #SmartMoney #TradingView #LiquidityHunt #SellSetup #FrankFx14

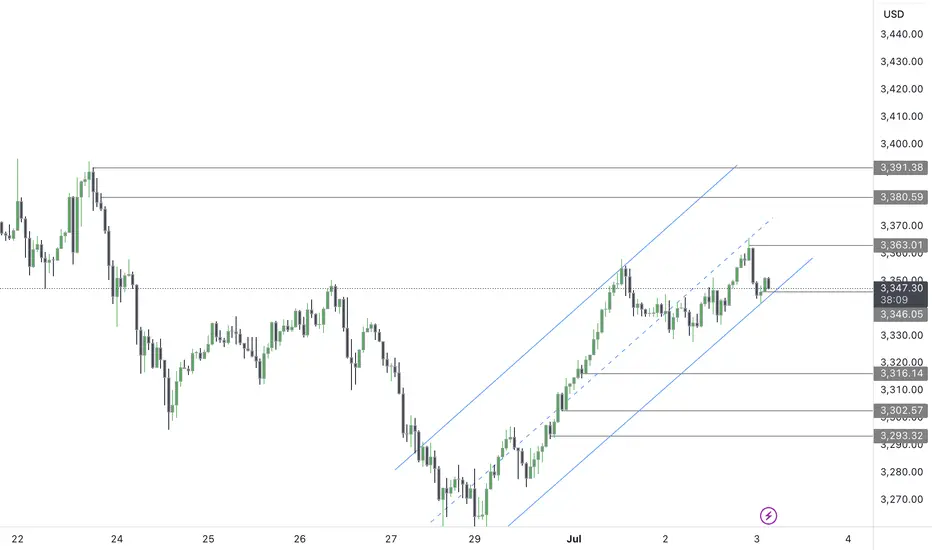
GOLD BULLS We saw gold impose a strong bullish strength since the open of this new week, and even at the beginning of the new month (JULY).
Based on this analysis, this bullish momentum has structured in a bullish trend channel which has been shown, we still have more top liquidity to mitigate as we have made a bearish retracement for a continued bullish rally to 3360's, 3380's and 3400's.
Further updates would be given as the market gains momentum
Trading Game of the Day 2- JULY-2025Trading Plan :-
1-BSL and SSL
2-MSS and CISD
3-iFVG and FVG
4-probabilistic mindset
Thank You

Gold Market Eyes 3380s After 3350s mitigated Gold market currently priced in the 3350s, with the daily candle formation suggesting an intent to mitigate the previous day's open. This setup may trigger a full bullish sentiment, potentially driving price action toward the 3380s. follow for more Insights , comment and boost idea

XAU/USD GOLD Short 4:1XAU/USD GOLD Short 4:1, last idea was correct closed in profits, I will take two positions here.
1. 1:1 TP
2. 4:1 TP
Enjoy!

Gold's price is expected to go up✅ Gold's price is expected to go up, possibly reaching $3400 or more. This could happen after a small pause or a direct climb. A technical signal also supports this upward trend.
❌ However, be careful! The upcoming U.S. jobs report (NFP) can drastically change gold's direction. It's best to wait until the market reacts to that news before making new predictions.
