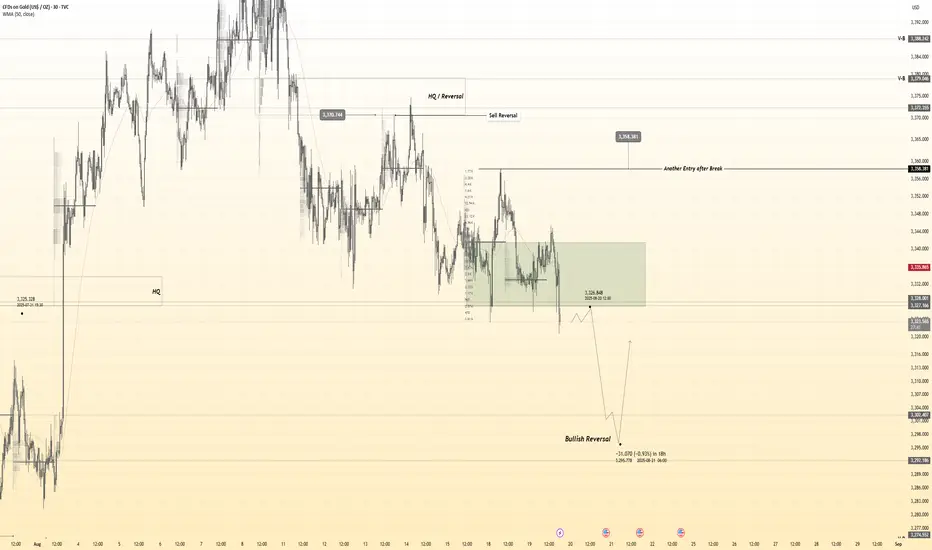
Gold 30Min Engaged ( Bullish & Bearish Reversal Entry Detected Time Frame: 30-Minute Warfare
Entry Protocol: Only after volume-verified breakout
🩸Bearish Movemnent from - 3326
🩸Bullish Reversal - 3303
➗ Hanzo Protocol: Volume-Tiered Entry Authority
➕ Zone Activated: Dynamic market pressure detected.
The level isn’t just price — it’s a memory of where they moved size.
Volume is rising beneath the surface — not noise, but preparation.
🔥 Tactical Note:
We wait for the energy signature — when volume betrays intention.
The trap gets set. The weak follow. We execute.
XAUUSD trade ideas
Hellena | GOLD (4H): LONG to resistance area of 3400 (Wave 3).I am updating my idea because I have a certain vision of the situation, like the diagonal “ABCDE”, in which the movement has already ended. It is quite remarkable that this scenario, like the previous one, envisages a continuation of the upward movement.
Therefore, I am considering a small correction to the 3300 area (wave “2”), followed by a continuation of the upward movement to the 3400 resistance area.
If the price reaches the target immediately, this does not contradict the idea. Therefore, I recommend considering only long positions or limit orders.
Manage your capital correctly and competently! Only enter trades based on reliable patterns!

Gold Price Forecast -> Still BearishGold Price Forecast -> Still Bearish
In our last analysis, GOLD hit both of our target levels.
Right now, gold has found some support around 3325 and bounced back up to 3358, where it faced strong resistance again. In my opinion, gold isn’t choosing a clear direction yet, partly because the geopolitical situation is still uncertain.
Today, the USD got stronger ahead of an important meeting in Washington between U.S. President Donald Trump and Ukrainian President Volodymyr Zelenskiy, which aims to push forward a peace deal with Russia.
Gold might test the 3358 level again if there's any speculation, but if it stays below this zone, it could start moving down. We might see gold drop to 3300 soon.
You may find more details in the chart!
Thank you and Good Luck!
PS: Please support with a like or comment if you find this analysis useful for your trading day

GOLD (XAUUSD): Intraday Bearish SetupWe have observed two unusual breakouts in the price of Gold.
We are aware, the market had been consolidating for approximately one week.
During this consolidation, the price established both a triangle pattern and a horizontal range.
We are now witnessing a breakout below both the support level of the range and the neckline of the triangle.
This appears to confirm the current strength of the sellers in the market.
The price may potentially decline to the 3296 level.

Common Patterns, Win Up to 80% ? Hello everyone, if you're struggling to identify price zones, entry points, or simply want to predict the trend of any currency pair, then this article is for you.
Continuing from the previous section, today we’ll cover some popular bearish reversal patterns. These patterns have been tested and trusted by many traders, and they can increase the probability of winning for any currency pair up to 80%. Let's get started:
First pattern: DOUBLE TOP
The double top pattern is a highly bearish pattern, formed after the price hits a high twice consecutively. Once support is confirmed to be broken, we can make a decision to sell.
Second pattern: DESCENDING TRIANGLE
The descending triangle is a bearish pattern characterized by a downward-sloping upper trendline and a flat lower trendline that acts as support. This pattern indicates that the sellers are more aggressive than the buyers, as the price continues to form lower highs. The pattern is complete when the price breaks out of the triangle in the direction of the prevailing trend.
3. HEAD AND SHOULDERS
This is a specific chart pattern that predicts a change from an uptrend to a downtrend. The pattern appears as a baseline with three peaks, where the two outer peaks are of nearly equal height, and the middle peak is the highest.
The head and shoulders pattern is considered one of the most reliable trend reversal patterns .
4. PRICE CHANNEL
The term "price channel" refers to a signal that appears on the chart when the price of a currency pair is bounded between two parallel lines. Price channel patterns are quite useful for identifying breakouts, which occur when the price moves beyond either the upper or lower trendline of the channel.
Traders can sell when the price approaches the upper trendline of the price channel and buy when the price tests the lower trendline.
5.TRIPLE TOP REVERSE
The Triple Top pattern typically signals a reversal from an uptrend to a downtrend.
Similar to the Double Top pattern, the Triple Top can occur on any timeframe, but for it to be considered a valid Triple Top, it must occur after an uptrend.
And those are some common bearish patterns. Remember to keep them in mind and apply them regularly. You’ll definitely succeed.
If you’ve understood all the patterns, don’t forget to like the post🚀. If you need any explanations about anything, feel free to leave a comment below. 👇
The next sections will definitely be even more exciting, so stay tuned for the upcoming guides.
Good luck!

How Gold Is Moving TodayHello everyone, what do you think about OANDA:XAUUSD this week—up or down?
Today, gold saw a slight rebound, recovering over 10 USD during the Asian session, yet overall it remains within a downtrend pattern.
Gold has been under selling pressure following the release of the US PPI for July, which rose 0.9% month-on-month, far exceeding the 0.2% forecast. This fueled expectations that the Fed will be more cautious in cutting rates, supporting the US dollar and putting downward pressure on gold in the current phase.
The impact of this news is still lingering, and gold may continue along the current trend. On the short-term chart, gold is moving within a wedge pattern, with a high probability of a breakout as the price approaches the end of the formation. Careful entry timing is advised.
On the downside, support levels at 3,310–3,330 USD are closely watched. For buyers, potential targets are 3,360–3,370 USD.
Which direction do you think gold will break?

Gold Soars! Buy Opportunity After Fed's Rate Cut Hint!In just yesterday's session, gold surged by +32.520 USD (+0.97%) , equivalent to more than 320 pips . A shocking rise caught the market off guard.
The cause was Fed Chairman Jerome Powell's speech at the Jackson Hole conference, where he hinted at the possibility of an interest rate cut as soon as September. This dovish message weakened the USD , reduced bond yields, and triggered a flow of money into safe-haven assets like gold.
Meanwhile, with calls for interest rate cuts from the Trump administration and concerns about an economic slowdown, gold is likely to rise in the future. President Trump criticized the Fed and called for aggressive rate cuts to boost the economy. If this policy is implemented, the USD could weaken further, making gold an even more attractive investment option.
Technical analysis: Traders may consider the next targets as 3,410 USD (TP1) and 3,434 USD (TP2). With EMA (89 and 34) indicators supporting the uptrend, investors might consider buying around 3,370 USD if gold experiences a slight short-term pullback, expecting the price to continue rising if macroeconomic factors remain favorable.
In conclusion, all factors are currently supporting gold's uptrend. We will continue to monitor developments in the coming days, particularly decisions from the Fed and global economic factors that may impact gold.

Gold Continues to SurpriseHello everyone, let’s take a look at OANDA:XAUUSD !
Yesterday, gold continued to surprise us, as the metal made a strong recovery on Wednesday, trading around 3,345 USD in the US session after dropping to a three-week low of 3,311 USD earlier.
This recovery occurred as the US Dollar (USD) dropped from a one-week high. Additionally, gold reversed sharply upward as tensions in Ukraine did not ease as expected. The escalating tensions are not just between the US, Russia, and Ukraine, but Europe also wants its influence on the matter. Since Europe is not willing to compromise, a peace agreement seems unlikely to be reached.
From a technical perspective, gold successfully tested the previous resistance at 3,330 USD, turning it into new support, breaking out of the downward trendline. If gold maintains strength above this level, the next key targets to watch are 3,357 and 3,370 USD.
Regarding the trend outlook: Investors are closely watching the minutes from the latest Federal Open Market Committee (FOMC) meeting to gain insights into the US monetary policy direction in the short term.
Fed Chairman Jerome Powell will speak on Friday morning and is expected to update the Fed's monetary policy framework. Powell’s speech could provide a new perspective on internal FOMC support for a potential interest rate cut in September, which could set a new trend for XAU/USD.
Stay tuned with me! Don’t forget to like the post and share your views in the comments.
Good luck!

Gold price heading to 3400 early this week✏️Gold price has a liquidity sweep to 3323 and closes the H4 candle back above the 0.5 fibonacci of the bullish wave structure. The next level that gold is aiming for is the past resistance zone and also the 0.618 Fibonacci zone, which is the price zone of 3358. This is also an area within a trendline that was just formed last week. If trading above the Fibonacci zones, gold will soon regain the 3400 level.
📉 Key Levels
BUY trigger: Break trendline, Break Resitance, Break Fibonacci at 3358
BUY trigger: price action to Fibonacci 0.5 and there is a reaction from the buyers at 3345
Target 3400
Leave your comments on the idea. I am happy to read your views.

XAU/USD - Bearish Flag Pattern (16.08.2025)The XAU/USD Pair on the M30 timeframe presents a Potential Selling Opportunity due to a recent Formation of a Bearish Flag Pattern. This suggests a shift in momentum towards the downside in the coming hours.
Possible Short Trade:
Entry: Consider Entering A Short Position around Trendline Of The Pattern.
Target Levels:
1st Support – 3318
2nd Support – 3308
🎁 Please hit the like button and
🎁 Leave a comment to support for My Post !
Your likes and comments are incredibly motivating and will encourage me to share more analysis with you.
Best Regards, KABHI_TA_TRADING
Thank you.
Disclosure: I am part of Trade Nation's Influencer program and receive a monthly fee for using their TradingView charts in my analysis.

GOLD DAILY CHART ROUTE MAPDaily Chart Update
Range Still in Control: Same Boundaries, Same Play
Not much has changed since last week. Price continues to rotate within the 3272–3433 range, respecting the structure with precision. The week’s action stayed contained inside this 170+ pip zone, reinforcing the dominance of the range.
As we head into the new week, the outlook remains the same: watching 3433 as upside resistance, while 3272 continues to anchor support. Until one side breaks and holds, range trading strategies remain the focus.
Current Outlook
🔹 Range Still Active
Price is firmly contained between 3272 and 3433. A decisive break outside this box is still required for a trend shift.
🔹 Same Rejections
The market has yet to sustain above 3433. Resistance stands firm.
🔹 Support Holding
As long as 3272 holds, bias stays neutral-to-bullish within the range, with eyes on another potential 3433 retest.
Updated Key Levels
📉 Support – 3272
Still the key pivot and buy zone unless a confirmed breakdown occurs.
📈 Resistance – 3433
Unchanged as the main ceiling. A break and hold above would shift dynamics, but until then, sellers remain in control at this level.
Thanks as always for your support,
Mr Gold
GoldViewFX

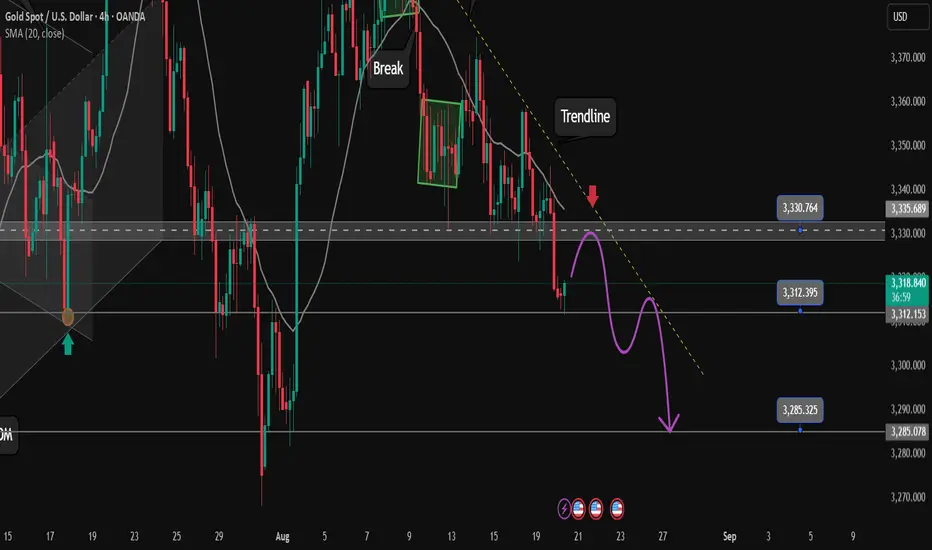
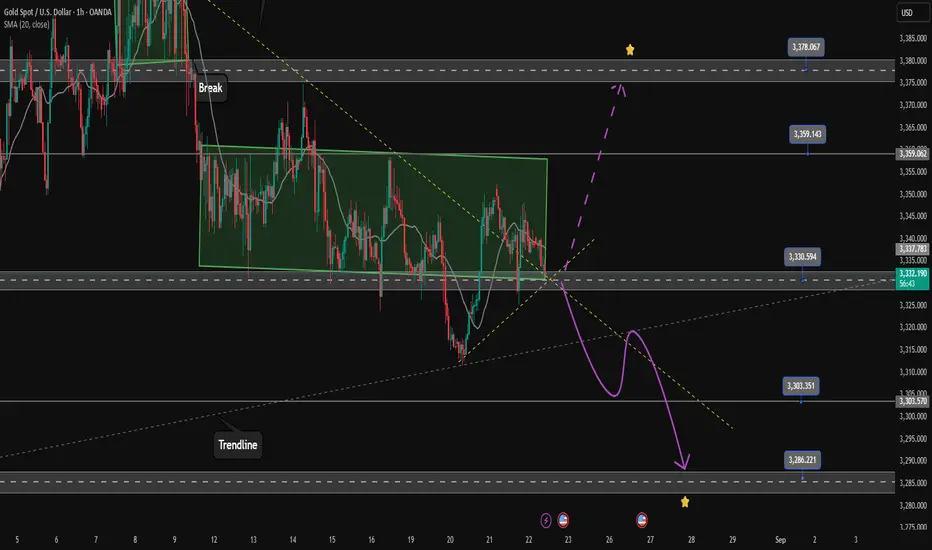
XAUUSD – Waiting for the Market to Show Its Hand1. Yesterday’s Setup
In my yesterday’s analysis, I mentioned that while I am bullish overall, I could not ignore the pressure Gold was putting on the 3330 support. I also noted that for bulls to regain control, a break above 3345 was needed.
The market reacted with textbook precision: price rallied exactly to 3345 before breaking down through 3330, reaching a low of 3311. Currently, we see a normal rebound, but inside a bearish short-term structure.
________________________________________
2. The Key Question
Is this just a continuation of the downtrend, or a trap before the real bullish move?
________________________________________
3. Why I’m Not Convinced by the Bears
• The recent drop doesn’t look impulsive—it’s overlapped and choppy, more like a stepway accumulation phase.
• The pattern is contained inside a falling wedge, a structure that usually favors upside breaks.
• Bears had their chance yesterday, but the follow-through looks weak.
________________________________________
4. Trading Plan
At this moment, I’m out of the market, waiting for confirmation.
• Buy zone: around 3300–3305 for a potential re-entry long.
• Bullish confirmation: if price climbs back above yesterday’s high (3345), it would negate the breakdown and confirm a false break.
• With price now at 3322, I prefer to stay patient, watching how it reacts at the key levels.
________________________________________
5. Final Note 🚀
Gold is now right in the middle of my interest range. For me, it’s not about predicting—it’s about waiting for the market to reveal the next high-probability setup.
Disclosure: I am part of TradeNation's Influencer program and receive a monthly fee for using their TradingView charts in my analyses and educational articles.

Confirmation of the continue of the selling side. Ready for SELL✏️ As analyzed yesterday, OANDA:XAUUSD has decreased when looking for selling momentum and target zone 1 has been reached when touching the support zone 3312. This price decrease will soon reach 3285 soon but need to pay a little attention to the statement of FOMC. SELL strategy is the most optimal strategy at the moment for Gold. BUY point must wait for confirmation around 3385 from buyers who want to participate in the market.
📉 Key Levels
SELL trigger: retest resistance 3330 with price rejection from sellers
SELL DCA trigger: break support zone 3312
Leave your comments on the idea. I am happy to read your views.
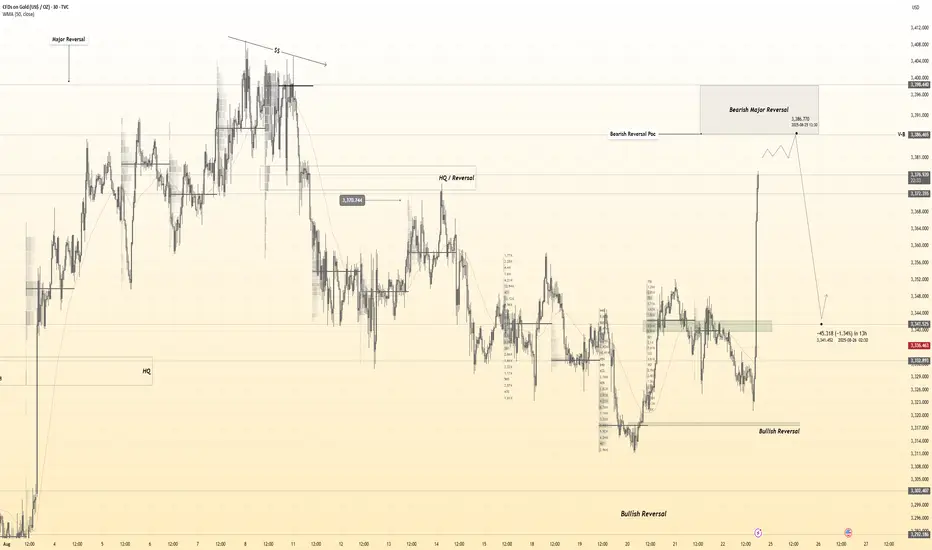
Gold 30Min Engaged ( Bearish Reversal Entry Detected )Time Frame: 30-Minute Warfare
Entry Protocol: Only after volume-verified breakout
🩸Bearish Reversal - 3386
➗ Hanzo Protocol: Volume-Tiered Entry Authority
➕ Zone Activated: Dynamic market pressure detected.
The level isn’t just price — it’s a memory of where they moved size.
Volume is rising beneath the surface — not noise, but preparation.
🔥 Tactical Note:
We wait for the energy signature — when volume betrays intention.
The trap gets set. The weak follow. We execute.
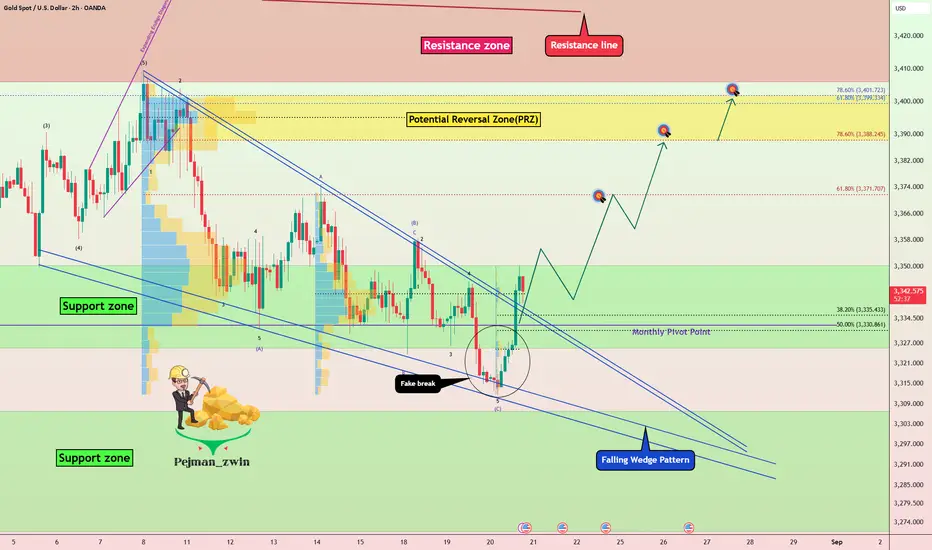
Gold Breaking Out of Falling Wedge Pattern – Rally Ahead?After creating a fake break below the Support zone($3,350-$3,326) , Gold ( OANDA:XAUUSD ) rose again above this zone and the Monthly Pivot Point .
If we look at the Gold chart on the 2-hour time frame from a Classic Technical Analysis perspective, we can see a falling reversal pattern , with Gold currently breaking the upper line of this pattern .
In terms of Elliott Wave theory, it seems that Gold is completing a corrective wave , and we should wait for the next impulse wave .
I expect Gold to start rising from the Support zone($3,350-$3,326) and rise to at least $3,369.
Second Target: Potential Reversal Zone(PRZ) = $3,402-$3,388
Note: Stop Loss (SL) = $3,320
Note: From today until Friday, important indexes will be released from the US, which can create excitement in financial markets, especially Gold, and even change the market trend when released.
FOMC Meeting Minutes = Today
Unemployment Claims = Tomorrow
Flash Manufacturing /Services PMI = Tomorrow
Fed Chair Powell Speaks = Friday
Gold Analyze (XAUUSD), 2-hour time frame.
Be sure to follow the updated ideas.
Do not forget to put a Stop loss for your positions (For every position you want to open).
Please follow your strategy; this is just my idea, and I will gladly see your ideas in this post.
Please do not forget the ✅ ' like ' ✅ button 🙏😊 & Share it with your friends; thanks, and Trade safe.
GOLD WEEKLY CHART MID/LONG TERM ROUTE MAPHey Everyone,
Please see our weekly chart update.
3387 Rejected, 3482 Gap Still Open
Following up on last week’s close above 3387, price has since shown rejection at that same level, leaving the 3482 gap still unfilled from the previous candle body. This pullback now highlights the 3281 gap below as support, keeping the broader structure intact but tempering the immediate upside momentum.
We’re watching for a potential re-challenge of 3387 before the path toward 3482 can resume. Until then, the market remains range-bound within these structural pivots.
Current Outlook
🔹 3387 Rejection
Despite previous week’s close above, price could not sustain higher, confirming 3387 as a tough barrier in the short term.
🔹 3281 as Key Support
The gap below sits at 3281, which remains the anchor pivot. As long as it holds, buyers have the chance to reload.
🔹 3482 Still Open
The unfilled gap to 3482 remains the long-term upside target. A re-test and hold above 3387 is needed before momentum can extend toward that objective.
Updated Levels to Watch
📉 Support – 3281
Critical base. A breakdown here would shift structure bearish.
📈 Resistance – 3387
Now the immediate barrier. Expect this to be re-challenged before further upside can develop.
📈 Upside Gap Target – 3482
Still open from previous structure. Comes into play only if 3387 can be cleared decisively.
Plan:
Price is consolidating between 3281 and 3387, with 3482 waiting above. Until 3387 is reclaimed on a closing basis, range trading remains the play. A clean break above flips bias bullish toward 3482, while failure at 3281 risks a deeper rotation.
Thanks as always for your support,
Mr Gold
GoldViewFX

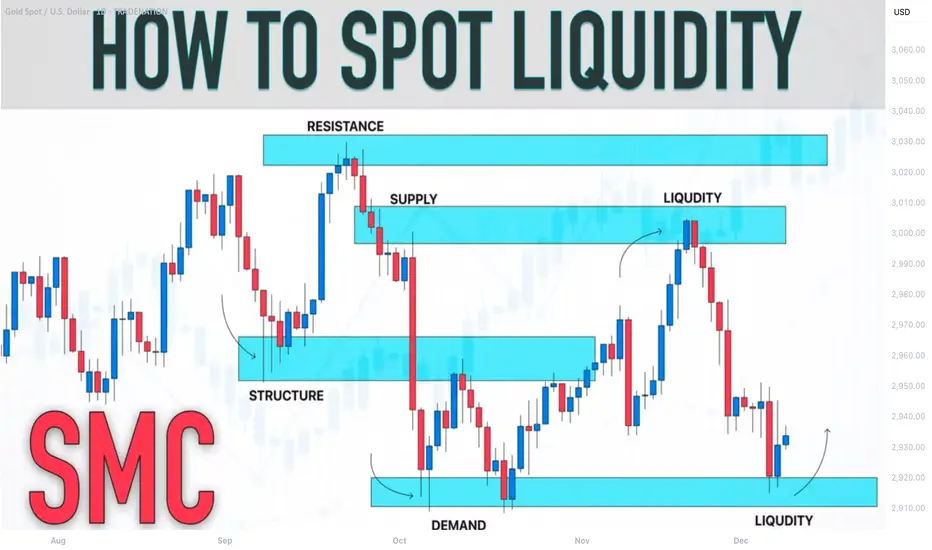
SMC Trading Basics. Liquidity Zones & How to Identify Them
In the today's article, I will teach you the concept of liquidity zones and how to identify them properly, trading Forex, Gold, Crypto and Indexes.
Simply put, a liquidity zone is a certain area on a price chart where a significant concentration of trading volumes occurred.
Huge trading volumes signify the presence of big players: hedge funds, banks, etc...
Correct identification of liquidity zones is essential for smart money trading, because such zones provide the safest and the most profitable trading opportunities.
There are 3 common characteristics of a valid liquidity zone:
1. Huge volume spikes upon its test
Take a look at the underlined blue area on USDCAD.
We see sharp volume spikes when the market was testing that area.
2. Strong rejections from such an area with a formation of long wicks
Look how the price reacts to the liquidity zone on USDJPY.
We see multiple strong rejections from that.
3. Long consolidation within that zone
Bitcoin was "standing" on a liquidity zone for more than 3 weeks, barely moving while trading volumes were quietly accumulating.
4. Multiple strong bullish or bearish reactions to that area
Just look how many times the underlined area was respected by the buyers and by the sellers. That is a perfect example of a liquidity zone.
To underline a liquidity zone properly, follow these simple rules:
1. If the price is ABOVE the liquidity zone, its lower boundary
will be the lowest wick within that area and its upper boundary will be the lowest candle close. Such a liquidity zone will be called a demand area.
Here is the example of drawing a liquidity zone on GBPUSD.
The lower boundary of the zone is the lowest wick, while its upper boundary is the lowest candle close.
2. If the price is BELOW the liquidity zone, its upper boundary will be the highest wick within that area and its lower boundary will be the highest candle close. Such a liquidity zone will be called a supply area.
Here is the liquidity zone that I identified on Gold following our rules.
Remember, that you can identify liquidity zones on any time frame. However, the rule is that the higher is the time frame, the stronger is the liquidity zone.
I prefer to analyze the liquidity zones on a daily time frame.
Once you underlined liquidity zones, you should realize that within these areas, big players are expected to place their orders in the future.
For that reason, after the tests of such areas, a strong bullish or bearish movements will be expected.
Here is a huge liquidity zone that I spotted on GBPJPY.
Look at a strong bearish movement that initiated after its test.
Your task as a smart money trader will be to identify bullish or bearish confirmations and understand the intentions of big players. With experience, you will learn to recognize valid signals.
❤️Please, support my work with like, thank you!❤️
I am part of Trade Nation's Influencer program and receive a monthly fee for using their TradingView charts in my analysis.
GOLD 4H CHART ROUTE MAP UPDATEHey Everyone,
Please see update on our 4h chart idea.
Once again great finish to the week with our chart idea playing out, as analysed.
We were range bound all week on this chart, playing between 3293 and 3361. Today we got our Bullish target at 3361 complete! We will now look for ema5 cross and lock above 3361 for a continuation.
BULLISH TARGET
3361 - DONE
EMA5 CROSS AND LOCK ABOVE 3361 WILL OPEN THE FOLLOWING BULLISH TARGETS
3424
EMA5 CROSS AND LOCK ABOVE 3424 WILL OPEN THE FOLLOWING BULLISH TARGET
3499
BEARISH TARGETS
3293
EMA5 CROSS AND LOCK BELOW 3293 WILL OPEN THE SWING RANGE
3236
3171
EMA5 CROSS AND LOCK BELOW 3171 WILL OPEN THE SECONDARY SWING RANGE
3089
2996
We will now come back Sunday with a full multi timeframe analysis to prepare for next week’s setups, including updated views on the higher timeframes, EMA5 alignments, and structure expectations going forward.
Thanks again for all your likes, comments, and follows.
Wishing you all a fantastic weekend!!
Mr Gold
GoldViewFX

3330 Keys to Today's Strategy✏️The weekend gold trading strategy has not changed much. mainly based on the 2 border zones of the box from 3359 to 3330. The weak upward momentum in recent days makes gold easy to fall on the weekend. The 3330 zone is still a very special zone and wait for clear confirmation from the candle to trade to avoid False break. Be careful not to trade against the trend with the BUY signal when the 3330 zone is broken, the reaction of the buyers is very likely to come to the 3303 zone.
📉 Key Levels
SELL trigger Break and trading bellow 3330
Target 3285
BUY Trigger Confirmation of the candle closing above 3340
Target 3380
Resistance: 3340-3358-3378
Support: 3330-3304-3285
Leave your comments on the idea. I am happy to read your views.
Gold Watching 3,360 Support as Powell Dovish Tone Weighs on USDHey Traders, in tomorrow's trading session we are monitoring Gold for a buying opportunity around 3,360 zone, Gold (XAUUSD) recently broke above the 3,360 resistance, turning it into an important support level to watch on any pullback. A retracement into this zone could help determine whether the breakout has strength to extend toward higher levels.
On the fundamental side, Fed Chair Powell struck a dovish tone, signaling support for a potential September rate cut, citing lower inflation pressures and risks in the labor market. This backdrop keeps USD under pressure and maintains a bullish bias for Gold in the near term.
Monitoring price action around 3,360 to assess whether buyers defend this level or if deeper consolidation unfolds.
Trade safe, Joe.

GOLD 1H CHART ROUTE MAP UPDATE & TRADING PLAN FOR THE WEEKHey Everyone,
Please see our updated 1h chart levels and targets for the coming week.
We are seeing price play between two weighted levels with a gap above at 3390 and a gap below at 3365. We will need to see ema5 cross and lock on either weighted level to determine the next range.
We will see levels tested side by side until one of the weighted levels break and lock to confirm direction for the next range.
We will keep the above in mind when taking buys from dips. Our updated levels and weighted levels will allow us to track the movement down and then catch bounces up.
We will continue to buy dips using our support levels taking 20 to 40 pips. As stated before each of our level structures give 20 to 40 pip bounces, which is enough for a nice entry and exit. If you back test the levels we shared every week for the past 24 months, you can see how effectively they were used to trade with or against short/mid term swings and trends.
The swing range give bigger bounces then our weighted levels that's the difference between weighted levels and swing ranges.
BULLISH TARGET
3390
EMA5 CROSS AND LOCK ABOVE 3390 WILL OPEN THE FOLLOWING BULLISH TARGETS
3422
EMA5 CROSS AND LOCK ABOVE 3422 WILL OPEN THE FOLLOWING BULLISH TARGET
3439
BEARISH TARGETS
3365
EMA5 CROSS AND LOCK BELOW 3365 WILL OPEN THE FOLLOWING BEARISH TARGET
3347
EMA5 CROSS AND LOCK BELOW 3347 WILL OPEN THE FOLLOWING BEARISH TARGET
3324
EMA5 CROSS AND LOCK BELOW 3324 WILL OPEN THE SWING RANGE
3304
3281
As always, we will keep you all updated with regular updates throughout the week and how we manage the active ideas and setups. Thank you all for your likes, comments and follows, we really appreciate it!
Mr Gold
GoldViewFX

Bullish Setup on Gold – Targets Ahead!Gold ( OANDA:XAUUSD ) is still moving in the Support zone($3,350-$3,326) and near the Monthly Pivot Point .
In terms of Elliott wave theory , it seems that Gold has managed to complete the Zigzag Correction(ABC/5-3-5) , and we should wait for the rising waves .
Also, we can see the Regular Divergence(RD+) between Consecutive Valleys .
I expect Gold to rise to at least $3,371 AFTER breaking the Resistance lines .
Second Target: $3,394
Third Target: $3,407
Note: Stop Loss (SL) = $3,317
Gold Analyze (XAUUSD), 1-hour time frame.
Be sure to follow the updated ideas.
Do not forget to put a Stop loss for your positions (For every position you want to open).
Please follow your strategy; this is just my idea, and I will gladly see your ideas in this post.
Please do not forget the ✅ ' like ' ✅ button 🙏😊 & Share it with your friends; thanks, and Trade safe.

GOLD Best 2 Places For Buy & Best Place For Sell Cleared !Here is m y opinion on GOLD On 15 Mins T.F , We have a sideway movement since week start between 3343.00 to 3326.00 and finally yesterday we had a breakout and the price touch 3311.00 and the price moved to upside and again above 3326.00 so it`s still my fav place to can enter a buy trade , and the second place we can buy from it 3333.00 so we can buy from both levels , 3343.00 will be the best place for sell specially if we have not a daily closure above it , now the price very near buy area we can wait the price to retest the support area and then enter a buy trade and targeting 3343.00 and when the price touch it and give us a good bearish P.A , we can enter a sell trade and targeting 3326.00 ., and if we have a daily closure above 3343.00 i will think only for buy until end of the week .
