XAU/USD Intraday Plan | Support & Resistance to WatchGold is trading around $3,326, moving lower after repeated failures to reclaim the $3,344 resistance yesterday. Price is now testing the lower edge of the First Support Zone ($3,324–$3,344).
It remains capped below both the 50MA (pink) and 200MA (green), which have flattened out, indicating a bearish or indecisive market structure.
If sellers gain momentum and break below $3,324, focus shifts toward the Secondary Support Zone ($3,304–$3,281). A clean break under $3,281 would expose the HTF Support Zone ($3,254–$3,229).
For buyers, only a sustained move back above $3,344 and the 200MA would shift momentum, opening the path toward $3,364 and $3,386.
📌 Key Levels to Watch
Resistance:
$3,344
$3,364
$3,386
$3,406
Support:
$3,324
$3,304
$3,281
$3,254
$3,229
📌 Fundamental Focus – Friday, Aug 22
Today’s spotlight is on the Jackson Hole Symposium, with key speeches from Fed Chair Powell, FOMC members, and President Trump expected to drive volatility. Markets will be highly reactive to policy signals and geopolitical remarks.
⚠️ Friday Risk Warning: Expect higher volatility, potential intraday manipulations, and sharp position adjustments as markets head into the weekend close. Liquidity often thins in late Friday sessions, so manage exposure carefully and avoid holding unnecessary risk over the weekend.
XAUUSD trade ideas


XAUUSD – TECHNICAL BUY CALL (3H TF) | 21 AUG 2025 | 03:10 PM GMTXAUUSD – TECHNICAL BUY CALL (3H TF) | 21 AUGUST 2025 | 03:10 PM GMT
Gold is trading within a higher timeframe range (light blue channel). After touching a high of 3410, it pulled back in a bearish channel (light yellow) and has now broken out, forming a lateral pullback that appears to be complete. This structure signals potential continuation to the upside.

GOLD Is Bullish! Long!
Here is our detailed technical review for GOLD.
Time Frame: 2h
Current Trend: Bullish
Sentiment: Oversold (based on 7-period RSI)
Forecast: Bullish
The market is on a crucial zone of demand 3,331.64.
The oversold market condition in a combination with key structure gives us a relatively strong bullish signal with goal 3,350.06 level.
P.S
We determine oversold/overbought condition with RSI indicator.
When it drops below 30 - the market is considered to be oversold.
When it bounces above 70 - the market is considered to be overbought.
Disclosure: I am part of Trade Nation's Influencer program and receive a monthly fee for using their TradingView charts in my analysis.
Like and subscribe and comment my ideas if you enjoy them!

XAUUSD,EURUSD and GBPUSD Analysis todayHello traders, this is a complete multiple timeframe analysis of this pair. We see could find significant trading opportunities as per analysis upon price action confirmation we may take this trade. Smash the like button if you find value in this analysis and drop a comment if you have any questions or let me know which pair to cover in my next analysis.

Short-term GOLD analysis
Gold appears to be completing a diametric, the last wave of which (wave-g) could end at 3308-3290.
If the post-pattern move fails to pass, a combination pattern is likely to form.
Good luck
NEoWave Chart

XAUUSD trend exhausion on small time frame.Market Update: Gold Order Flow and Bollinger Band Insights
Gold has surged strongly in the last session, but deep insights from order flow data indicate a potential shift: negative delta has formed at the top of the rally, meaning sellers have overtaken buyers. This is a common precursor to profit-taking and possible short-term reversals.Meanwhile, price has closed outside the upper Bollinger Band, a technical signal that the uptrend may be overheated for now. When price exceeds the upper band after a strong move, it often marks trend exhaustion, with a high likelihood of a temporary pullback or sideways movement.Traders may want to take profits on long positions or look for short-term scalp sells while remaining alert to broader trend context."
Explanation of indicators and their studies used.
1. Order Flow Insights
The left chart uses a Volume Footprint (Order Flow) Chart to reveal detailed buying and selling activity at each price level for Gold/U.S. Dollar (XAU/USD).
Notice the highlighted area:
There is a negative delta (negative value, shown in red) at the top of the recent price move.
Delta represents the difference between aggressive buyers and sellers at each price level. Negative delta means sellers dominated.
This pattern is a confirmation of profit booking by buyers and signals that sellers are taking control as the buying momentum fades.
2. Bollinger Upper Band and Trend Exhaustion
The right chart shows the Bollinger Bands overlaid on a 15-minute candlestick chart.
The recent candle closed outside the upper Bollinger Band:This is a classic sign of momentum overheating, as prices stretch far from the mean (the middle Bollinger Band).When price closes outside the upper band after a strong run, it suggests trend exhaustion or at least a high risk of a short-term pullback.
My translation into trade placement.
Order flow reveals that after a strong rally, aggressive selling has emerged at the top, shown by the negative delta. This typically signals profit-taking from earlier buyers, and often leads to quick short-term pullbacks or potential reversal opportunities for nimble traders.
The latest price action has pushed Gold sharply above the upper Bollinger Band, signaling the rally may be overextended. Historically, such moves are unsustainable and often see at least a minor retracement or consolidation as buyers pause and sellers step in.

XAU/USD Intraday Plan | Support & Resistance to WatchPrice failed to break the $3,344 resistance yesterday, followed by a sharp move lower. It is currently trending just below the $3,324 resistance. Price remains capped under both moving averages, and the structure stays bearish.
The first resistance is at $3,324. A sustained move above $3,344 is needed to shift momentum, opening the path toward $3,364 and $3,386. If buyers fail to reclaim this level, the downside bias remains intact, with risk of a test into the Secondary Support Zone ($3,304–$3,281). A clean break below that would expose the HTF Support Zone ($3,254–$3,229).
📌Key Levels to Watch
Resistance:
‣ $3,324
‣ $3,344
‣ $3,364
‣ $3,386
‣ $3,406
Support:
‣ $3,304
‣ $3,281
‣ $3,254
‣ $3,229
🔎 Fundamental Focus:
The main event today is the FOMC Meeting Minutes , which could provide clearer signals on the Fed’s rate path and drive sharp moves in gold.
⚠️ Risk/Volatility Warning:
High-impact news flow begins today with the Fed minutes and continues into Thursday’s data and Friday’s Jackson Hole Symposium. Expect increased volatility and fakeouts – manage risk carefully and wait for confirmation before entering trades.


XAUUSD H1 – Following Wave 3 DownGold (XAUUSD) on the H1 is respecting Elliott Wave counts. After completing wave (ii)/(b), price rejected from supply and is currently unfolding wave (iii) of (c), pointing towards deeper downside.
-Wave structure shows completion of corrective move and start of impulsive wave 3.
-Clean rejection at 3358–3347 zone (LR & MD block) acting as strong resistance.
-Price breaking trendline, confirming bearish continuation.
-Next liquidity zone sits around 3297–3268 (LZB).
Trade Plan
-Bias: Short / Bearish (Wave 3 in play)
-Entry Zones:
Rejection retest near 3338–3347
Or continuation break below 3327

XAUUSD – Short BuyXAUUSD Buy Signal
Entry: 3,338 – 3,340 (current support zone)
Stop Loss: Below 3,329
Take Profit 1: 3,350
Take Profit 2: 3,358 – 3,360
Bias: 📈 Bullish – expecting breakout continuation if 3,350 breaks and holds.

Gold Technical Outlook – Midpoint Support Holds, Retest of 3,500On the Daily Chart, gold has been climbing steadily since New Year’s Day, with several pullbacks along the way but maintaining its overall bullish trajectory.
After breaking into the 3,167.72 – 3,430.46 range, price has shown comfort within this zone. The midpoint at 3,286.94 (Green Line) has acted as a supportive bias, with price holding above it — reinforcing the view that bulls remain in control.
That said, this period of consolidation has lasted longer than expected, breaking the previous rising trajectory (shown by the diagonal Red Line). This suggests that momentum has weakened.
Importantly, this doesn’t confirm that the bullish run is over — but it does highlight the market’s current struggle to push higher with strength. A high of 3,500.02 was briefly tested but quickly rejected, which leads me to believe the market still has reason to retest that level in the near future.

Gold is suffering.Gold has been suffering on higher time frames for some time, but on shorter time frames, you can see some fluctuations in this symbol. Our expectation for the gold symbol is that it will make a correction to the QML range and then its price will increase.

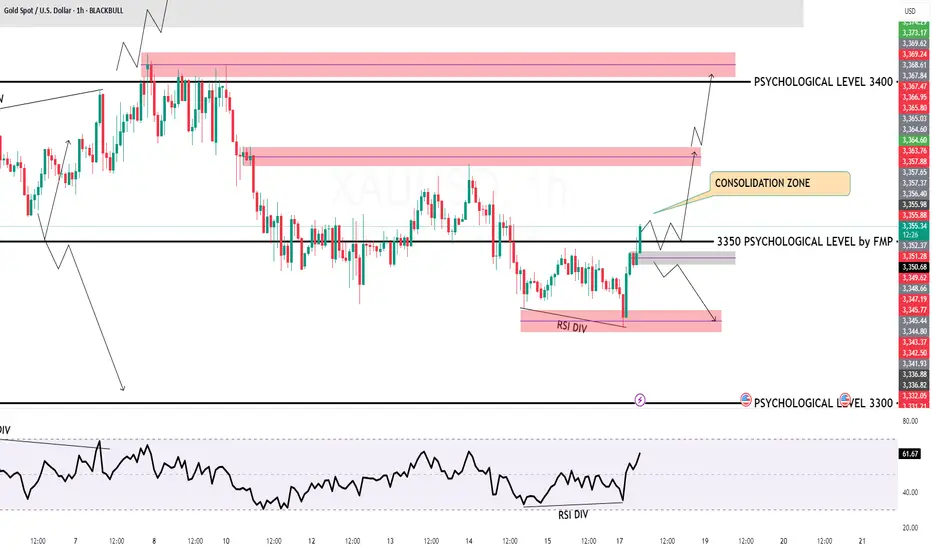
GOLD H1 Intraday Chart Update For 18 AUG 2025Good Morning Traders
as you can see that GOLD successfully break 3350 Psychological for Shorter term scenario
All eyes on 3330 level breakout for the day if market breaks 3330 level then it will move towards 3310 level otherwise market will move towards 3380 level soon
Disclaimer: Forex is RISKY

Trading Game of the Day 17 August 2025 (Teaching Purpose)Trading Plan :-
Validity of the concepts is very important in trading which depend on multiple factors
1-LIQUIDITY:-which identified by SWING HIGH and SWING LOW
2-Validity of OB ,BB and RB which depend on the following :
a-presence of FVG
b-presence of MSS
c-it goes with bias
3-the overall is the understanding with vigilance and awareness the market movement in any direction which depend on good observation of the chart away from emotional and unrealistic expectation
4-the presence of the wick against the bias should be neglected because it does not have validity features (like FVG ,MSS and move against bias)
THANK YOU

Sell/buy/sell!Hi traders. As you see market made lots of traps in the market way but it is simple easy to recognize them. It is a pretty simple Road Map with AODMS LFTS' Trap(wink)

Long on XAUUSD Again similar to my last setup. Price seeks liquidity below lows, above highs and balancing of FVG. This setup is based on an internal liquidity sweep, change of charachter, price comes back down to mitigate the FVG left on the 15m chart left behind from the move up. The FVG is withing my Kill Zone on the Fib. RR is 1:8 and i would consider a high risk trade but im happy to take it only risking 1%.

The Silent Truth: The Market Reflects You“Every chart you look at is not showing the market. It’s showing you.”
Most traders think they’re fighting the market.
But the truth is — the market has no reason to fight you.
It doesn’t know your entry, your stop, your target, or your fear.
What it does know is this: your reaction .
When price moves fast against you, what do you feel?
When it slowly grinds in your favor, what thoughts rise?
When you miss a setup, what story do you tell yourself?
The market reflects these things back at you.
The frustration is yours.
The hesitation is yours.
The overconfidence is yours.
Price is just price.
Neutral. Silent. Indifferent.
But through that silence, it becomes a mirror.
And until you stop projecting your own fear and greed onto the chart, you’ll keep seeing ghosts that don’t exist.
The real edge is not in finding the perfect setup.
It’s in facing the reflection without distortion.
📘 Shared by @ChartIsMirror
If this resonates, share your thoughts in the comments. Sometimes the most important discussion in trading isn’t about levels or entries — it’s about the trader in the mirror.

Gold 30Min Engaged ( Bullish Entry Detected )Time Frame: 30-Minute Warfare
Entry Protocol: Only after volume-verified breakout
🩸Bullish Reversal - 3340
➗ Hanzo Protocol: Volume-Tiered Entry Authority
➕ Zone Activated: Dynamic market pressure detected.
The level isn’t just price — it’s a memory of where they moved size.
Volume is rising beneath the surface — not noise, but preparation.
🔥 Tactical Note:
We wait for the energy signature — when volume betrays intention.
The trap gets set. The weak follow. We execute.

GOLD ROUTE MAP UPDATEHey everyone,
Following up on yesterday’s update for our 1H chart route map:
The key retracement range continued to provide support, and we saw the reactionary bounce we expected.
Right now, we’re range-bound between 3329 and 3354.
As long as 3329 holds, we can expect continued bounces, tracking the movement upward.
We will keep the above in mind when taking buys from dips. Our updated levels and weighted levels will allow us to track the movement down and then catch bounces up.
We will continue to buy dips using our support levels taking 20 to 40 pips. As stated before each of our level structures give 20 to 40 pip bounces, which is enough for a nice entry and exit. If you back test the levels we shared every week for the past 24 months, you can see how effectively they were used to trade with or against short/mid term swings and trends.
The swing range give bigger bounces then our weighted levels that's the difference between weighted levels and swing ranges.
BULLISH TARGET
3403
EMA5 CROSS AND LOCK ABOVE 3403 WILL OPEN THE FOLLOWING BULLISH TARGETS
3422
EMA5 CROSS AND LOCK ABOVE 3422 WILL OPEN THE FOLLOWING BULLISH TARGET
3439
BEARISH TARGETS
3377 - DONE
EMA5 CROSS AND LOCK BELOW 3377 WILL OPEN THE FOLLOWING BEARISH TARGET
3354 - DONE
EMA5 CROSS AND LOCK BELOW 3354 WILL OPEN THE FOLLOWING BEARISH TARGET
3329
EMA5 CROSS AND LOCK BELOW 3329 WILL OPEN THE SWING RANGE
3304
3281
As always, we will keep you all updated with regular updates throughout the week and how we manage the active ideas and setups. Thank you all for your likes, comments and follows, we really appreciate it!
Mr Gold
GoldViewFX

xauusd (GOLD): a signal Hi guys!
Key Technical Points:
Ascending Channel:
Price action has been moving within a well-defined ascending channel.
Currently, the price has pulled back and is approaching the lower boundary of this channel.
This lower boundary often acts as a support area where buyers might step in.
Support Zone (Red Box):
The red highlighted area, around $ 3,340-$ 3,350 USD, is a key support zone.
This zone aligns w ith the lower boundary of the channel , adding more weight to the support.
Price is currently testing this area, which could act as a springboard for the next upward move.
Resistance Zone (Blue Box):
The upper resistance zone between roughly 3,425 and 3,440 USD is a major target for bulls.
This is a previous high area where sellers might re-enter the market.
-------------------------------------------------------
Trade Idea:
Long Position:
Entry could be considered near the lower boundary of the channel and the red support zone (around 3,340-3,350 USD).
Stop loss placement: Just below the red support zone to limit downside risk.
Target: The upper resistance zone at around 3,425-3,440 USD.

XAU / USD 4 Hour ChartHello traders. I am posting a 4 hour chart as we are at perfect area of interest for me. Watching the overnight sessions to see if we push up a bit or keep moving down. Lower time frame confirmation is a must. Let's see how the 4 hour candle closes. I will update during the overnight sessions or early enough before Pre NY volume tomorrow morning. Be well and trade the trend. Shout out to Big G. I will post if I get in a scalp trade in the next hour or so. Thanks so much.
