GOLD NEXT MOVE (expecting a bearish move)(08-08-2025)Go through the analysis carefully and do trade accordingly.
Anup 'BIAS for the day (08-08-2025)
Current price- 3390
"if Price stays below 3400, then next target is 3380, 3355 and 3340 and above that 3420 and 3455 ".
-POSSIBILITY-1
Wait (as geopolitical situation are worsening )
-POSSIBILITY-2
Wait (as geopolitical situation are worsening)
Best of luck
Never risk more than 1% of principal to follow any position.
Support us by liking and sharing the post.
XAUUSD trade ideas

THE KOG REPORT - UpdateEnd of day update from us here at KOG:
We did not expect an open like that! Honestly, we were expecting a low volume day of ranging and choppy price action like last week, but from the get go, gold was off! It resistance the level we wanted, came down in to the 3370-5 level we wanted, gave us nearly 100pips, then continued to break through the bias level and complete all of our target prices. Because we didn't get the opportunity to short it, we only managed to capture some nice tap and bounces to walk away with an extremely good pip capture.
So, what now?
We have a red box break with the lower level 3335-40 open but price is struggling here just below 3350. Resistance is the 3365 level which would be a good target from that lower region as long as we support. We'll keep that path shown for now.
KOG’s Bias for the week:
Bullish above 3365 with targets above 3408, 3410, 3415 and above that 3420
Bearish below 3365 with targets below 3359✅, 3355✅, 3350✅ and below that 3345✅
RED BOX TARGETS: (You can see how effective these are so please make use of these together with the analysis and bias we share. It all goes together, without PRICE ACTION knowledge you only have hope)
Break above 3406 for 3407, 3410, 3420, 3429, 3430 and 3435 in extension of the move
Break below 3395 for 3393✅, 3385✅, 3380✅ and 3370✅ in extension of the move
Please do support us by hitting the like button, leaving a comment, and giving us a follow. We’ve been doing this for a long time now providing traders with in-depth free analysis on Gold, so your likes and comments are very much appreciated.
As always, trade safe.
KOG

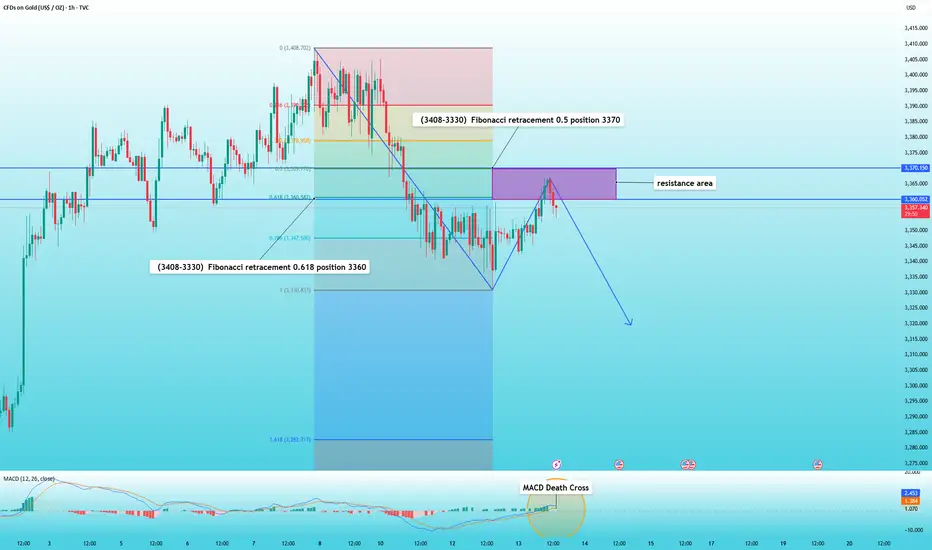
Gold rebounds and is facing resistance, waiting for a declineIn the previous article, I said that if the gold price cannot hold above 3370 in the short term, then the gold price will continue to fall.
Today's rebound in the Asian and European sessions shows mixed gains and losses on the K-line chart, indicating a weak rebound. After rebounding to 3367, gold prices turned downward again.
Meanwhile, the 1-hour MACD indicator also shows signs of forming a death cross. The Fibonacci retracement indicator from 3408 to 3330 indicates that the 0.618 level is at 3360, and the 0.5 level is at 3370. Therefore, the 3360-3370 range is currently a resistance zone.
Therefore, I still maintain my previous view that as long as it cannot hold 3370, you can short in the resistance area.
GOLD Buyers In Control Now , Long Setup To Get 200 Pips !Here is My 15 Mins Gold Chart , and here is my opinion , we finally above 3358.00 and we have a 4H Candle closure above it And Perfect Breakout and this give us a very good confirmation cuz we have not any 4H closure above this area since this week start , so we have a good confirmation now to can buy after the price go back to retest the broken area to can use a small stop loss , and we can targeting 100 to 200 pips . if we have a daily closure below this area this mean this idea will not be valid anymore .
Reasons To Enter :
1- Clear Breakout On Bigger T.F
2- Clear Bullish Price Action .
3- Bigger T.F Giving Good Bullish P.A .
4- The Price Take The Last High .

XAU/USD UPDATE - Potential TargetsDear Friends in Trading,
How I see it,
Let me know if anything is unclear.
Targets indicated are 4HR liquidity pools.
Keynote:
At this time - no "Russia-Ukraine" peace deal reached yet.
Potential for a "GAP-UP MONDAY" open.
I sincerely hope my point of view offers a valued insight
Thank you for taking the time study my analysis.
The Silent Battlefield and the Two FortressesPrologue
The bear ate the raspberries and then found the honey pot just below 3340 — mission accomplished. But a real strategist never naps, so after a winning raid let’s scout the front!
Chapter 1: The Silence After Victory
The big clash of the past days — bears broke out of the wedge and seized the 3340 valley — is over. Now there’s silence. On the 1-hour chart it’s eerie silence. Bulls and bears sit in their trenches, licking their wounds and staring each other down across no-man’s-land. Price is pacing in a ridiculously tight range like a caged tiger walking circles. This is the Armistice Phase — an over-compressed spring waiting for any excuse to snap.
Chapter 2: Reports From the Spies
I sent my most trusted indicators behind enemy lines. Their brief reads shorter than a grocery list. 😄
Arena TrendIQ (the trend psychologist):
Headquarters map is still red — on paper bears hold the ground. But! The black trend-strength line has faded to magenta and sits below the horizon. Translation: strength… there is none. Even more telling: there’s no clear direction either; both the green (LONG) and red (SHORT) signals are under the horizon or just peeking out of the trench to glance around, then ducking back down.
RSI (the morale officer):
Even duller. Reading sits just above 50 (~52) and above RSI-EMA. In a range, that doesn’t say much — RSI will wander up and down without momentum. It can’t decide whether the soldiers are laughing or crying. Net: neutral mood; no convincing bull or bear energy.
Chapter 3: The Siege of Two Fortresses
On this quiet field two strongholds face each other. The next battle is about which one falls first.
Southern Fortress (Bears’ Keep): the 3340 zone (support). If price closes below, that’s the banner for another bear charge south.
Northern Fortress (Bulls’ Bastion): the 3370 zone (resistance). A break above signals the uprising has legs and bulls try to reclaim command.
Price is trapped between these walls, with my moving averages piling up around them like extra defensive lines.
Chapter 4: Whispers in the Wind — News
On the news front it’s as quiet as a library after closing. After last week’s NFP and yesterday’s CPI, the market is digesting. No scheduled data today that should rattle the ground. So the script is likely to be written by technicals, trader patience, and the skirmish around those two forts.
🔮 My Take
We’ve already won our skirmish — profits in the pocket, stress in the past. The worst move now is to go joyriding across no-man’s-land between the forts. No strength, no direction, RSI meh, EMAs clustered — this moment isn’t a fresh entry.
Battle plan = patient sniper. Wait for the enemy to make a clear move.
If the Southern Fortress (3340) falls, I’ll look for a new short. For example, if RSI, EMAs, strength and direction align, I’d consider entries below ~3330.
If the Northern Fortress (3370) breaks, I’ll entertain a long, but only if the “ingredients” line up. Are we actually cooking, or just loitering in the kitchen?
Until then, everyone lean back and let the market show its hand.
And now… for my fellow gold-hunters, the same analysis in Hungarian, because some things just hit harder in your mother tongue.
A medve megette a málnát, majd megtalálta a mézesbödönt is a 3340-es szint alatt kicsivel, így a külstés teljesítve, de egy igazi stratéga sosem pihen így nézzük meg a győztes csata után mi a helyzet a fronton! A címe: A Csendes Csatatér és a Két Erőd
1. Fejezet: A győzelem utáni csend
Az elmúlt napok nagy ütközete, ahol a medvék áttörték az éket és elfoglalták a 3340-es völgyet, véget ért. Most csend van, ami 1 órás idősíkon kísérteties csend. A bikák és a medvék a lövészárkokban ülnek, nyalogatják a sebeiket és farkasszemet néznek egymással a senki földjén. Az árfolyam egy hihetetlenül szűk sávban mozog, mint egy ketrecbe zárt tigris, aki körbe-körbe jár. Ez a "Nagy Bizonytalanság" vagy a "Fegyverszünet" fázisa. Olyan, mint egy összenyomott rugó, ami arra vár, hogy valamiért kipattanhasson.
2 Fejezet: A kémek jelentése
Kiküldtem a legmegbízhatóbb indikátoraimat, hogy hozzanak hírt az ellenséges táborokból. A jelentésük rövidebb, mint egy bevásárlólista. 😄
Arena-Hub TrendIQ (A Trend Pszichológusa):
A főparancsnokság térképe még mindig piros, tehát papíron a medvéké a terület, DE! A fekete trenderő vonal magentára változott, és a horizont alatt van. Ez azt jelenti, hogy erő... na az nincs. Ami ennél még inkább a semmit jelenti, hogy irány sincs, mert a zöld (felfelé=LONG) és a piros (lefelé=SHORT) jelünk is a horizont alatt van, vagy éppen kidugta a fejét a lövészárokból, hogy körbepásztázza a terepet, de semmit nem látott így visszahúzta.
Arena-RSI (A Hangulatfelelős):
Ez a jelentés még ennél is unalmasabb. A mutatója éppen 50 felett van (52), de az RSI-EMA felett van. Ebben az esetben nem igazán jelent semmit, mert az oldalazásban ide-oda, fel-le fog vándorolni az RSI, ami nem mutat momentumot. Nem tudja megmondani, hogy a katonák most sírnak vagy nevetnek. Abszolút semleges a hangulat, se bikás, se medvés erőt nem tud felmutatni.
3 Fejezet: A Két Erőd ostroma
A csendes csatatér két oldalán két erőd áll egymással szemben. A következő nagy csata azért fog dúlni, hogy melyiket sikerül bevenni.
A Déli Erőd (a Medvék Vára): Ez a 3340-es sáv a támasz. Ez az a masszív fal, amit a medvéknek le kellene bontaniuk, hogy folytathassák útjukat dél felé (lefelé). Ha az árfolyam ez alá a szint alá zár, az a jel, hogy a medvék újabb támadást indítanak.
Az Északi Erőd (a Bikák Bástyája): Ez a 3370-es sáv az ellenállás. Ha a bikák át tudnák törni ezt a falat, az lenne a jel, hogy a lázadásuk sikerrel járt, és újra megpróbálják átvenni az irányítást.
Az árfolyam jelenleg e két erőd között van csapdában. A következő lépés egy kitörés lesz ebből a zónából. Itt tornyosulnak a mozgóátlagaim is, mint egy extra védelmi vonal.
4 Fejezet: Suttogás a szélben – A hírek
A hírek frontján ma olyan csend van, mint egy könyvtárban zárás után. A múlt heti NFP és a tegnapi CPI után a piac most emészt. Nincs ma olyan nagy, előre bejelentett adat, ami földrengést okozna. Ez azt jelenti, hogy a forgatókönyvet ma a technika, a kereskedők türelme és a fenti két erőd körüli harc fogja írni.
🔮 Szerintem... 😇
A legfontosabb, hogy MI már megnyertük a csatánkat, és hogy türelmesen kivárjuk a következő ütközetet. A profit zsebben, a stressz a múlté. A legrosszabb, amit egy kereskedő most tehet, az az, hogy a senki földjén, a két erőd között próbál szerencsét. Se erő, se irány, se RSI, se EMA, minden azt mondja, hogy itt most ebben a pillanatban nem kell belépni.
A haditerv a következő: A stratégiánk most a "türelmes mesterlövészé". Nem mozdulunk, amíg az ellenség nem tesz egy egyértelmű lépést.
Ha a Déli Erőd (3340) elesik, akkor lehetőséget keresünk egy újabb short pozícióra. Pl.: ha RSI, az EMA az erő és az irány is a helyén van, akkor 3330 alatt beléphetünk egy újabb shortba.
Ha az Északi Erőd (3370-es) elesik, akkor elgondolkodhatunk egy long pozíción, de ott is figyelnünk kell az "összetevők" mit mutatnak. Lesz -e főzés, vagy csak a konyhában ténfergünk.
Amíg ez kiderül mindenki dőljön hátra, és várjuk mi lesz.

Gold steady near 3,350 after CPIHello everyone !
Gold prices remain steady around the 3,350 level, recovering notably from overnight lows following the release of U.S. inflation data.
July’s Consumer Price Index rose 2.7% year-on-year, slightly below the 2.8% forecast. However, core CPI climbed 3.1%, exceeding the 3.0% estimate and June’s 2.9% reading. These figures have reinforced market expectations for a 0.25% interest rate cut by the Federal Reserve on September 17.
The market also reacted to comments from U.S. President Donald Trump, who announced that imported gold would not face tariffs in the U.S. This decision has fueled volatility in gold over the past two sessions. Any tariff imposition on bullion could significantly impact global gold flows.
If the no-tariff policy is officially confirmed, gold prices may stabilize. However, any conflicting signals could trigger fresh price swings.
From a technical perspective, gold is consolidating in a sideways range after breaking below its trendline. The 3,360 to 3,380 zone is now acting as a strong resistance area. A strong rejection here could reignite the downtrend, targeting the 3,310 level initially, with a further drop towards the key 3,300 level.

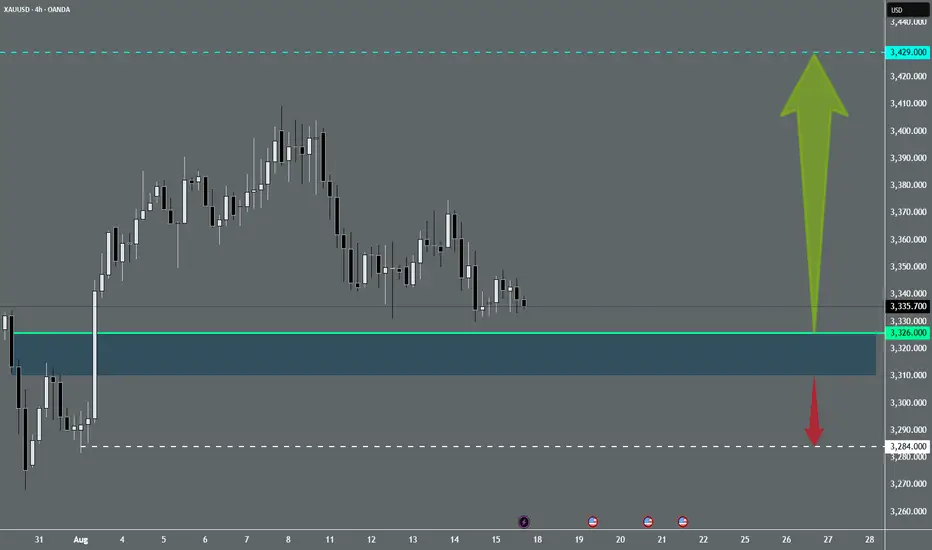
Possibility of uptrend After some fluctuation and correction, the upward trend is expected to continue to the specified resistance levels. If the price breaks through the support area, a continuation of the downward trend is likely.

XAU/USD Intraday Plan | Support & Resistance to WatchGold has broken above the 50MA (pink) but remains capped below the 200MA (green), trading just above the $3,353 key level. This area is acting as a pivotal barrier — a clean break and sustained hold above $3,353 is needed to shift momentum bullish.
A sustained break and hold above this zone could see momentum build toward $3,380, with further upside potential to $3,399 and $3,422. Failure to clear this area may keep price trapped in the pullback structure, risking another retest of $3,329 and possibly the Secondary Support Zone.
📌 Key Levels to Watch
Resistance:
‣ $3,380
‣ $3,399
‣ $3,422
Support:
‣ $3,353
‣ $3,329
‣ $3,313
‣ $3,295
🔎 Fundamental Focus
Multiple FOMC speeches and President Trump remarks today could spark volatility.
Expect choppy price action — manage risk around headlines.

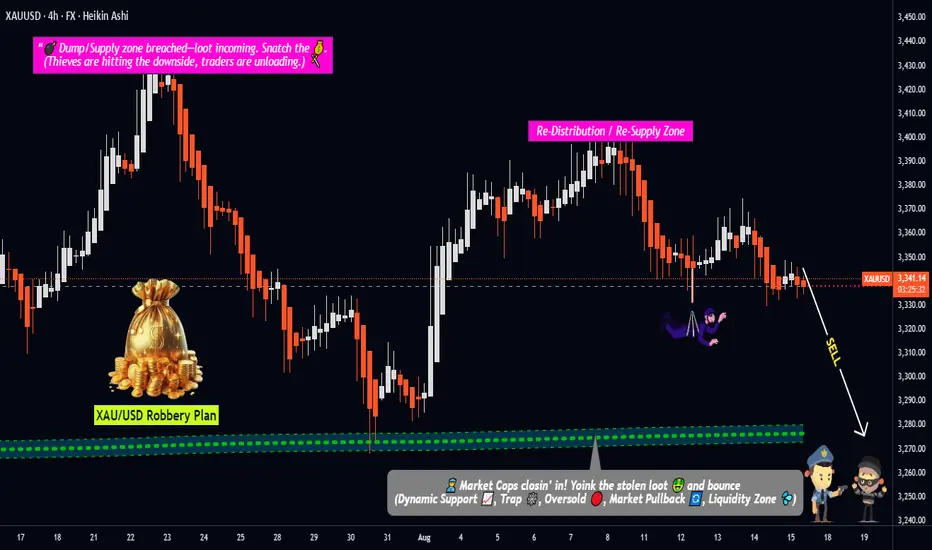
Gold Under Attack! Thief Trader’s Layered Sell Plan in Action!💣 XAU/USD GOLD HEIST: Police Waiting at 3270 – Escape Before They Catch Us! 🔐💰
🕵️♂️ Hello Thief OG’s, Money Grabbers & Market Shadows!
Today’s mission is Gold (XAU/USD) – not to wear, but to steal! 💸✨
🎯 MISSION BRIEF
We’re going BEARISH on Gold. No single-shot nonsense – we’re using layered SELL LIMIT traps to grab the loot piece by piece.
💼 Entry Layers:
3340.00
3350.00
3360.00
(💡 Add more layers if you want to go full gang mode.)
🛑 Stop Loss – The Alarm Trigger
SL @ 3380.00 🚨
But hey… Thief OG’s adjust it to your own strategy & risk. Don’t get caught with your mask off. 😎
💰 Target – The Escape Plan
Main Target: 3270.00 (Police barricade 🚔)
Quick Exit: 3280.00 (Escape van is ready 🚐)
📊 Why This Is the Perfect Hit
Price dancing near resistance – the “vault door” is open.
Weak bullish attempts = fake gold rush trap.
Trend sniffers pointing down on higher timeframes.
Market makers guarding at 3380 = the alarm system.
📜 Thief Trader Rules for This Mission
Avoid entering during major economic news bombs 💣.
Trail your SL once price moves in your favor – thieves who overstay get caught.
Always rob smart – we’re professionals, not gamblers.
💥 Support the Robberhood Crew!
Boost this idea if you want more Thief Trader missions.
Every boost = more ammo for the next market robbery.
Remember: No chase, no case. 🕶️💼💣
#XAUUSD #GoldTrade #BearishPlan #LayeringStrategy #ThiefTrader #RobTheMarket #BoostForMore
XAUMO Golden Report: FULL KILL ZONE BREAKDOWN.🔍 FULL MULTI-TIMEFRAME TECHNICAL DESTRUCTION
Short below 3,348.80, SL 3,353.20, TP 3,343.00.
MM building trap around VWAP, expecting breakdown. Jewel trade = short. Avoid breakout long unless clear volume shows up.
1. PRICE ACTION ANALYSIS (ALL TIMEFRAMES)
Multiple Pin bars & inverted hammers at POC zone (3,350.55) = clear signs of order absorption & rejection.
Wicks into 3,352.20 zone got rejected = trap move during kill hour yesterday.
Inside bar formation in H1 = energy buildup, coiling for one-directional expansion.
2. RANGE BOUND ZONE
Market is stuck between:
Value Area High (VAH) → 3,352.20
Point of Control (POC) → 3,350.55
Value Area Low (VAL) → 3,346.80
This is your MM battlefield. They’ll fake the top or bottom.
3. VOLUME & DELTA INTELLIGENCE
Massive volume trapped near 3,350 — over 1.18M contracts, likely MM liquidity build.
Bullish delta spike without breakout = distribution confirmed.
Negative divergence on volume as price inches up = fading buyer pressure.
4. TREND STRUCTURE
Macro: Corrective rally inside a bear cycle.
Micro: Sideways drift with upward fakeouts.
This is distribution phase, not accumulation.
5. VWAP + VWAP Golden Zone
Daily VWAP: 3,350.00
Golden Zone VWAP: 3,352.20
Price is hugging this zone without commitment.
Classic Schabacker “congestion before collapse” setup.
6. MOMENTUM SNAPSHOT
RSI divergence + failing upward thrusts = buyers can’t push this shit higher.
Bears are slowly reloading near VWAP.
7. SUPPORT/RESISTANCE LEVELS
🔺 Resistance: 3,352.20 → VAH + VWAP + trap zone
🔻 Support: 3,346.80 → VAL + last buyer response
🔻 Hidden Bear Target: 3,343.00 → fair value rejection + unfinished auction zone
8. LIQUIDITY TRAPS / MM BAIT ZONES
Liquidity stack above 3,352.20 → bait to trap longs
Liquidity pockets at 3,344.80 – 3,346.00 → possible trap for late shorts
Market Makers will stab both sides before choosing a direction.
9. MARKET MAKER PSYCHOLOGY (Schabacker Style)
MMs:
Built liquidity around POC.
Faked breakout at VAH.
Absorbed breakout buyers, preparing to flush price down.
This is textbook “Congestion before Reversal” — Schabacker style.
Watch for the Kill Candle during 10:15–11:00 Cairo time.
⚖️ HEDGE PLAN (LONG & SHORT SETUPS)
🟢 LONG HEDGE SETUP (LOWER PROBABILITY)
Entry: 3,353.00 (Break above VAH + Hold)
Stop: 3,349.00
TP: 3,357.50
Probability: 35%
Justification: Only viable if VWAP breaks & holds with volume. Otherwise, it’s a trap.
🔴 SHORT SETUP (HIGHER PROBABILITY TRADE)
Entry: 3,348.80
Stop: 3,353.20
TP: 3,343.00
Probability: 85%
Justification: VWAP trap + absorption + bearish delta + exhaustion = imminent drop.
🎯 JEWEL TRADE OF THE DAY (CONFIRMED SETUP)
🔥 Sell Stop Order Below VAL Trap Zone
Type Entry Stop Loss Take Profit Confidence
🔴 Sell Stop 3,348.80 3,353.20 3,343.00 85%
Timing: Golden Hour (10:15 – 11:30 Cairo Time)
Watch for MM trap at VWAP → kill candle confirms.
💣 CONTINGENCY PLAN FOR STOP HUNTS
✅ Where Will MM Try to Stop-Hunt?
Above 3,352.20 = bull trap zone
Below 3,346.00 = bear trap zone
🧨 How to Exploit It?
If price wicks below 3,346.00 then rebounds with delta spike:
➕ Buy Stop @ 3,348.20
SL: 3,345.50
TP: 3,352.00
Classic Schabacker reversal from congestion low.

XAUUSD – Sellers Take ControlGold prices are currently consolidating within a tight price box around 3,350 – 3,360 USD , positioned just below the descending resistance line of a contracting triangle pattern. Multiple attempts to break above 3,360 USD have failed, indicating weak buying pressure and building selling momentum . The current structure suggests the market is setting up for a potential downside breakout.
On the news front, U.S. PPI is forecast to rise 0.2% compared to the previous 0.0% , while jobless claims are expected to drop from 226K to 225K . These figures reflect persistent producer inflation and a strong labor market, reinforcing the Fed’s hawkish stance. A stronger USD in this context typically exerts downward pressure on gold, as the metal becomes more expensive for investors holding other currencies.
If the price breaks below 3,340 USD, the decline could quickly extend toward 3,310 USD – a key support level . In this scenario, any pullbacks to the 3,355 – 3,360 USD zone may present opportunities for sellers to increase positions, while buyers should remain cautious as the short-term trend continues to favor the downside.


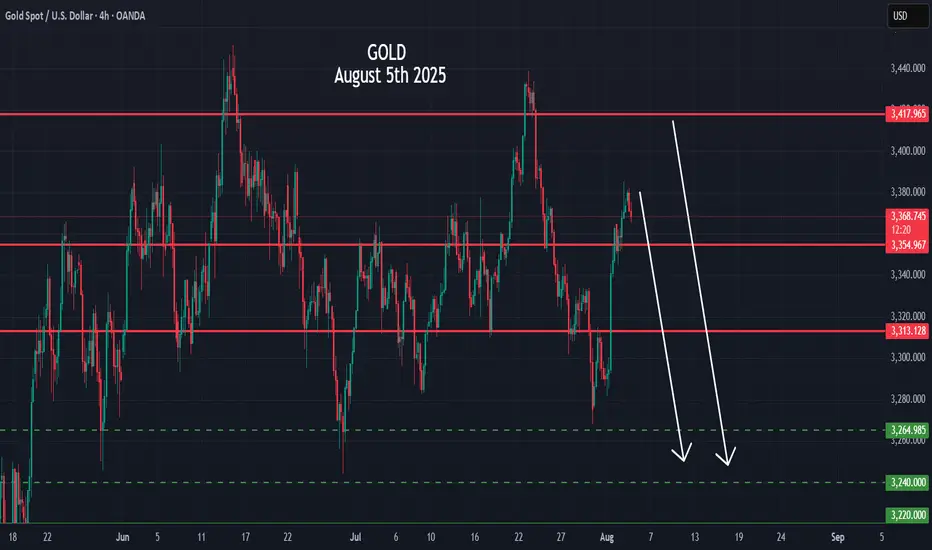
Crystal Ball Forecast for Gold (XAUUSD)🔮 Crystal Ball Forecast for Gold (XAUUSD)
Current Price: 3372
Medium-Term Direction: 🔻 DOWN
✅ My Forecast: GOLD WILL GO DOWN from 3372
🔍 Why? (Technical Reasons Supporting Bearish Outlook)
1. Gann Price Vibration (From recent high ~3385)
3372 = 45° level – key resistance level
Price rejected at 3375–3385 zone multiple times
If 3375 holds as resistance, next vibration levels:
3335 (Gann 45° down)
3284 (Gann 90° down)
3250 (Gann 120° down)
2. Elliott Wave
Looks like Wave 5 (ending diagonal) completed at 3385
Current price at 3372 = classic "after top" trap zone
Next structure likely forming ABC correction or new bearish impulse
Projection:
Wave A → 3335
Wave C → 3280–3250
3. Price Action + Candle Behavior
Strong upper wicks around 3375–3380
Lower highs forming = distribution pattern
MACD & RSI divergence visible on 4H/1D
📉 Medium-Term Bearish Targets
Target Price Reason
3335 Gann 45° down, Wave A low
3284 Gann 90° down, Wave C
3250 Gann 120°, Cycle
3183 Gann 180°, major support
📌 Summary Forecast
✳️ Gold is topping out.
✳️ Bearish move toward 3280–3250 is highly likely.
✳️ Best entry = on rejection from 3375–3380 zone
✳️ Stop = above 3390
✳️ Hold short for 2–3 weeks or until target reached
XAUUSD H4 | Bullish bounce off 50% Fib supportThe Gold (XAU/USD) has bounced off the buy entry at 3,332.63, which is an overlap support that aligns with the 61.8% Fibonacci retracement and could potentially bounce from this level to the take profit.
Stop loss is at 3,306.53, which is a pullback support that lines up with the 78.6% Fibonacci retracement.
Take profit is at 3,400.62, whihc is a swing high resistance.
High Risk Investment Warning
Trading Forex/CFDs on margin carries a high level of risk and may not be suitable for all investors. Leverage can work against you.
Stratos Markets Limited (tradu.com ):
CFDs are complex instruments and come with a high risk of losing money rapidly due to leverage. 65% of retail investor accounts lose money when trading CFDs with this provider. You should consider whether you understand how CFDs work and whether you can afford to take the high risk of losing your money.
Stratos Europe Ltd (tradu.com ):
CFDs are complex instruments and come with a high risk of losing money rapidly due to leverage. 66% of retail investor accounts lose money when trading CFDs with this provider. You should consider whether you understand how CFDs work and whether you can afford to take the high risk of losing your money.
Stratos Global LLC (tradu.com ):
Losses can exceed deposits.
Please be advised that the information presented on TradingView is provided to Tradu (‘Company’, ‘we’) by a third-party provider (‘TFA Global Pte Ltd’). Please be reminded that you are solely responsible for the trading decisions on your account. There is a very high degree of risk involved in trading. Any information and/or content is intended entirely for research, educational and informational purposes only and does not constitute investment or consultation advice or investment strategy. The information is not tailored to the investment needs of any specific person and therefore does not involve a consideration of any of the investment objectives, financial situation or needs of any viewer that may receive it. Kindly also note that past performance is not a reliable indicator of future results. Actual results may differ materially from those anticipated in forward-looking or past performance statements. We assume no liability as to the accuracy or completeness of any of the information and/or content provided herein and the Company cannot be held responsible for any omission, mistake nor for any loss or damage including without limitation to any loss of profit which may arise from reliance on any information supplied by TFA Global Pte Ltd.
The speaker(s) is neither an employee, agent nor representative of Tradu and is therefore acting independently. The opinions given are their own, constitute general market commentary, and do not constitute the opinion or advice of Tradu or any form of personal or investment advice. Tradu neither endorses nor guarantees offerings of third-party speakers, nor is Tradu responsible for the content, veracity or opinions of third-party speakers, presenters or participants.

GOLD ROUTE MAP UPDATEHey Everyone,
Once again our chart idea is playing out in true level to level fashion.
We started with our bearish gap hit at 3377, followed with ema5 cross and lock opening 3354, which was also hit perfectly.
We are now seeing price play in the retracement range with 3329 also open for test. We expect reaction on this retracement zone, also keeping in mind the Bullish gap above, inline with our plans to buy dips.
We will keep the above in mind when taking buys from dips. Our updated levels and weighted levels will allow us to track the movement down and then catch bounces up.
We will continue to buy dips using our support levels taking 20 to 40 pips. As stated before each of our level structures give 20 to 40 pip bounces, which is enough for a nice entry and exit. If you back test the levels we shared every week for the past 24 months, you can see how effectively they were used to trade with or against short/mid term swings and trends.
The swing range give bigger bounces then our weighted levels that's the difference between weighted levels and swing ranges.
BULLISH TARGET
3403
EMA5 CROSS AND LOCK ABOVE 3403 WILL OPEN THE FOLLOWING BULLISH TARGETS
3422
EMA5 CROSS AND LOCK ABOVE 3422 WILL OPEN THE FOLLOWING BULLISH TARGET
3439
BEARISH TARGETS
3377 - DONE
EMA5 CROSS AND LOCK BELOW 3377 WILL OPEN THE FOLLOWING BEARISH TARGET
3354 - DONE
EMA5 CROSS AND LOCK BELOW 3354 WILL OPEN THE FOLLOWING BEARISH TARGET
3329
EMA5 CROSS AND LOCK BELOW 3329 WILL OPEN THE SWING RANGE
3304
3281
As always, we will keep you all updated with regular updates throughout the week and how we manage the active ideas and setups. Thank you all for your likes, comments and follows, we really appreciate it!
Mr Gold
GoldViewFX

Gold Finding Next Demand ZoneGold is always an uptrend currency. It has been uptrend for years. Now it's time to pullback. It is finding demand zone to react. 3300 area is a valid zone.

ABC Correction Setup: Watching 3329 Support for Bounce Toward 33🟦 Possible ABC Move Setting Up
I’m watching a potential ABC correction play out here:
A (3352 area): Small bounce into local resistance.
B (3329 zone): Pullback into demand/support where buyers have stepped in before.
C (3374 target): If support holds, next leg up could push into the supply zone above.
Simple structure: bounce → dip → rally. Key invalidation is if price breaks down under 3329 support.
⚠️ Disclaimer:
This is just my personal market view, not financial advice. Always do your own research and manage risk before trading.

XAUUSD: Buy ideaOn XAUUSD as you can see on the chart we would have a hight probability to have an uptrend if and only if of we have the breakout with force the resistance line by a big green candle.

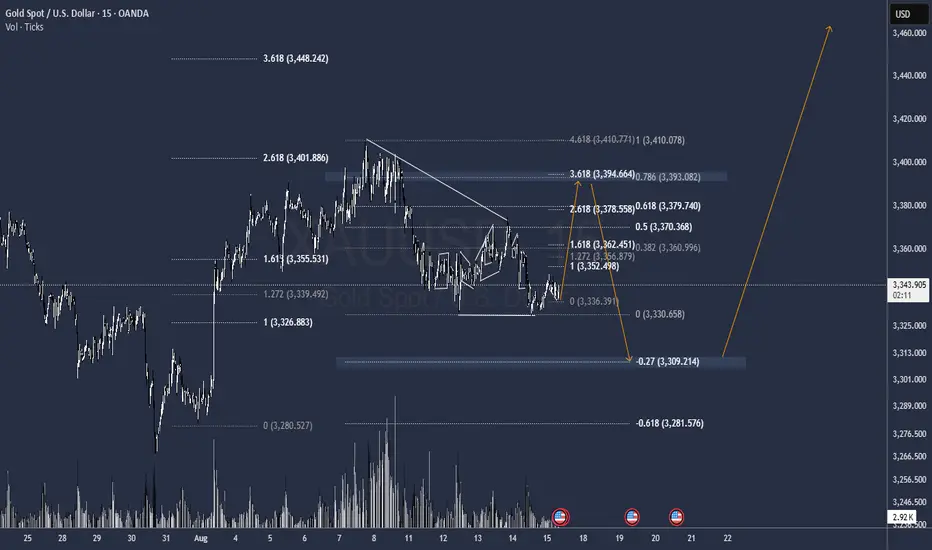
GOlD to 3394As it has broken the last low, it can go back to to 3310 after tapping 3394, but it is not needed, it can also keep crawling to 3450 and further
right now its a Clear Flag to buy it at least to 3394
gg
XAUUSD GOLD SHORT IDEAGOLD WILL BE SHORT
UKREAIN DEAL AND ITS MASSIVE IMPACT ON GOLD
Ukraine peace talks reduce gold demand, while stability makes dollar stronger.


XAUUSD Bullish Continuation Setup? Gold (XAU/USD) – 1H Technical Outlook
Price action on the hourly chart is developing within a well-defined ascending channel, supported by dynamic trendlines that have consistently provided higher highs (HH) and higher lows (HL), confirming the underlying bullish structure.
The Key Support and Resistance Zone around 3,330–3,350 USD has proven to be a pivotal area, acting as both a consolidation base and a springboard for bullish impulses. The most recent Multi-Confluence Support and Pivot Area aligns with dynamic channel support, reinforcing its technical significance.
Volume Profile (Flow Profile) data remains overall bearish, indicating that a majority of trading activity has occurred at lower levels. However, the profile is beginning to exhibit early signs of accumulation, which often precedes directional reversals in market sentiment.
From a structural perspective, maintaining price action above the 3,328–3,350 USD support range would sustain the bullish bias, with upside potential toward Channel High Resistance near 3,400 USD, and an extended target into the Target Area around 3,420 USD.
Conversely, a decisive break below the Invalidation Zone (~3,310 USD) would undermine the bullish channel structure, increasing the probability of a deeper retracement.
Outlook:
Bias: Bullish continuation, contingent on support holding.
Key Support: 3,328–3,350 USD
Immediate Resistance: ~3,400 USD
Primary Target: ~3,420 USD
Invalidation Level: ~3,310 USD
This setup suggests that, while buyers retain structural control, confirmation from price action and volume behavior will be critical in validating the next bullish leg.
