Daily live trade with XAUUSD in 15m/30m/1h 20250814Daily live trade with XAUUSD in 15m/30m/1h 20250814
XAUUSD trade ideas

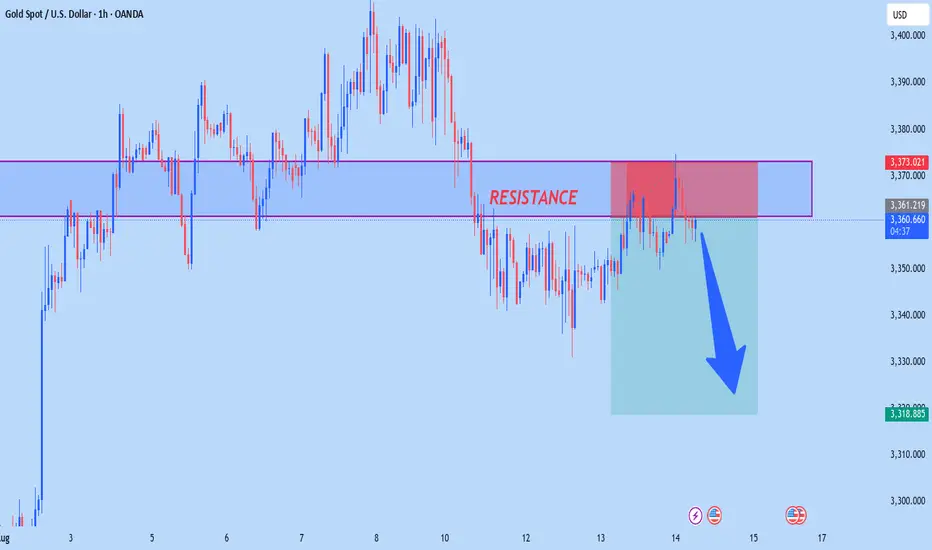
Gold Near Breakout – Watch $3,369 and $3,330Gold remains in a downtrend, forming a Bear Flag pattern within a broader descending channel. Price is capped below key resistance at $3,360–3,369 and is hovering near $3,340. A breakdown below $3,330 could accelerate losses toward $3,300 and $3,280, while a short-term bullish break above $3,369 may trigger a retracement toward $3,380 before sellers likely re-enter. Overall bias stays bearish unless price closes firmly above the upper resistance zone.
🔑 Key Levels to Watch
- Resistance: $3,360 → $3,369 → $3,380
- Support: $3,330 → $3,300 → $3,280
- Breakout Zones: Below $3,330 → Targets $3,300 and $3,280. Above $3,369 → Target $3,380
Note
Please risk management in trading is a Key so use your money accordingly. If you like the idea then please like and boost. Thank you and Good Luck!

Gold (xauusd): still bullishHello guys!
Price is moving inside an ascending channel.
Recently bounced from mid-channel support (“last kiss”) and heading toward channel resistance.
Potential upside target: $3,435 zone.
As long as the price stays above mid-line support, bullish momentum remains intact.

XAUUSDThe bull market seems to be on the verge of another attack next week. The bottom may have formed a double bottom structure.

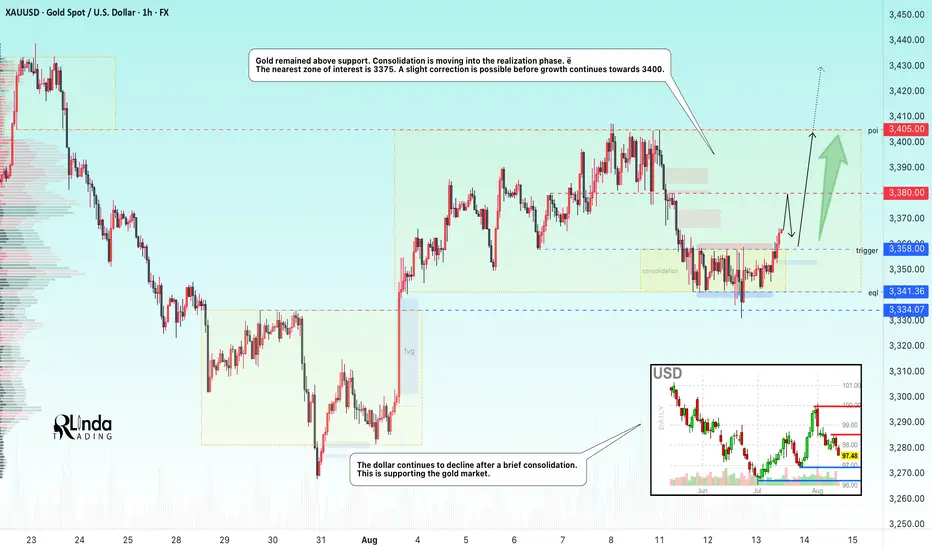
GOLD → From consolidation to distribution. Target 3400FX:XAUUSD is entering a distribution phase after the end of consolidation. The market is strong, bulls managed to keep prices from falling and formed an intermediate bottom in the 3340 zone.
The price increase was supported by expectations of a soft Fed policy after moderate July CPI data (2.7% y/y, 0.2% m/m, core 0.3%), which led to a decline in bond yields and a weakening of the dollar. However, demand for safe assets is declining amid optimism in global markets, fueled by the US-China trade truce, a possible meeting between Trump and Putin, and bets on a Fed rate cut in September. In the long term, gold could be supported by purchases by the Chinese central bank and a recovery in jewelry demand in India.
Technically, the focus is on the zone of interest ahead at 3370-3373, with a possible rebound before growth, as well as on the support zone at 3359. I do not rule out that the market may test the liquidity zone...
Resistance levels: 3370, 3380, 3400
Support levels: 3358, 3341, 3334
There is considerable potential within the consolidation, and the rally may be directed towards the resistance range of 3400. However, pullbacks are possible before growth, which could give us a good entry point.
Best regards, R. Linda!
Gold - M30 Buy SetupOANDA:XAUUSD TVC:GOLD
Timeframe: m30
Risk Level: Low-Medium
🔹 Setup:
Price is testing the boundary of the ascending channel and retesting the support @ 3350
📈 Entry:
Current price zone: 3360-65
🎯 Targets (TP):
TP1: 3375
TP2: 3385
TP4: 3410
TP6: 3430
⛔ Stop Loss (SL):
3349
H4 Overview:
PEPPERSTONE:XAUUSD
#XAUUSD #GOLD #Buy #Signal #MJTrading
Psychology Always Matters:

XAU/USD Technical Outlook for the upcoming week In this video I look at the current PA of gold using TPO chart and correlate a plan for where we could see price go in the coming week .
I use a regular chart and TPO chart for this analysis as well as Fibonacci tools .
We are currently in the middle of a range and until that range is broken we plan ahead and seek the best high probability setup via looking at the charts and correlating with the News catalysts.

symmetrical triangle pattern of XAUUSDsymmetrical triangle pattern of XAUUSD. Gold is consolidating in narrow zone.

GOLDThere is tow strong demand zone if the market come down first then I will buy and when it goes up i gonna sell, but if it come first upside I just execute one sell trade .I find tow strong demand and the flow is bearish so i like to go down

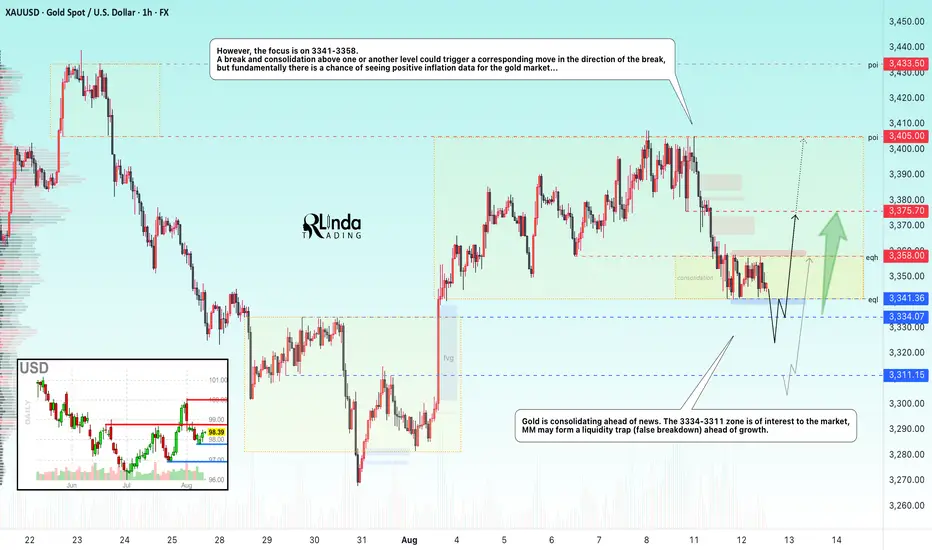
GOLD → Consolidation ahead of CPI data...FX:XAUUSD is consolidating ahead of news. Inflation is on the horizon, and further developments for the dollar and gold will depend on the data. Globally, gold is in a bullish trend, but locally we are seeing a correction...
Gold is rebounding slightly from $3,341 ahead of US CPI data for July and against the backdrop of the extension of the US-China trade truce until November. Investors are assessing the prospects for a Fed rate cut, expecting inflation to remain within 2.8% (core inflation is 3%). Weaker-than-expected data could cause the dollar to fall and support gold, while stronger data could resume the downward trend.
Technically, on D1-H4, gold is consolidating in a symmetrical triangle pattern and the price is in the support zone. There is a possibility that Trump may not make a mistake with inflation data, as he did with employment data...
Support levels: 3341, 3334, 3311
Resistance levels: 3358, 3375, 3405
The 3335-3310 zone attracts MM with an open FVG, which the market may partially close, forming a liquidity trap before continuing growth. However, it is also worth watching the boundaries of the current local consolidation, as a breakout of one or the other boundary could trigger a strong impulse.
Best regards, R. Linda!
Gold (XAU/USD) Technical Analysis – August 11, 2025📊 Gold (XAU/USD) Technical Analysis – August 11, 2025
As anticipated in my previous analysis, gold dropped precisely from the midline of the channel and the descending trendline, showing a strong bearish rejection. Currently, the price is hovering near the $3,338 support.
🔹 Bullish Scenario:
If this support holds and we see strong bullish confirmation candles, gold could start a rebound. The first upside target is $3,359, followed by $3,370 and $3,375, which aligns with the broken ascending pink trendline, suggesting a potential pullback retest. If this level is broken, the next target will be the descending blue trendline.
🔹 Bearish Scenario:
If the $3,338 support breaks, the next key level to watch is $3,332, followed by $3,312 and finally the channel bottom support.
📌 Summary:
Gold is now at a critical decision point. Watch for confirmation signals at $3,338 to determine whether we get a bullish pullback or further downside movement.

Spot Gold (USCGC) – NY Session Outlook – 11th Aug 2025🕒 Top-Down Technical Analysis
1️⃣ Daily Chart (Macro Perspective)
Price action has turned decisively bearish after last week’s rejection from the 3,391–3,404 supply zone.
Friday’s large bearish daily candle not only engulfed multiple prior sessions but also shifted market structure, confirming a short-term downside bias.
Current daily VWAP and key moving averages are sloping downward, signalling sellers still hold momentum.
Immediate macro target sits around the 3,320–3,325 demand area, which coincides with a prior accumulation zone from early August.
2️⃣ H4 Chart (Swing Structure)
The H4 trend structure shows a clean breakdown from the 3,390s, with lower highs and lower lows forming in sequence.
The most recent pullback failed to reclaim VWAP or break prior swing highs, suggesting sellers defended the move effectively.
Below current levels, liquidity is resting around 3,342, and a decisive break there could open the door to the mid–3,320s.
Any upside retracement into supply is considered corrective until proven otherwise by structure shift.
3️⃣ M15 Chart (Intraday Context)
New York opened with price trading near intraday lows after London extended the bearish move.
A pocket of unmitigated supply sits between 3,375–3,385, overlapping with:
Prior London high
Short-term imbalance (FVG)
AOI marked from earlier session price action
This zone is the highest-probability area for a rejection if price retraces.
MACD remains in bearish territory, RSI is recovering from oversold but not yet breaking above midline — suggesting any bounce is likely corrective.
⚠️ Key Intraday Levels
AOI Supply: 3,375–3,385 (watch for rejection)
Daily Resistance: 3,391.6 (invalidates bearish bias if broken)
Intraday Sell-Side Liquidity: 3,342.4
Demand Target: 3,325–3,320
📌 Probable Scenario
Base Case (Primary Expectation):
Price retraces into AOI supply during early/mid NY session.
Sellers step in, defending the zone and producing a shift in intraday structure.
Price rotates back toward the session low at 3,342.
A clean break of 3,342 exposes the 3,325–3,320 demand zone as the next liquidity target.
Alternate Case (Low Probability):
If price breaks and holds above 3,385, then 3,391.6 becomes the next upside magnet. A break of that level would shift short-term sentiment back to neutral.
💡 Final Notes
This remains a sell-the-rally environment while price is capped under AOI supply.
Patience is key — waiting for price to enter the optimal zone and confirm rejection offers the best risk-to-reward setup.
Disclaimer: This is my personal market view based on technical analysis and session flows. This is not financial advice — always manage risk accordingly.

Gold 4h | BearishGold has been trading within a bearish parallel channel on the 4H timeframe, respecting both upper and lower trendlines with clear momentum to the downside. Price structure continues to form lower highs (LH) and lower lows (LL), confirming the prevailing bearish trend.
🔎 Key Observations:
Bearish Market Structure – The sequence of lower highs and lower lows indicates sellers are firmly in control. Each rally attempt has been capped below previous highs, showing strong supply pressure.
Parallel Channel – Price action is respecting the channel boundaries. Recent rejections from the upper trendline reinforce the bearish outlook.
Psychological Level – 3300 – The 3300 zone stands out as a major psychological level and a potential magnet for price. It also aligns with historical demand, making it a critical support to watch.
Momentum – Current candles show strong bearish bodies with weak rejections, highlighting continued downside pressure.
📉 Bearish Outlook:
If sellers maintain control, Gold is likely to extend the move down towards the 3300 demand zone. A clean break below this level could open the door for deeper corrections.
📊 Possible Scenarios:
Base Case (Bearish Continuation): Price respects the channel and continues lower toward 3300.
Alternative Scenario (Temporary Pullback): A minor retracement to retest 3345–3355 resistance before continuing lower.
⚠️ Risk Management:
Watch for bullish reversal signals around 3300, as this level may attract strong buyers.
A breakout above 3370 would weaken the bearish bias and suggest short-term strength.
✅ Summary:
Gold remains bearish on the 4H chart, with sellers driving momentum toward the 3300 psychological level. Unless bulls step in aggressively, the downside remains the path of least resistance.

"XAUUSD – Symmetrical Triangle Breakout with Bullish Momentum""On the 4H chart, XAUUSD has completed a breakout from a well-defined symmetrical triangle pattern. The breakout was supported by a series of higher lows forming along the ascending trendline and a clean break above the upper resistance trendline.
Price is currently consolidating above the breakout level, indicating that buyers are holding ground. The next significant resistance zone is between 3,410–3,420, which aligns with the previous swing highs and the supply zone highlighted on the chart.
Key levels to watch:
Breakout zone / support: 3,330–3,340
Immediate resistance / target zone: 3,410–3,420
Demand zone: 3,280–3,300 (possible retest area if price pulls back)
A sustained close above the breakout zone could open the way for a push toward the target area. Traders should also keep an eye on volume and market sentiment for confirmation of the move.
This analysis is for educational purposes only and not financial advice."

GOLD → Consolidation ahead of potential growth. PPI ahead...FX:XAUUSD is still consolidating, with the range expanding. The price has confirmed the formation of an upward price channel, which bulls are defending quite aggressively...
Gold remains in positive territory for the third day in a row and is consolidating above $3,350 in Asian trading, awaiting PPI data and jobless claims in the US. Moderate CPI and weak labor market statistics have reinforced expectations of a Fed rate cut in September, with some experts forecasting -50 bps. The dollar remains at a two-week low amid dovish comments and rumors of a possible change in the Fed chair, which supports demand for gold. Weak PPI data could accelerate the rise in metal prices, although market attention is gradually shifting to the meeting between Trump and Putin on Ukraine.
Technically, the focus is on the 3366-3340 range. A small correction may form from resistance before breaking the 3366 level and continuing to rise within the trend...
Resistance levels: 3366, 3381, 3400
Support levels: 3341, 3334
Before rising, the market may test the trend support or form a false breakdown. But there is a possibility that the price will immediately start storming 3366 for further growth. But, again, further developments depend on economic data, which will most likely be controlled by Trump after the NFP mistake...
Best regards, R. Linda!

GOLD Melted , Clear Chance To Buy It Now , 150 Pips Waiting !Here is My 15 Mins Gold Chart , and here is my opinion , the price go down very hard after touch 3400.00 and melted to 3353.00 and we finally above 3358.00 and we have a 30 Mins Candle closure above it And Perfect Breakout and perfect bullish price action , so we have a good confirmation now to can buy it and we can targeting 100 to 200 pips as a small correction after this huge movement to downside in a very short period , so i will buy it to see if we have a correction for 150 to 200 pips at least .
Reasons To Enter :
1- New Support Created .
2- Bullish Price Action .
3- Bigger T.F Giving Good Bullish P.A .
4- 30 Mins Confirmation
5- Little Correction .

Gold Technical & Fundamental Update | August 11–15, 2025XAUUSD closed last week near $3,400 after breaking above the resistance of the descending channel. Price action has been choppy, hinting at cautious buying ahead of major U.S. events this week, CPI, PPI, Retail Sales, and Fed commentary.
Key levels:
✅$3,380: Above = bullish bias continues; Below = look for selling setups
✅Support: Former channel resistance now acting as a retest zone
✅Trend guide: Ascending trendlines from the early August recovery
Watch how gold reacts to $3,380 early in the week. This will set the tone for either continuation toward recent highs or a deeper pullback.
#gold #xauusd #forex #technicalanalysis #marketupdate #tradingvie
I’ll update my thoughts in the comments as price action unfolds.
Disclaimer:
Based on experience and what I see on the charts, this is my take. It’s not financial advice—always do your research and consult a licensed advisor before trading.

gold faces downtrend sell possible?hello everyone what about thoughts on current trend xauusd?
my target 3310 sell zone today
take profit 3310
stoploss 3360
entryzone now 3342
like my ideas commant

Gold Weekly Summary and Forecast 8/17/2025Gold did fall from 3400 as predicted last week. In 2W TF, it also formed a bearish bar. The bearish structure is still valid and gold should be on its way to 3k.
On the other hand, in 1W TF, I have also identified the triangle structure. Normally this structure can be either way. It can be a continuation signal or trend reversal, which depends on which line is broken.
Therefore, it is crucial to see how next week's bar will be closed. If it closes under the support line, the bearish trend will be confirmed.
For next week's trading strategy, I am expecting the price to at least touch the support line, which is around 3295.

Gold Analysis (XAU/USD)Gold has broken above the $3,355 resistance level today, moving in an upward trend and is currently trading near $3,365.
🔹 Bullish Scenario:
The uptrend is likely to continue toward the $3,375 zone, which is considered a potential reversal area.
🔹 Bearish Scenario:
However, if the price reverses downward and breaks below $3,355 with confirmation, it could shift the movement back to a bearish trend, potentially opening the way toward $3,330 again.

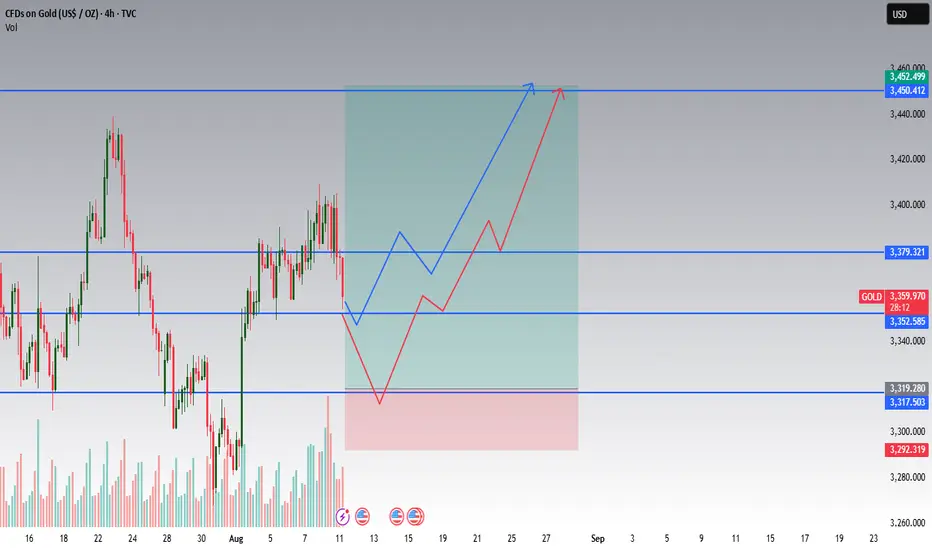
GOLD 4H — CPI day. Keeping it simple.
I’m leaning bullish into CPI. If the number comes in hotter, gold usually gets an “inflation hedge” bid. No indicators, just clean levels from the chart.
Levels I care about
3450–3460: big target/resistance
3379: pivot — above it, buyers in control
3353: minor support
3317: demand / last higher low
3292: hard invalidation
How I’ll trade it
Plan A (shallow dip): If after the print price reclaims 3379 and holds on 15–30m, I’ll look long.
Stop: ~3351
Targets: 3450 first, then 3460 if momentum sticks.
Plan B (deeper sweep): If CPI first flushes into 3317 ±10 and we see a sharp rejection + higher low on LTF, I’ll buy the bounce.
Stop: ~3290 (below invalidation)
Targets: 3379, then 3450–3460.
If I’m wrong
A clean 4H close below 3292 = I’m out and waiting.
Notes
If CPI is softer than expected, USD/yields can pop and this long idea likely fails. I’ll wait 5–15 minutes after the release before committing and keep size modest.
XAUUSD – Bears Eye 3316 as 200 MA CracksOn the 1H chart, Gold (XAUUSD) just confirmed a break below the 200 EMA, signaling a potential momentum shift in favor of sellers. Price previously retraced into the Fair Value Gap (FVG) and failed to sustain above, which adds to the bearish sentiment.
With the rejection from the FVG and fib-based projections, my expectation is for price to push down towards the 1.618 Fib extension at 3316.50. If bearish momentum remains strong, further downside levels could be in sight at 3299 (Fib 2.0) and 3281 (Fib 2.272).
📉 Bias – Bearish
📍 Key Resistance – FVG zone
🎯 Target Levels – 3316.50 → 3299 → 3281

XAUUSD NEW OUTLOOKAccording to H1 analysis Gold market is runnung betwen 3370 to 3355
now market will break support zong of 3355 and it will be falling to 3330
wait for good opportunity dont be greedy
TRADE AT YOUR OWN RISK