XAUUSD – Bulls Fighting BackAs expected and explained in Friday’s analysis, Gold dipped under 3335, and during today's Asian session, opened with a slide to 3323.
However, shortly after, bulls stepped in, and in the following 5 hours the price climbed strongly, reaching the important resistance at 3360, before entering a normal correction.
At this moment, the correction from 3410 could be complete, and a confirmed break above 3360 would bring the first confirmation for a new bullish leg.
Another factor supporting this view is that the resistance of the falling wedge has already been broken to the upside – a constructive technical signal.
📌 Trading Plan:
I will look to buy dips, anticipating a break above 3360, with targets toward the 3400 handle.
⚠️ A new local low would temporarily pause this bullish scenario.🚀
Disclosure: I am part of TradeNation's Influencer program and receive a monthly fee for using their TradingView charts in my analyses and educational articles.
XAUUSD trade ideas

Lingrid | GOLD Weekly Market Analysis: Triangle Breakout AttemptThe price perfectly fulfilled my previous weekly outlook . OANDA:XAUUSD has closed around $3,371 as the market approaches a critical juncture within a well-defined triangle consolidation pattern. The recent price action suggests accumulation near key support levels with potential for a decisive directional move ahead.
Current timeframe reveals gold forming a classic triangle pattern over month, with the apex narrowing as volatility contracts. The $3,310 level has emerged as crucial support, representing a higher low formation that maintains the bullish structure. Above, the resistance zone around $3,440 continues to cap upside attempts, creating the horizontal ceiling of the triangle.
The daily timeframe shows fake break at both resistance and support levels, indicating institutional players are testing liquidity before committing to larger positions. The current positioning near $3,350 support suggests gold is building energy for the next significant move, with its apex where resolution typically occurs in explosive fashion.
A notable price projection annotation indicates potential future movement based on historical price action, suggesting the market may be preparing for a significant directional move. This technical forecast aligns with the triangle's measured move potential, highlighting the importance of the current consolidation phase as the pattern nears completion.
Next week key levels to monitor include the $3,350 support floor and the $3,410-$3,440 resistance ceiling. A clean break above $3,440 with volume would target the $3,500+ area, while failure at current support could see a retest of the $3,270 zone. The downward trendline from the July peak continues to act as dynamic resistance, requiring a sustained break to confirm bullish continuation. Triangle patterns often produce moves equal to their widest point, suggesting potential for significant volatility once resolution occurs.
If this idea resonates with you or you have your own opinion, traders, hit the comments. I’m excited to read your thoughts!

Gold sideways, unclear trend, needs more momentum✏️Gold has reacted at the Trendline and created another decline to Fibonacci 0.382. Buying power is still strong enough to pull H4 back above 3331. It is difficult to determine the next trend of Gold at the moment. Gold is sideways in a fairly narrow range and waiting for more momentum to confirm the trend. The areas of interest are still the Fibonacci zones that cross each hook to reach the next hook. Note that H4 closes below 3331 to confirm a bearish reversal to 3285.
📉 Key Levels
BUY trigger: Price breaks the trendline and Fibonacci at 3345.
BUY DCA: Breaks 3358 with candle confirmation
Target 3400
SELL trigger H4 closes below 3331
Target 3285
Leave your comments on the idea. I am happy to read your views.

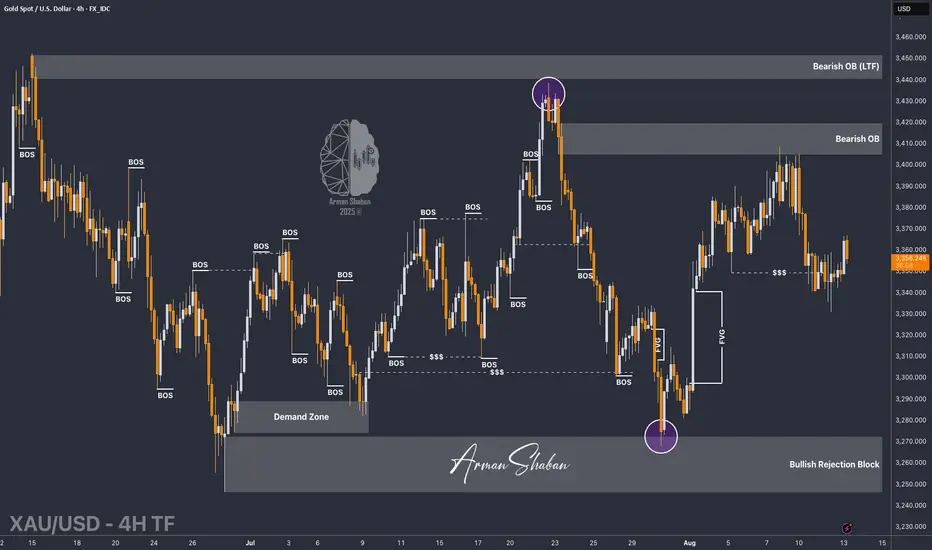
XAU/USD | Bull or Bear? Let's See! (READ THE CAPTION)By analyzing the #Gold chart on the 4-hour timeframe, we can see that after correcting down to the $3331 demand zone, price faced strong buying pressure and is now trading around $3357.
If gold manages to hold below $3367, we could expect a stronger drop, with downside targets at $3342, $3331, and $3323. This scenario will only fail if price holds above $3350, pushes past $3367, and closes above it — in that case, gold may rally back toward levels above $3390.
This analysis will be updated soon — don’t forget to show some support, friends!
Please support me with your likes and comments to motivate me to share more analysis with you and share your opinion about the possible trend of this chart with me !
Best Regards , Arman Shaban
GOLD (XAUUSD): Support & Resistance Analysis For Next Week
Here is my latest structure analysis for Gold.
Support 1: 3327 - 3334 area
Support 2: 3245 - 3276 area
Support 3: 3121 - 3177 area
Resistance 1: 3357 - 3374 area
Resistance 2: 3402 - 3409 area
Resistance 3: 3431 - 3452 area
Consider these structures for pullback/breakout trading.
❤️Please, support my work with like, thank you!❤️
I am part of Trade Nation's Influencer program and receive a monthly fee for using their TradingView charts in my analysis.

GOLD - false breakdown of support before bullish runGold on the chart is forming a bullish pattern: consolidation in the form of a bearish wedge forming on an uptrend. There is a high probability of a breakout from the support level of 3320-3310. The market has a lot of upside potential, as the price has been consolidating for a long time.
Below is a fairly strong support zone that is capable of holding the price.
However, there is one caveat: in a few hours, Powell's speech and unpredictable data could destroy the structure, in which case gold could fall to 3300-3328.

XAU/USD/ Bearish Trend Read The captionSMC Trading point update
Technical analysis of analysis Gold (XAU/USD), 2H timeframe:
Trend Context: Price is moving inside a descending channel, showing continued bearish pressure.
Key Resistance Zone: The yellow highlighted area around $3,340 – $3,347 is acting as a supply zone / resistance, aligned with the 200 EMA, reinforcing bearish bias.
Rejection Signals: Multiple rejections (red arrows) confirm sellers are defending this zone.
Bearish Setup: Price is expected to reject from resistance and continue lower within the channel.
Target Point: The projection suggests a decline towards $3,302, aligning with previous swing levels and channel support.
RSI: Currently mid-level (~51), showing no strong momentum shift yet, but still leaves room for downside pressure.
Mr SMC Trading point
Summary Idea:
Gold is respecting the bearish channel and supply zone. As long as price stays below $3,347, the setup favors a bearish continuation targeting $3,302.
Please support boost 🚀 this analysis)

XAU/USD: Trend Change After Breakout, Bearish ContinuationHello guys!
After a strong bullish run, Gold has shifted momentum with a clear breakout to the downside, confirming a change in trend. The S&P supply zone acted as a strong resistance, rejecting the price back into a descending channel.
Currently, price is respecting the channel structure and has failed to break above minor resistance. The short-term outlook points to a bearish continuation, with a likely move toward the 3,321.89 support.
A clean break below this level could open the way for a deeper push into the 3,314.44 demand zone.
📉 Bearish bias remains intact while trading below the supply zone.
📈 Bullish invalidation would require a breakout above the channel and the S&P zone.

XAU/USD | Gold Holding Demand Zone – Next Move Toward ResistanceGold (XAU/USD) on the 4H chart is consolidating within a sideways market structure. Price is currently holding inside the demand zone near 3,330 – 3,340, while the support level remains strong around 3,280.
Key observations:
Structure shows multiple BOS (Break of Structure) and ChoCH (Change of Character) confirmations.
Current demand zone is acting as short-term support.
A potential bullish bounce could send price back toward the resistance area around 3,400 – 3,440.
Failure to hold this zone may lead to a retest of 3,280 strong support.
As long as demand zone holds, buyers may look for a move toward the resistance area. However, if price breaks below the support level, sellers could take control.
This is not financial advice. For educational purposes only.

XAUUSD: Possible Bearish Point Of ViewGold in 4 Hours Time Frame has not moved significantly, currently we have not got ample volume to decide a clear trend. However, with the data that we have we can predict a possible ab=cd pattern where A to B is completed and we are yet to see c to d pattern.
If you like our work then please consider liking and commenting below.
Team Setupsfx

Gold Analysis – Slight Bearish Bias After Failing at 3350Yesterday I wrote that after the false break and the bullish daily engulfing, Gold could reverse to the upside and the correction that started from the 3400 zone might have been finished.
With this idea in mind, I went long, and the entry turned out to be a real sniper one as Gold started to rise strongly exactly after my entry, reaching once more the 3350 zone.
Here, however, price action turned “boiling” and, in the end, bulls couldn’t push through decisively.
After another attempt to conquer 3350 at the beginning of the Asian session, Gold failed again. During the night (my night), I decided to close my trade with +120 pips profit. It was not the outcome I expected, but still a positive one.
Looking back, this decision seems correct so far since price is now back around my entry level from yesterday.
________________________________________
Where Do We Go From Here?
So far, the week has no resolution. Neither bulls nor bears are in full control.
However, after the repeated failure to break 3350, my outlook leans slightly bearish at this moment.
• Plan: I will look to sell rallies during the day if I can find a good risk:reward setup.
• Target: 3280 is the bearish objective.
• Invalidation: If bulls finally manage to resolve the 3350 level, this outlook is negated.
________________________________________
Final Note:
Gold has become very unpredictable these days. What is true at the time of posting could change quickly during the session. That’s why I update my analyses during the day.
👉 If you want to be notified of these updates, don’t forget to like this idea.
💬 And if you have questions, feel free to use the comment section — I will try to respond to all.
🚀
Disclosure: I am part of TradeNation's Influencer program and receive a monthly fee for using their TradingView charts in my analyses and educational articles.

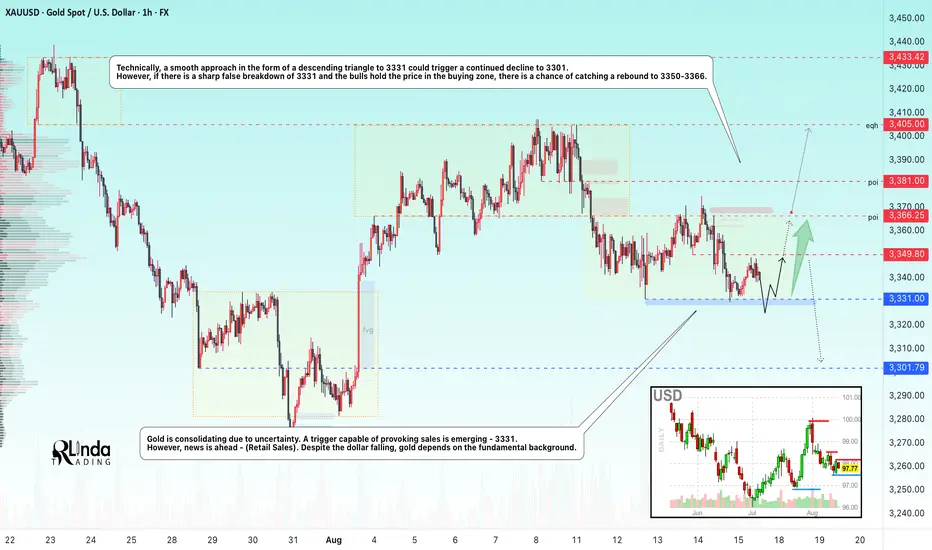
GOLD → Gold is consolidating. What will C.Retail Sales show?FX:XAUUSD is consolidating due to uncertainty caused by economic data from the US, interest rate decisions, and negotiations between the presidents of Russia and the US.
Gold has not had an easy time lately, with the price in a rather difficult zone both technically and fundamentally. Low-potential, restrained movements occurring within the consolidation are waiting for a strong driver to appear. Potentially, this could happen today, as we have retail sales data ahead of us, as well as a fairly important event - a meeting and negotiations between the presidents of Russia and the US.
Technically, the focus is on the boundaries of the current consolidation: 3331 - 3349 - 3366. Thursday's weak close (close to the trigger) hints at a possible attempt to break through 3331 with the aim of falling to 3300. However, a sharp approach and seizure of liquidity from 3331 could provoke a rebound to local resistance (3350 - 3366).
Support levels: 3331, 3300.
Resistance levels: 3350, 3366.
Markets are waiting for hints on interest rates. Weaker data on Core Retail Sales and Retail Sales could bring us closer to a reduction in interest rates, against which backdrop gold could strengthen. And vice versa, respectively...
Best regards, R. Linda!
GOLD: High-Risk Setup Ahead of Jackson HoleGOLD: High-Risk Setup Ahead of Jackson Hole
Gold is currently in a tricky spot. While the price action looks messy, I believe the bearish trend could continue soon.
Over the past few days, gold has been forming a larger corrective pattern — mostly bearish, but not very clear.
The market is now watching the Federal Reserve’s Jackson Hole event closely, especially Fed Chair Powell’s speech, for clues on future interest rate moves.
From current levels, gold might rise again to retest the red zone near 3350. But there's also a risk it could drop sharply, trapping long positions from this week’s false breakout.
I’m waiting more for a bearish move, though a final push higher could happen before the drop resumes.
Overall, trading gold right now is very risky.
You may find more details in the chart!
Thank you and Good Luck!
PS: Please support with a like or comment if you find this analysis useful for your trading day

Is Gold Losing Its Luster or Preparing to Shine Again?XAUUSD has been respecting a broad ascending channel for months, with clear touches on both resistance and support levels. Recently, however, price slipped into a smaller bearish channel inside the larger structure.
📉 The short-term bias remains bearish as long as price trades within the red channel.
📊 Key support lies near the $3,280 zone — a critical level where bulls might attempt to step in.
💡 A breakout from the bearish channel could open the way for another retest of the upper resistance zone, while failure to hold support may trigger deeper corrections.
📚 Always follow your trading plan regarding entry, risk management, and trade management.
Good luck!
All Strategies Are Good; If Managed Properly!
~Rich
Disclosure: I am part of Trade Nation's Influencer program and receive a monthly fee for using their TradingView charts in my analysis.

GOLD - BEARISH MOVE!Hello Traders!
The Gold failed to create a new higher high!
The price broke the higher low (change of character).
So, I expect a bearish move📉
_____________
TARGET: 3300🎯

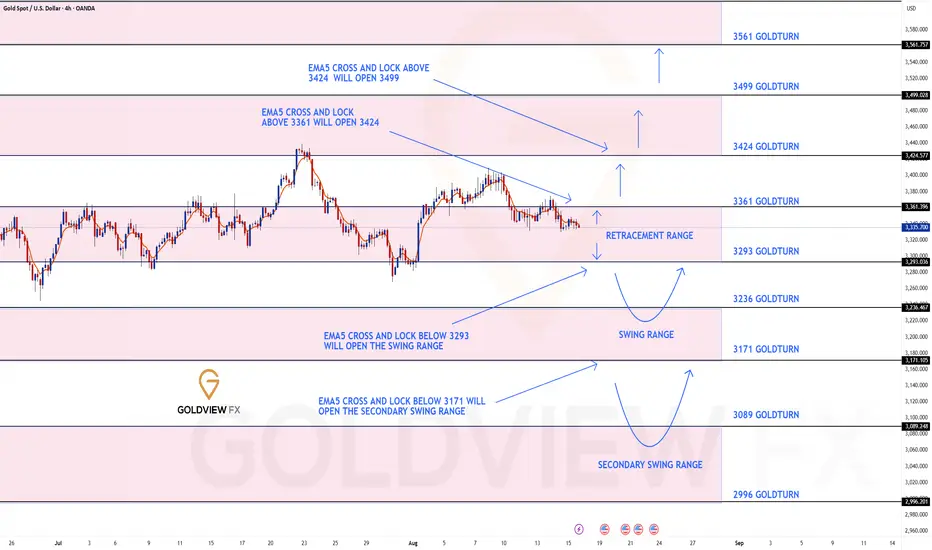
GOLD 4H CHART ROUTE MAP UPDATE & TRADING PLAN FOR THE WEEKHey Everyone,
Please see our updated 4h chart levels and targets for the coming week.
We are seeing price play between two weighted levels with a gap above at 3361 and a gap below at 3293. We will need to see ema5 cross and lock on either weighted level to determine the next range.
We will see levels tested side by side until one of the weighted levels break and lock to confirm direction for the next range.
We will keep the above in mind when taking buys from dips. Our updated levels and weighted levels will allow us to track the movement down and then catch bounces up.
We will continue to buy dips using our support levels taking 20 to 40 pips. As stated before each of our level structures give 20 to 40 pip bounces, which is enough for a nice entry and exit. If you back test the levels we shared every week for the past 24 months, you can see how effectively they were used to trade with or against short/mid term swings and trends.
The swing range give bigger bounces then our weighted levels that's the difference between weighted levels and swing ranges.
BULLISH TARGET
3361
EMA5 CROSS AND LOCK ABOVE 3361 WILL OPEN THE FOLLOWING BULLISH TARGETS
3424
EMA5 CROSS AND LOCK ABOVE 3424 WILL OPEN THE FOLLOWING BULLISH TARGET
3499
BEARISH TARGETS
3293
EMA5 CROSS AND LOCK BELOW 3293 WILL OPEN THE SWING RANGE
3236
3171
EMA5 CROSS AND LOCK BELOW 3171 WILL OPEN THE SECONDARY SWING RANGE
3089
2996
As always, we will keep you all updated with regular updates throughout the week and how we manage the active ideas and setups. Thank you all for your likes, comments and follows, we really appreciate it!
Mr Gold
GoldViewFX
GOLD WEEKLY CHART MID/LONG TERM ROUTE MAPWeekly Chart Update
Structure Unchanged: Range Still Contained
Following up on last week’s view, the structure remains exactly the same with price consolidating between 3281 support and 3387 resistance. The market continues to respect these pivots, keeping us firmly range-bound while the broader outlook stays intact.
Current Outlook
🔹 Range Still Active
Price is holding between 3281 and 3387. Until we see a confirmed breakout, range trading remains the strategy.
🔹 Support Intact at 3281
The gap support at 3281 continues to anchor the structure. As long as it holds, buyers retain a base to defend.
🔹 3387 Barrier Holding
Rejections at 3387 persist for now. However Keeping in mind that we still have a body close gap above this level to 3482 from 2 weeks ago.
🔹 Upside Target Remains 3482
The unfilled gap is still in play, but momentum needs a decisive push through 3387 first.
Updated Levels to Watch
📉 Support – 3281
Critical floor. A breakdown risks shifting bias bearish.
📈 Resistance – 3387
Immediate ceiling. A re-challenge looks likely before bigger moves can unfold.
📈 Upside Gap Target – 3482
Still the larger bullish objective once 3387 is reclaimed.
Plan:
With structure unchanged, price remains trapped between 3281 and 3387. Until a breakout occurs, the range defines the playbook. Watch for another attempt at 3387, a decisive close above flips momentum toward 3482, while failure to hold 3281 risks deeper rotation.
Thanks as always for your support,
Mr Gold
GoldViewFX

XAUUSD Daily Plan | Gold Awaits FOMC – Liquidity Hunt in ActionXAUUSD Daily Plan | Gold Awaits FOMC – Liquidity Hunt in Action
Gold continued to move lower into liquidity during the late US session yesterday and reacted strongly at the BUY ZONE 3314 – 3316 (MMFLOW Entry), already giving more than +70 pips profit so far ✅.
On the M5 – M15 short-term structure, Gold is showing a mild recovery. However, for buyers to take control, price must break the resistance at 3320 – 3322 with strong volume. A confirmed breakout here can trigger further upside momentum and retest higher KeyLevels.
📈 Upside Targets (Intraday): 333x and 334x – these levels may act as Take-Profit zones for longs or potential SELL opportunities in line with the corrective channel on M30 – H1.
🔔 Fundamental Focus – FOMC Meeting Ahead
Today, the FOMC meeting will be the key event during the US session. Traders are waiting for clues about the Fed’s rate decision. Any dovish signals about a possible rate cut in September could be the catalyst for a strong Gold rally, breaking the current bearish channel.
👉 During the Asia – Europe sessions, intraday bias remains bullish towards 333x – 334x, where we will also watch for selling opportunities.
⚠️ During the US session, expect high volatility with FOMC, so manage risk carefully.
📉 Technical Trading Plan
🔹 BUY Scalp Setup
Entry: 3311 – 3309
SL: 3305
TP: 3315 → 3320 → 3325 → 3330 → 3340 → 3350 → 3360+
🔹 BUY Zone (FOMC Plan)
Entry: 3290 – 3288
SL: 3282
TP: 3295 → 3330 → 3335 → 3340 → 3350 → 3360 → 3370+
🔸 SELL Scalp Setup
Entry: 3342 – 3344
SL: 3348
TP: 3338 → 3332 → 3328 → 3324 → 3320
🔸 SELL Zone (FOMC Plan)
Entry: 3360 – 3362
SL: 3368
TP: 3355 → 3350 → 3345 → 3340 → 3330
⚠️ Trading Notes
FOMC will bring high-impact volatility – stay alert.
Stick to TP/SL discipline and risk management to protect capital.
Remember: KeyLevels = Profits ✅

Is Gold About to Explode?Hello traders, today we can see gold making a strong recovery from the support level around 3,300 USD. If the price can break through the immediate resistance at 3,372 USD , gold could reach the target of 3,406 USD . The upward trend is supported by successive higher highs and lows, along with the EMA lines.
News Supporting the Bullish Trend:
The FOMC meeting minutes are dovish, jobless claims are higher than expected, and the PMI data is weaker than forecast, all indicating a weak economy. This could lead the Fed to maintain a loose monetary policy, weakening the USD. When the USD weakens, gold becomes more attractive, encouraging investors to turn to gold as a safe-haven asset, driving the price higher.
Conclusion: Based on both fundamental and technical factors, XAUUSD is trending upwards, supported by dovish FOMC minutes, high jobless claims, and weak PMI data. The next targets are 3,372 USD and 3,406 USD.
Strategy:
Buy if the price breaks above 3,372 USD, with a target of 3,406 USD.
Place a stop loss below 3,316 USD to protect capital.

Gold: Bearish Channel Persists Amid DXY ConsolidationHello everyone,
On the H1 timeframe, gold continues to trade within a clear descending channel. After a short rebound from the 3,312 USD area, the price faced resistance around 3,325 – 3,328 USD, which coincides with the 0.5 – 0.618 Fibonacci retracement and an unfilled FVG zone. Sellers have been using this region to reinforce downward pressure.
The latest green candle shows some recovery but is not strong enough to break the channel, suggesting that buying momentum remains weak. Unless gold can decisively push above 3,328 USD, the dominant scenario points to another decline toward 3,312 USD, with an extended target near 3,292 USD (aligned with the 1.618 Fibonacci extension and the lower boundary of the channel).
Looking at the DXY, the U.S. dollar index is currently moving sideways without a clear breakout, providing no major pressure on gold but also limiting its upside potential as investors remain cautious.
In terms of news flow, the market is waiting for key U.S. data this week, especially the FOMC minutes and labor figures. A stronger dollar could drive gold to fresh lows, while any signs of a more dovish stance from the Fed on interest rates may help gold stabilize at support and attempt a rebound.
What do you think—will gold hold its ground or break lower? Share your view in the comments below!

XAUUSDGold is in a correction phase, with prices likely to retest the support zones of 3321 and 3269.
However, if gold prices can hold above 3249, we expect the gold trend to be in an uptrend, consider buying the red zone.
(Very Risky Trade)
🔥Trading futures, forex, CFDs and stocks carries a risk of loss.
Please consider carefully whether such trading is suitable for you.
>>GooD Luck 😊
❤️ Like and subscribe to never miss a new idea!

6 Best Tips for Small Trading Accounts (Forex, Gold)
This useful trading tips will help you to efficiently start trading with a small trading account.
A quick note: by a small account, I mean an account size from 10$ - 2000$.
1 - Trade less often
Small account implies a limited amount of money for trading. It means that among dozens of trading opportunities that you spot during a trading day, you should carefully pick only the most promising ones.
I recommend opening maximum 3 trades per day.
2 - Stick to one strategy
One of the ways to trade less frequently is to stick to one single trading strategy. Most of the traders do completely opposite: instead of focusing on one approach, they prefer to trade multiple ones simultaneously.
Trading various strategies requires a lot of capital. The more strategies you follow, the more margin is needed.
With a small trading account, you are risking being left without a free margin for all the trading opportunities that the strategies provide.
3 - Trade liquid instruments with low spreads
When you are picking the financial instruments for your trading, make sure that you select the most liquid ones. You can assess the liquidity of the instrument by a spread. The bigger is the spread, the less liquid is the asset.
Take a look at a spread difference between EURUSD and CHFJPY.
The spread on EURUSD is 0.1 pip.
While the spread on CHFJPY is 2.7 pips.
Spreads directly affect the costs of trading. Bigger spreads reduce the potential profits and increase the risks.
Make sure that you choose the assets with the lowest spreads possible.
4 - Shorten the list of trading instruments
One more option to trade less often is to narrow down the list of your trading instruments. I recommend choosing the maximum of 7 instruments.
7 USD Major Forex Pairs:
EURUSD,
GBPUSD,
USDJPY,
USDCAD
NZDUSD
AUDUSD
USDCHF
is a perfect watch list for a small account trader.
5 - Don't trade higher time frames
Be careful when deciding a time frame to trade.
Remember that the higher is the time frame, the bigger are the stop losses for your traders.
On the left chart is the swing trade that I took with my students on EURUSD chart on a daily. While on the right is the scalping trade taken on 30 minutes time frame.
A stop loss for swing trade is 90 pips and a stop loss of scalping position is 19 pips.
Big stop losses require more free margin and limit the amount of the trades that you can take simultaneously.
For that reason, prioritize lower time frame trading with a small trading account.
6 - Don't risk more than 2% per trade
When traders trade with a small trading account, they often risk a huge portion of their trading account per a single trade.
If you have 100$ trading account, and you risk 20$ per trade, the nominal value of that risk does not look huge. But from a percentage standpoint, it is 20% of the total balance.
Just a 5 trades losing streak will blow such an account.
Make sure that you apply a position size calculator and risk no more than 2% of your account per trade.
Following these recommendations, you will be able to build an effective trading plan that will help you to grow your capital quickly.
❤️Please, support my work with like, thank you!❤️
I am part of Trade Nation's Influencer program and receive a monthly fee for using their TradingView charts in my analysis.
Gold Breakout Ahead of FOMC – Next Step Trading PlanGold Breakout Ahead of FOMC – Key Levels & Trading Plan
Gold surged strongly in line with MMFLOW’s previous outlook, breaking through short-term resistances and the descending trendline within just one session. This early breakout ahead of the FOMC meeting signals that bullish momentum is firmly in play.
Even though price moved before the actual FOMC release, the market confirmed our directional bias: after clearing liquidity below, Gold quickly bounced back, reclaiming higher zones. With positive fundamentals supporting the metal in the long run, the bullish case for XAUUSD remains intact.
Currently, structure shows a clean breakout of the bearish channel, and we are waiting for a retest of KeyLevels today to fuel the next bullish leg.
📊 MMFLOW Market Outlook
Primary Bias: Bullish – Buy the dips
Scenarios:
🔹 Buy opportunities near strong support levels
🔹 Tactical sells only at confirmed resistance with rejection
Daily chart left a strong bullish confirmation candle, suggesting that pullbacks are opportunities to reload long positions.
🔥 Trading Plan – Buy/Sell Zones & Scalp Strategy
✅ BUY SCALP
Entry: 3333 – 3331
Stop Loss: 3327
Take Profit: 3338 – 3343 – 3348 – 3352 – 3356 – 3360 – ???
✅ BUY ZONE (Swing/Position)
Entry: 3316 – 3314
Stop Loss: 3310
Take Profit: 3320 – 3325 – 3330 – 3335 – 3340 – 3350 – 3360 – ???
🔻 SELL ZONE
Entry: 3368 – 3370
Stop Loss: 3375
Take Profit: 3364 – 3360 – 3355 – 3350 – 3345 – 3340 – 3330
📌 Key Levels to Watch
Supports: 3332 – 3323 – 3315
Resistances: 3348 – 3362 – 3370 – 3383
🚨 Risk Note:
If price dips too deep into 331x, beware of potential liquidity traps. Always respect your TP/SL as volatility remains high around FOMC events.
✨ MMFLOW Reminder:
👉 KeyLevels = Profits.
👉 Buy the dips, ride the bullish pump.
