XAUUSD Selling from bearish ob at 3444 readmore...📊XAUUSD Gold Update – 1H Timeframe
Fast Sell-Off in Progress
Price reacting sharply from the bearish order block at 3444, showing strong bearish momentum
Sell trade now active — eyes on the target zone at 3400, which aligns with the previous breakout level and key demand area
Watching price action closely as it approaches this support zone for potential reaction or continuation
🧠Clean move respecting OB and structure — trade management in focus
What’s your next move on Gold? Let us know below
👍 Like | 🔔 Follow | 💭 Comment for more fast & clean updates
#xauusd #gold
prevoiuse chart target win
XAUUSDK trade ideas

Gold Trade Against the Odds: When Emotion Meets StrategyThis may not be the best decision right now — I understand that — but it's one of those " I'm exhausted and just want to buy " moments.
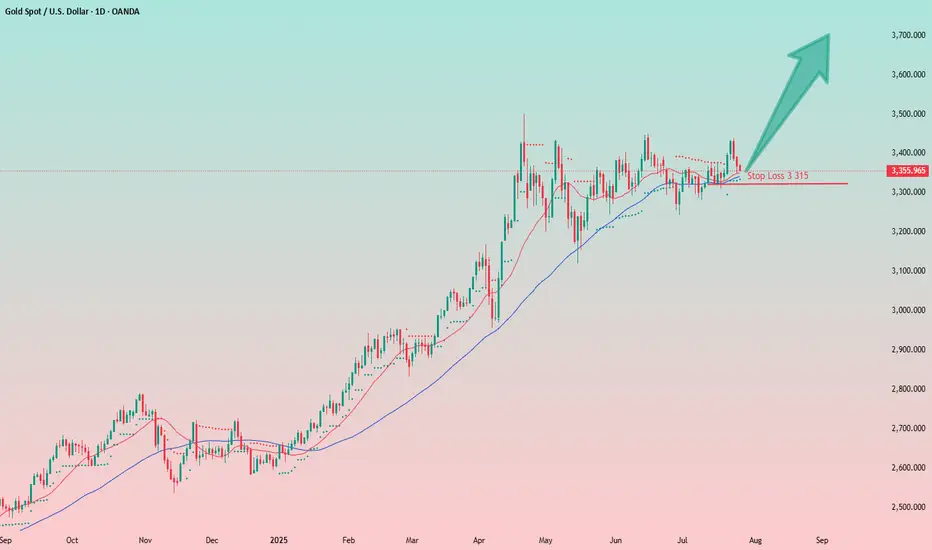
The setup isn’t fully formed yet, but I have a strong feeling we’re going higher. I like the chart structure: low volatility, a spike to 3430 followed by a pullback to the moving averages without breaking key levels. I also like the tight stop at 1.2%.
I’m buying gold at the current level, around 3355.
📝Trading Plan
Entry: I’m buying gold at the current level, around 3355
Stop Loss: Stop at 3315
Target: 3425, 3500, and beyond.
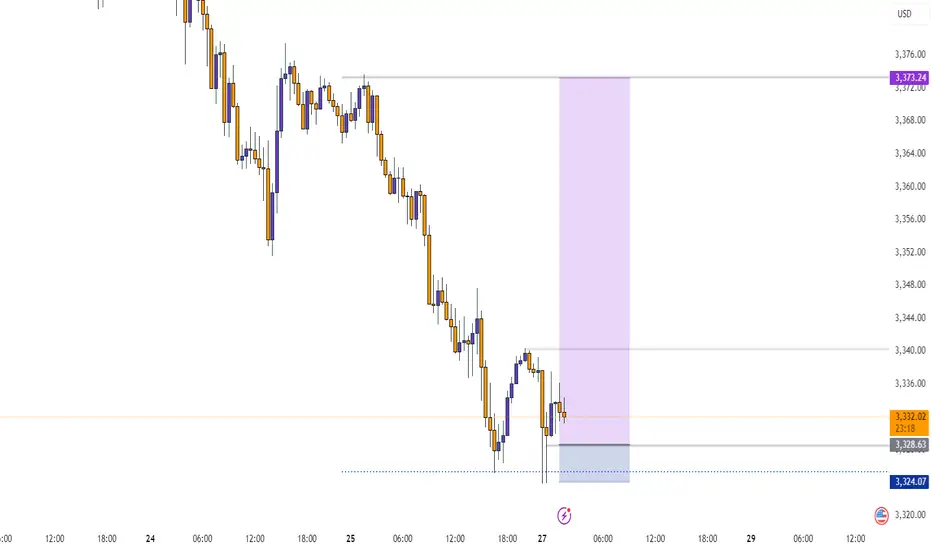
The US and Europe reached an agreement. Gold rebounded.At the current node, the EU and the US reached a tariff cooperation, 15% tariff + 600 billion US dollars for investment in the United States. The additional tariffs are considered a big deal, and the US has become the winner again this time.
Of course, this is a small negative for the current gold market.
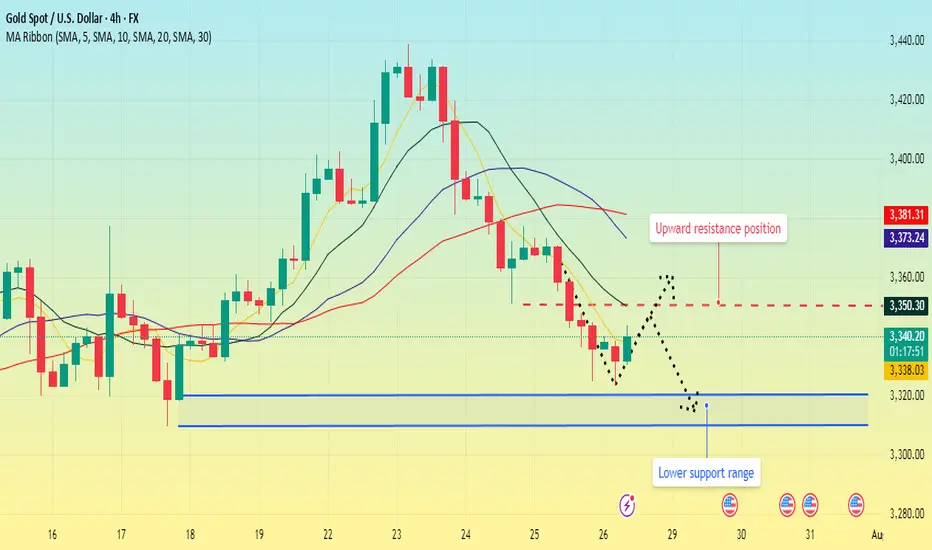
From a multi-period analysis, the monthly chart price is still in a reverse K state. For the current situation, we need to pay attention to the gains and losses of the monthly highs and lows. The weekly chart shows that the price has continued to fluctuate at a high level recently. As time goes by, the weekly watershed is temporarily at 3320. After last week's high and fall, there is currently a further downward performance.
The four-hour chart shows that the price has continued to be suppressed after breaking through the four-hour support last Wednesday. The four-hour level resistance is currently around 3355, and the resistance level has moved up compared with the early Asian market. Therefore, we will pay attention to the pressure at this position in the future. If it fails to break through for a long time, it is likely to fall directly under pressure; pay attention to the support range of 3320-3310 below.
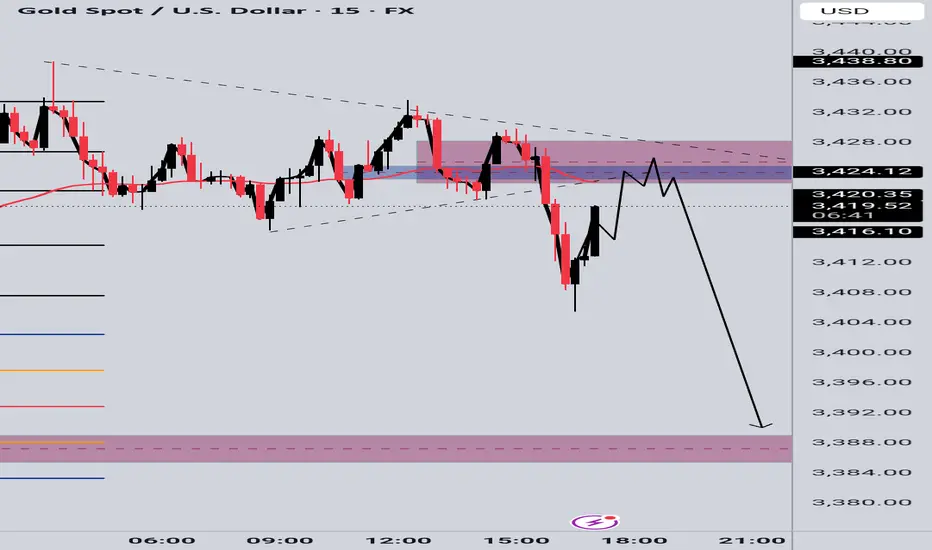
XAUUSD – The assassin returnsGold is showing a weak reaction around the 3,375 zone — a previous supply area — with RSI dipping into oversold territory but failing to bounce significantly. The chart reveals layered FVG traps, hinting at a potential -1.5% drop toward 3,324 within the next 18 hours.
Bearish catalyst: The U.S. jobless claims have dropped to a 3-month low → labor market remains strong → Fed likely to keep interest rates high → stronger USD, weaker gold.
Preferred setup:
SELL if price gets rejected at 3,375
SL: 3,390
TP: 3,324 – 3,310


GOLD SELL SETUPWe failed the bullish momentum on previous chart ,now aiming for the continuation to the downside;
🔹 Entry Zone: 3425–3430 (Supply Rejection)
🔸 Trendline Break + Liquidity Sweep Confirmed
🎯 Targets:
— TP1: 3410
— TP2: 3388 (Major Demand Zone)
🔒 Bearish momentum building, watching for continuation toward the lower zone.
BuyRejection Level
Daily Volume
Market Structure Shift
Asian Session
Trend Line Break
Untapped Order Point
XAUUSD Strong Support zone at 3312 buyers area 📊XAUUSD 1H Forecast
As you know, XAUUSD had a major drop recently, but now it's reaching a key demand zone at 3312 — a strong buyers' area
Price is reacting bullish from this level, and we're looking for upward continuation
📌Target Zones:
3355 – Supply Zone
3400 – Resistance Level
3430 – Bearish Order Block (Watch for reaction)
🕒Outlook:
Strong buying pressure is building from 3312, and momentum is shifting upward.
We remain bullish toward supply and resistance zones — watching closely at 3430 OB for any signs of rejection
*👋Regards From Expert Team*

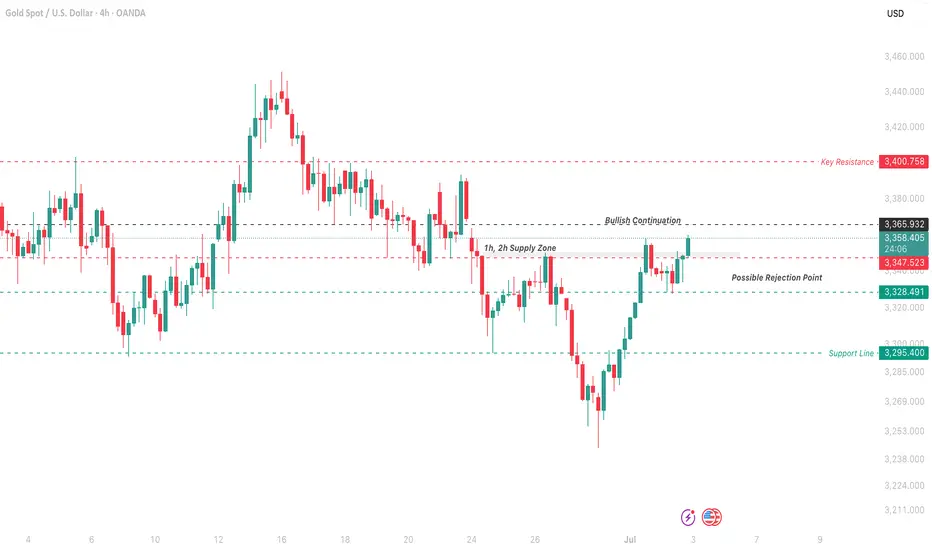
XAU/USD Struggles Below 3366, Bearish Pressure Remains ActiveXAU/USD Tests Supply Zone – Watching 3365 for Bullish Continuation
Gold is climbing amid global uncertainty and U.S. tariff concerns ahead of the July 9 deadline. But strong resistance is still in play.
The price is now testing the 1H–2H supply zone and has pushed past the pivot (3347–3352). A clear 4H close above 3365 will confirm bullish continuation.
Until then, upside remains capped. If price fails to sustain above 3365, a drop back toward 3328 and 3295 is likely.
Key Levels:
Resistance: 3352 – 3365 – 3400
Support: 3328 – 3295 – 3285
Pivot Zone: 3347–3352
XAUUSDXAUUSD shows short-term bearish pressure, with price failing to hold above recent resistance and momentum weakening.

Gold (XAUUSD) Buy Setup – 30m Gold (XAUUSD) Buy Setup – 30m Chart
I am in a buy from 3307. Price is holding the support zone 3326–3334.
Looking for a bounce towards 3338 and 3375.
Stop loss below 3290.

Losing over and over again? Losing over and over again? The problem isn’t your strategy – it’s your mind.
Let’s be honest:
Are you repeating the same old mistakes… even though you know they’re wrong?
You know you shouldn’t enter a trade without confirmation – but you still do.
You know you should stick to your stop-loss – but you move it.
You know your mindset is unstable today – but you still open the chart and… click.
So stop blaming the market.
You’re not losing because the market is cruel.
You’re losing because you can’t control yourself.
💣 The most dangerous psychological trap: Knowing it's wrong – but doing it anyway
It’s not because you lack knowledge.
It’s not because your system doesn’t work.
It’s because your emotions are running the show.
Ask yourself:
Have you ever traded just to escape boredom, helplessness, or emotional emptiness?
Have you ever used the chart to hide from real-life pressure?
Have you ever placed a trade just to relieve stress?
If your answer is yes... then the problem isn’t technical.
It’s psychological – and deeper still, it’s emotional.
👹 The 3 emotional demons controlling your trading – and you don’t even realise it
1. FOMO – You fear being left behind more than you desire to win
You see price running → you see others making money → you feel the pressure.
You think: “I can’t miss this move!”
→ You jump in impulsively, without analysis.
FOMO reflects a lack of trust in yourself.
You don’t believe more opportunities will come.
You’re not trading with clarity – you’re reacting from fear.
2. Revenge Trading – You can’t accept the feeling of being “wrong”
Every loss feels like humiliation.
You can’t handle being “mistaken.”
So you fight the market back – like someone who’s lost all reason.
But the market doesn’t care if you’re hurt.
You’re projecting your frustration onto a system that has no emotion.
→ In that moment, you’re no longer a trader – you’re a gambler trying to ease emotional pain.
3. Overtrading – You measure your worth by how many trades you win
You only feel valuable when you’re making money.
You hate “doing nothing” – it makes you feel useless.
So you keep trading – endlessly, irrationally.
Overtrading reflects a deep fear of stillness and lack of control.
You seek validation… from your trading account.
🔍 Painful truth: You’re not losing because of the market – you’re losing because of unrealistic expectations
You expect to always be right.
You expect to get rich quickly.
You expect to prove something – to others and to yourself.
You pressure yourself to perform – and when results don’t come, your psychology collapses.
You’re not trading to beat the market.
You’re trading to fix something inside yourself.
✅ The solution? It’s not more knowledge – it’s emotional honesty
Stop trading the moment you feel out of control – whether you're winning or losing.
Keep an emotional journal daily – even on days you don’t trade. Be raw. Be real. No excuses.
Ask the right questions:
Am I trading to make money – or to soothe an emotional void?
Am I entering because of a setup – or because I’m afraid of missing out?
Do inner work outside of trading: meditate, exercise, heal emotionally, take breaks, talk to someone who gets it.
💬 Final thought:
Losing isn’t scary – what’s scary is never facing the real reason behind your losses.
Stop searching for the next shiny indicator.
Stop chasing strategies with a “90% win rate.”
You just need a decent system – and a strong mind to execute it.
True success comes when you no longer use trading to prove yourself –
but treat it like a calm, patient profession.
#TradingPsychology #EmotionalDiscipline #FOMOTrading #RevengeTrading #Overtrading
#MindsetMatters #TraderGrowth #SelfAwareness #TradingUK #ForexEducation #InnerGameOfTrading #ConsistencyIsKey #MentalEdge

Xauad techinical analysis.Xausd techinical analysis next move posibale at h1 time frame not finchinical advice.

Today Gold Phucqed All Buyer today i think there is some us terriffs news which began gold to dump very badly , market liquidate the buyers , I am also a buyer and lost 9% today but here we go , im still a buyer , there is no strong logic behind it it's a gut feeling strategy 😅 now i am going for prayer ,

Gold Outlook for Today Todays outlook for Gold - I really cant share my strategy, if you want it, just send me a message and I will, It very simple, I think trading is simple, we just over think and complicate things

GOLD awaiting confirmation of a bullish zone formation.Gold has confirmed support at 3310, with the price rebounding and returning to the buying side. We are now awaiting confirmation of a bullish zone formation.
Gold remains under pressure ahead of key market-moving events, including the US GDP data release and the Federal Reserve’s interest rate decision. However, the pause in Dollar strength is offering some support to the gold price. As long as the price holds above this level, the bullish scenario remains valid. A sustained move above this zone may open the path toward the next resistances: 3360 / 3385 we can expect Growth more.
You May find more Details in the Chart.
Trade wisely best of Luck Buddies.
Ps: Support with like and comments for more insights Thanks for Supporting.

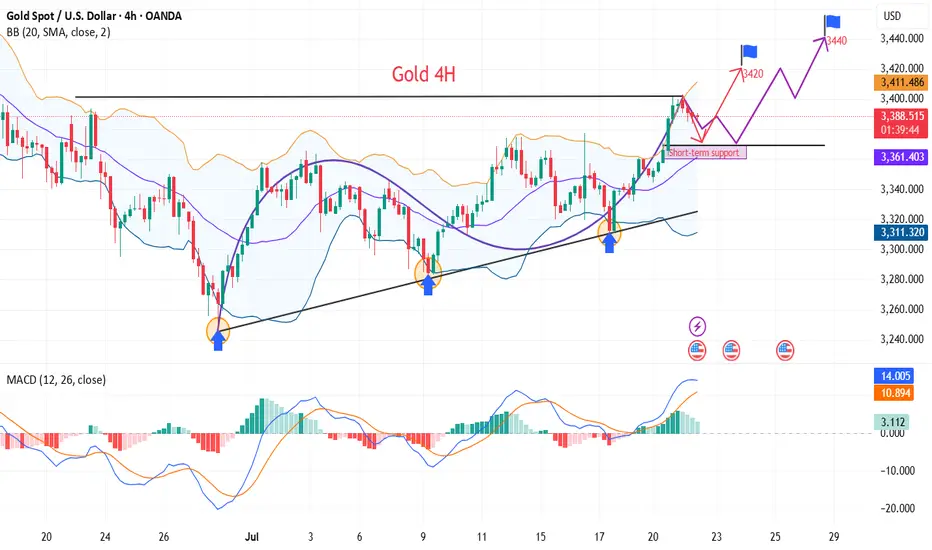
3400 is no longer the target for gold. The answer is: higher
After gold touched 3,400, most people expected gold to fall back. This kind of rigid thinking is often out of touch with reality. During the rise, do you think it is better to short at highs or to go long on pullbacks?
💡Message Strategy
This round of gold's upward movement is not accidental. Behind it are significant changes in macro fundamentals. First, the overall weakening of the US dollar. The recent decline of the US dollar index to below the 98 mark reflects the market's concerns about the outlook for the Fed's policy. At the same time, the 10-year US Treasury yield also fell below 2%, and the actual yield fell, strengthening the relative attractiveness of gold.
More worthy of vigilance are the political rumors surrounding the re-election of Fed Chairman Powell. According to the Wall Street Journal, US Treasury Secretary Bessent once advised the president to avoid removing Powell from office to maintain the reputation of the Fed. However, speculation about Powell's possible dismissal remains, although Trump himself publicly denied the relevant plan.
In addition, Europe's actions have also disturbed the market. According to Bloomberg, citing EU diplomatic sources, if no agreement is reached before August 1, the EU will impose retaliatory tariffs on US products worth US$72 billion, covering areas such as automobiles, aircraft, alcohol and digital services. These messages have formed a risk resonance environment of "political uncertainty + economic friction", providing a natural long hotbed for gold.
Although the US economic data is slightly mixed - consumer confidence has rebounded, but inflationary pressure continues, with CPI approaching 3% in June - this has made the market full of doubts about the Fed's monetary policy path. Especially in the case of sparse economic data this week (only new housing data, initial claims and durable goods orders), the market focus is on the impact of political and policy conflicts on market confidence.
📊Technical aspects
From the daily candlestick chart, gold has recently shown signs of breaking upward after five weeks of sideways fluctuations. In terms of MACD indicators, the MACD histogram has turned from green to red, and the fast and slow lines have formed a "golden cross", strengthening the expectation of a short-term technical rebound.
For gold's lower support, pay attention to last week's high of $3,380, which is also the current 4-hour MA10 moving average position. Secondly, pay attention to the multiple declines in gold prices in the European session on Monday to test the stabilization position of $3,370. For gold's upper pressure, pay attention to the intraday high of $3,402, which is also the high point of gold's rise on Monday. After the decline in June, gold prices rebounded several times to test resistance here and further strengthened. The upper space can pay attention to the high point of the past three months at $3,440.
The previous five weeks of consolidation showed that the market was waiting for directional signals, and this breakthrough of the 3,400 mark was achieved against the dual backdrop of a falling US dollar and rising political uncertainty in the United States, with the typical characteristics of "news trigger + technical confirmation".
If gold successfully stabilizes above 3400, the market will turn its attention to the two key resistance areas of 3451 and 3499, the year's high. Breaking through the former will open up space to test new historical highs upwards; combined with the current MACD golden cross pattern, if the capital side and fundamentals continue to cooperate, short-term accelerated rise cannot be ruled out.
💰Strategy Package
Long Position:3370-3380,SL:3350,Target: 3420,3440
Learn What is PULLBACK and WHY It is Important For TRADING
In the today's post, we will discuss the essential element of price action trading - a pullback.
There are two types of a price action leg of a move: impulse leg and pullback.
Impulse leg is a strong bullish/bearish movement that determines the market sentiment and trend.
A pullback is the movement WITHIN the impulse.
The impulse leg has the level of its high and the level of its low.
If the impulse leg is bearish , a pullback initiates from its low and should complete strictly BELOW its high.
If the impulse leg is bullish , a pullback movement starts from its high and should end ABOVE its low.
Simply put, a pullback is a correctional movement within the impulse.
It occurs when the market becomes overbought/oversold after a strong movement in a bullish/bearish trend.
Here is the example of pullback on EURJPY pair.
The market is trading in a strong bullish trend. After a completion of each bullish impulse, the market retraces and completes the correctional movements strictly within the ranges of the impulses.
Here are 3 main reasons why pullbacks are important:
1. Trend confirmation
If the price keeps forming pullbacks after bullish impulses, it confirms that the market is in a bullish bearish trend.
While, a formation of pullbacks after bearish legs confirms that the market is trading in a downtrend.
Here is the example how bearish impulses and pullbacks confirm a healthy bearish trend on WTI Crude Oil.
2. Entry points
Pullbacks provide safe entry points for perfect trend-following opportunities.
Traders can look for pullbacks to key support/resistances, trend lines, moving averages or Fibonacci levels, etc. for shorting/buying the market.
Take a look how a simple rising trend line could be applied for trend-following trading on EURNZD.
3. Risk management
By waiting for a pullback, traders can get better reward to risk ratio for their trades as they can set tighter stop loss and bigger take profit.
Take a look at these 2 trades on Bitcoin. On the left, a trader took a trade immediately after a breakout, while on the right, one opened a trade on a pullback.
Patience gave a pullback trader much better reward to risk ratio with the same target and take profit level as a breakout trader.
Pullback is a temporary correction that often occurs after a significant movement. Remember that pullbacks do not guarantee the trend continuation and can easily turn into reversal moves. However, a combination of pullback and other technical tools and techniques can provide great trading opportunities.
❤️Please, support my work with like, thank you!❤️
I am part of Trade Nation's Influencer program and receive a monthly fee for using their TradingView charts in my analysis.
GOLD Melted , 2 Best Places To Sell Clear , Don`t Miss 200 Pips Here is My 30 Mins Gold Chart , and here is my opinion , we Again Below 3377.00 and we have a 30 Mins Candle closure below this strong res , so i`m waiting the price to go back and retest this res and new support and give me a good bearish price action to can enter a sell trade and we can targeting 200 pips , and we have a good res @ 3365.00 we can sell from it also if the price didn`t reach 3377.00 and targeting from 100:200 pips , and if we have a Daily Closure below This res this will increase the reasons for us , just wait the price to back a little to retest it and then we can sell it . if we have a daily closure aboveit this idea will not be valid anymore .

The Myth of Gold Reversals – Why Traders Keep Catching the KnifeGold is a master of deception.
It shows a clean wick into a zone, but reacts just enough to pull in early buyers or sellers — then rips straight through their stops like they weren’t even there.
The reversal looked real and the candles seemed perfect.
But the move? It was never meant for them.
This isn’t bad luck, but traders who survive aren’t trying to guess, they are the ones reading the reaction after the trap.
Let’s break down how these traps happen — and how Smart Money actually operates when XAUUSD is loading a real move.
🟥 Sell Trap – The "Instant Short" Mistake
Price pushes up into a clear reaction zone — maybe an OB, maybe an imbalance, a FVG, or a gap.
Structure looks stretched. Traders recognize a premium zone and decide it’s time to short.
The trap? Jumping in immediately on the touch, with no confirmation.
This is where Gold loves to trap sellers.
No M15 CHoCH/ BOS on M5 or real liquidity swept. Just a blind move and hope.
Price often pulls slightly higher — sweeping internal liquidity, triggering SLs — then shows a real rejection.
📌 Here’s what needs to happen before selling:
• First: look for a liquidity sweep (equal highs or engineered inducement)
• Then: price must shift — CHoCH or BOS on M15 or M5
• Finally: confirmation via bearish engulf, imbalance fill, or break + retest
• For experts: M1 can offer refined sniper triggers with minimal drawdown
💡 If none of this appears, it’s not a setup — it’s a trap.
🟩 Buy Trap – The "Wick Bounce" Illusion
Price taps a demand zone — again, a refined OB or imbalance, liquidity zone.
A long bullish wick forms. Some candles pause. It looks like a reversal.
But there’s no shift.Just hovering.
Many jump in long the second they see the wick. And then price breaks straight through.
📌 Here’s how to flip this trap into a real buy:
• Let price sweep liquidity below the zone — signs of a purge - true wick bounce
• Watch for a CHoCH or BOS on M15, M5, or even M1
• Look for a strong bullish engulf from the reactive level
• Confirm via imbalance fill or price reclaiming broken structure
📍 If all that happens — the trap becomes your entry.
If not? Stand down.
📊 What Smart Traders Actually Do Differently
They don’t chase wicks.
And never enter just because price tapped a line.
IT IS ALL ABOUT READING STRUCTURE AND PRICE ACTION.
Here’s how:
• Mark the highest probability reaction zones — above and below current price;
• Set alerts, not blind entries;
• Wait for price to come into their zone and then watch what it does there;
• Look for confirmation: CHoCHs, BOS, engulfing candles, FVG fills, clean rejections;
• And always keep one eye on the news — because Gold reacts fast and violently when volatility hits.
• Repeat this work daily until they learn how to recognize signs faster and more secure.
That’s the difference between chasing the reversal… and trading the move after the trap.
Because in this game, patience isn’t just a virtue — it’s survival.
And Gold? Well, XAUUSD has no mercy for those in a hurry and not studying its moves day by day, month after month and so on. Learn structure and price action even if you join any channel for help if you are serious about trading this amazing metal.
If this lesson helped you today and brought you more clarity:
Drop a 🚀 and follow us✅ for more trading ideas and trading psychology.
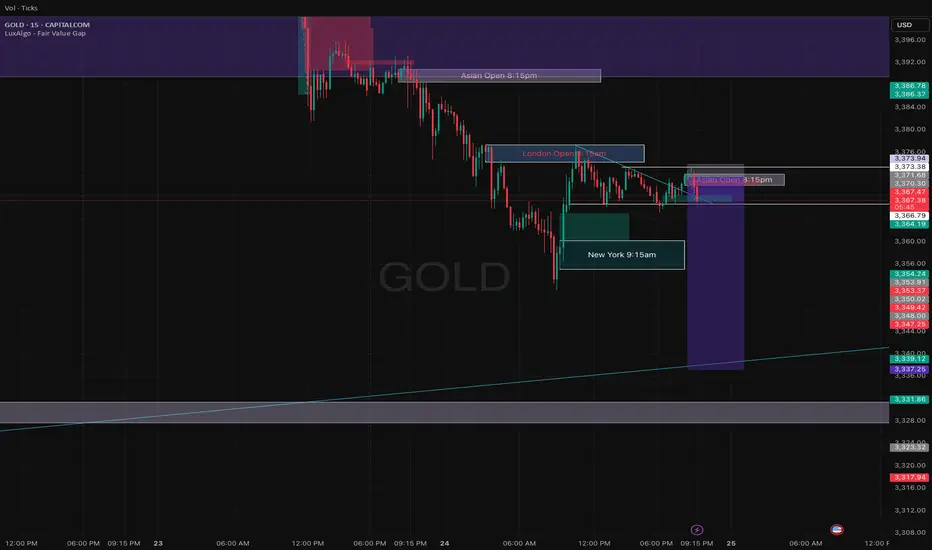
XAUUSD LIVE OUTLOOK – JULY 23, 2025Good evening, traders—let’s get this right, no mistakes. Gold hit 3,438, then pulled back and found support exactly in the 3,380–3,390 zone. Here’s your precise update:
🔸 HTF OVERVIEW (H4 → H1)
New High & Liquidity Sweep: A clean breakout to 3,438 invalidated every old supply.
Primary Demand: Price settled into the 3,380–3,390 H4 order block (untested FVG beneath). H1 confirms this blue zone as the critical buy area.
Invalidated Supply: No valid sell zones until we carve fresh structure above 3,438.
🔹 LTF PRECISION (M30 → M15)
M30 Flow: Spike to 3,438, then instant drop into 3,380–3,390. Volume spiked on the decline, then eased as price held.
M15 Structure: Inside 3,380–3,390, watch for a clean BOS above 3,395—that’s your bull‑bear pivot. Until then, this zone is the edge of the knife.
🎯 KEY ZONES & TRIGGERS
Buy Zone #1 (Live): 3,380–3,390
Confluence: H4 order block + unfilled FVG + H1 swing low
Trigger: M15 BOS above 3,395 and retest.
Buy Zone #2 (Backup): 3,350–3,360
For a deeper pullback—untested H4 demand.
Sell Zone: 3,420–3,438
Confluence: unfilled H4 FVG + premium supply
Fade only on clear M15 rejection (pin‑bar/engulf).
Decision Pivot: 3,395
Above = bullish continuation; below = stand aside.
➡️ ACTION PLAN
Longs: Enter on M15 close above 3,395 and retest; targets at 3,420 then 3,438.
Shorts: Only on rally into 3,420–3,438 with a decisive rejection candle.
Invalidation: A sustained break below 3,380 warns of a deeper flush toward 3,350–3,360.
🚀 CALL TO ACTION
If this nailed your edge, smash that Like, Follow @GoldFxMinds for daily sniper updates, and Boost this post so your fellow traders don’t miss these live levels! Drop a 🔥 if you’re ready to strike the next move.
Disclosure: I’m part of TradeNation’s Influencer program and receive a monthly fee for using their chart feed.
— GoldFxMinds

Gold Market Update – Key Zones for the Next MoveHey gold lovers! As the NY session wraps up, the chart is a painting of tension: gold boxed tight between major structure — and the real action is only about to start.
Bias:
At this stage, gold remains in a short-term bullish structure as long as price holds above the 3421–3428 decision area. A break and hold below this zone would shift the bias to neutral or bearish for the next sessions.
🎨 What’s drawn on the chart?
🟥 3472–3478 Supply Zone:
The ceiling, still untouched — this is where every failed breakout has left a “scar” on the chart. If we finally reach this zone, watch for wicks, rejections, or that rare, clean breakout candle. Sellers and patient bulls are both watching for “the drawing” to be complete.
🟩 3383–3390 Demand Zone:
The real floor. On your chart, it’s the base built by strong bounces and those long wicks buyers left behind. If price falls here, it’s not just a line: it’s a zone where new rallies are born and the market might “paint” a major reversal.
🟦 The Middle is Just Noise
Price is coiling, painting confusion in the center — but the edge zones are where structure and opportunity live.
Don’t be the trader who gets erased in the chop. Let price draw the story at supply or demand before making your move.
💡 Plan for Tonight
Wait for price to reach 🟥 supply or 🟩 demand.
Watch the “drawing” — will you see a wick, a rejection, or a true breakout?
Only trade once the story is clear at the edges.
Drop your best chart art or scenario below!
like🚀🚀🚀and 🔔 Follow for real structure updates & daily market stories — let’s turn trading into a masterpiece, together.
GoldFxMinds
