XAUUSD FORMING A CONTRACTING TRIANGLEXAUUSD is forming a contracting triangle which is much visual on the Daily T.F.
This is a continuation pattern.Since Wave 3 is completed,Wave 4 is forming a contracting triangle which is time consuming which can lead to permature trade entries or missed opportunities.
Best trade is to wait for the completion of Wave 4 at the 3055 level,which may push prices higher to the 3850 level a new high.
XAUUSDK trade ideas

XAU/USD Analysis – Critical Breakout Zone Approaching 30M Chart📈 XAU/USD Analysis – Critical Breakout Zone Approaching (30-Minute Chart)
🔍 Technical Overview:
Chart Type: 30-minutes
Indicators: Ichimoku Cloud
Key Structures: Supply & Demand Zones, CHoCH, BOS, Trendlines, Triangle Formation
🔑 Key Market Observations:
🟢 Demand Zone (Support) ~ $3,300 – $3,310
This area has been tested multiple times and has shown strength in absorbing selling pressure.
A bullish triangle formation is converging into this zone, suggesting a potential breakout point is near.
🔴 Supply Zone (Resistance) ~ $3,375 – $3,390
Repeated price rejection from this zone marks it as a strong institutional-level resistance.
Price needs a clean breakout and volume confirmation to push through this level.
📉 Break of Structure (BOS) & Change of Character (CHoCH):
BOS and CHoCH levels are clearly marked, showing a trend shift from bullish to bearish (post-supply test).
The last CHoCH aligns with a lower high, reinforcing bearish dominance unless invalidated.
📐 Symmetrical Triangle Formation:
Price is squeezing between higher lows and lower highs, coiling before a significant breakout.
Two scenarios are outlined:
Bullish Breakout: Clear move above triangle resistance → test of supply.
Bearish Breakout: Breakdown → revisit demand zone or even drop toward $3,280–$3,270.
☁️ Ichimoku Cloud:
Price is currently testing the lower boundary of the Ichimoku cloud.
A bullish breakout into/above the cloud may act as confirmation of a reversal attempt.
💡 Potential Trade Setups:
✅ Bullish Case:
Trigger: Break and close above $3,335 with volume.
Target 1: $3,375 (Supply Zone)
Target 2: $3,440 (Extended Target)
Invalidation: Rejection from triangle top and close below $3,310.
❌ Bearish Case:
Trigger: Break and close below $3,310 (triangle breakdown).
Target 1: $3,280
Target 2: $3,260
Invalidation: Bullish breakout of triangle and flip of previous CHoCH level.

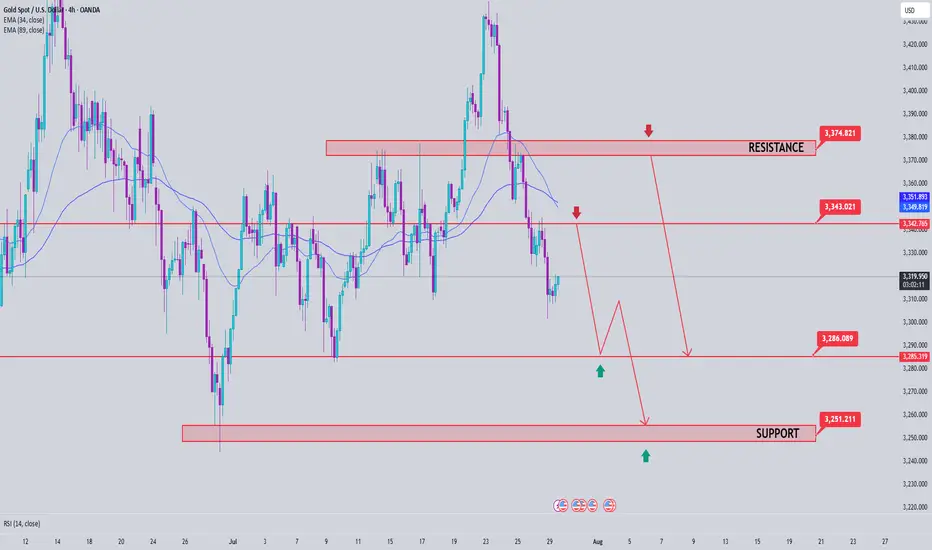
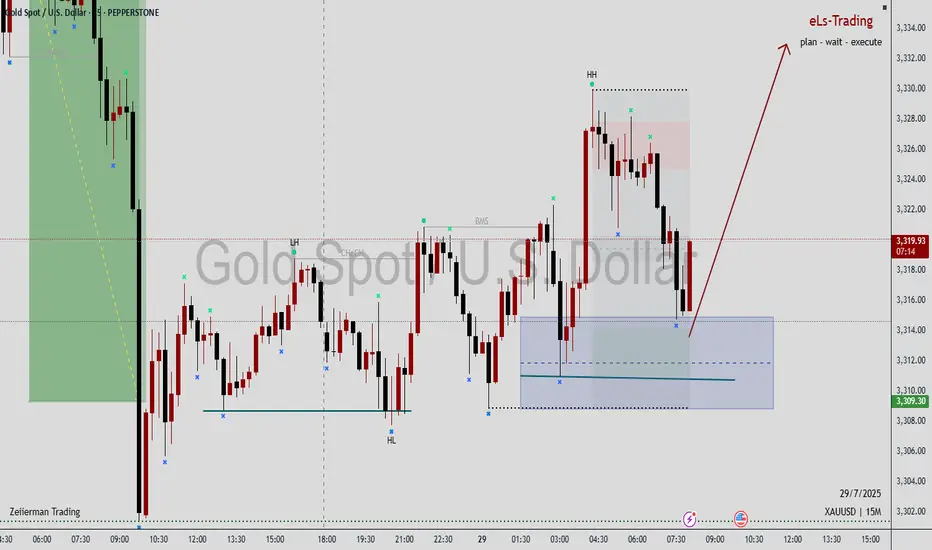
Gold Price Analysis July 29📉 XAUUSD ANALYSIS – IS THE CORRECTION OFFICIALLY STARTING?
Gold has officially broken out of the bullish wave structure and left the rising price channel – an important technical signal that the bearish correction trend has been activated. This development opens up the possibility of retests of the broken trendline, and if that happens in today's session, this could be a good opportunity to look for SELL entry points in the new trend.
📌 Short-term trading strategy:
Potential selling zone: 3343 – 3345
Downside target: 3283 first, followed by the strong liquidity zone around 3250
Confirmation of bearish force: Price continues to maintain below the 3375 area – which will act as an important resistance level. Only when the daily candle closes back above this zone will the uptrend be re-established.
✅ Reverse buying strategy if there is a strong support signal:
Buy trigger zone: Observe the price reaction around the 3285 area - there needs to be a clear bearish rejection signal (pin bar/bullish engulfing candle...)
Deeper buying zone: 3251 - where liquidity is concentrated and there is a possibility of bottom-fishing demand appearing.
GOLD - Near Current Resistance? holding or not??#GOLD... so market perfectly holds our expected bottom and bounced back and now market just near to his current Resistance region.
that is around 3328 to 3332
keep close that region because if market hold it in that case we can see again drop towards our ultimate support 3310
NOTE: we will go for cut n reverse above 3332 on confirmation.
good luck
trade wisely
GOLD trades in narrow range after 4 sessions of sharp declineOn Tuesday (July 29), in the Asian market, the spot OANDA:XAUUSD traded in a narrow range after yesterday's sharp decline, and the current gold price is around 3,315 USD/ounce.
The OANDA:XAUUSD fell to its lowest level in nearly 3 weeks on Monday, mainly due to the trade agreement reached between the United States and the European Union over the weekend, which boosted the Dollar and risk sentiment.
The previous report released by the US Bureau of Labor Statistics showed that the number of US JOLTS jobs unexpectedly increased in May, reaching the highest level since November last year.
The number of JOLTS job vacancies in the US in May was 7.769 million, far exceeding the forecast of all economists surveyed.
Looking back at the data in April, the number of JOLTS job vacancies also showed an unexpected increase.
The JOLTS jobs report is a closely watched labor market data by the Federal Reserve.
In addition, the Conference Board of America's Consumer Confidence Index for July is scheduled to be released on the same day and is expected to be 95.8, compared to the previous value of 93.0.
The fundamental pressure that gold is under
OANDA:XAUUSD came under pressure yesterday and fell to a near three-week low, mainly due to the trade deal between the United States and the European Union (EU) over the weekend, which boosted the Dollar and risk sentiment. Moreover, US President Trump announced “global tariffs” of 15% to 20% on most countries, a change from his previous statement last week.
The deal reached by U.S. President Donald Trump and the European Union late last week will impose a 15% tariff on EU goods, half the rate Trump had threatened, easing fears of a wider trade war.
The U.S. and Japan also reached a deal last week, and U.S. and Chinese officials resumed talks in Stockholm, Sweden, this week with the goal of extending the tariff deadline by 90 days.
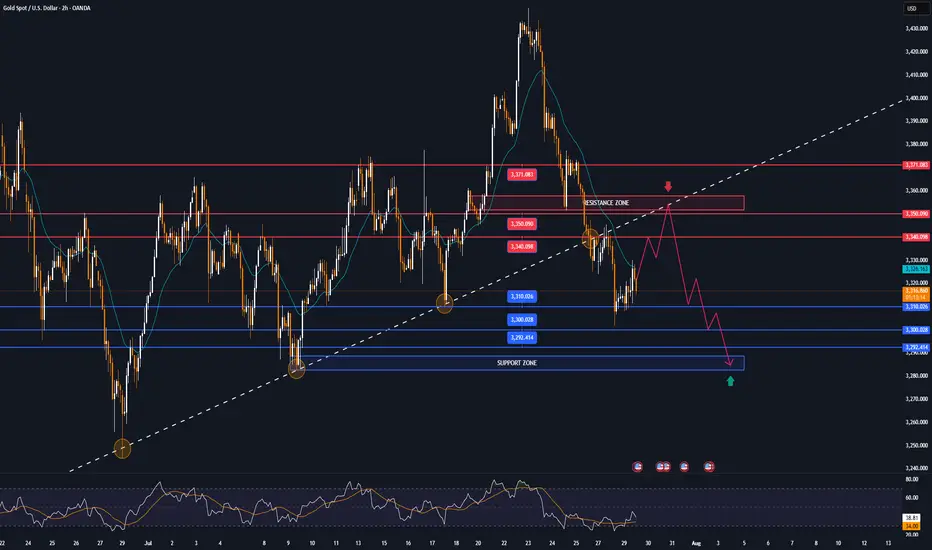
Technical Outlook Analysis OANDA:XAUUSD
Gold has been on a four-day losing streak, a decline that threatens bullish expectations as its current position gradually deprives it of any room for further upside.
Specifically, gold has recovered from the psychological level of $3,300 but the actual recovery is not significant, while it is under pressure from the EMA21 which is currently the closest resistance.
On the other hand, gold has fallen below both the long-term and short-term trend channels. If it continues to sell below the 0.382% Fibonacci retracement level, this will confirm a break below the psychological level of $3,300, then the downside target will be around $3,246 in the short term, rather than $3,228.
RSI is pointing down, below 50 and still far from the 20-0 area, also showing that in terms of momentum, gold is also under pressure and there is still a lot of room for decline ahead.
For gold to be eligible for an increase, it needs to at least bring price activity back above the EMA21, back inside the price channels. On the current daily chart, the technical conditions are more inclined towards the possibility of a decrease.
Notable positions will be listed as follows.
Support: 3,310 - 3,300 - 3,292 USD
Resistance: 3,340 - 3,350 - 3,371 USD
SELL XAUUSD PRICE 3355 - 3353⚡️
↠↠ Stop Loss 3359
→Take Profit 1 3347
↨
→Take Profit 2 3341
BUY XAUUSD PRICE 3285 - 3287⚡️
↠↠ Stop Loss 3281
→Take Profit 1 3293
↨
→Take Profit 2 3299
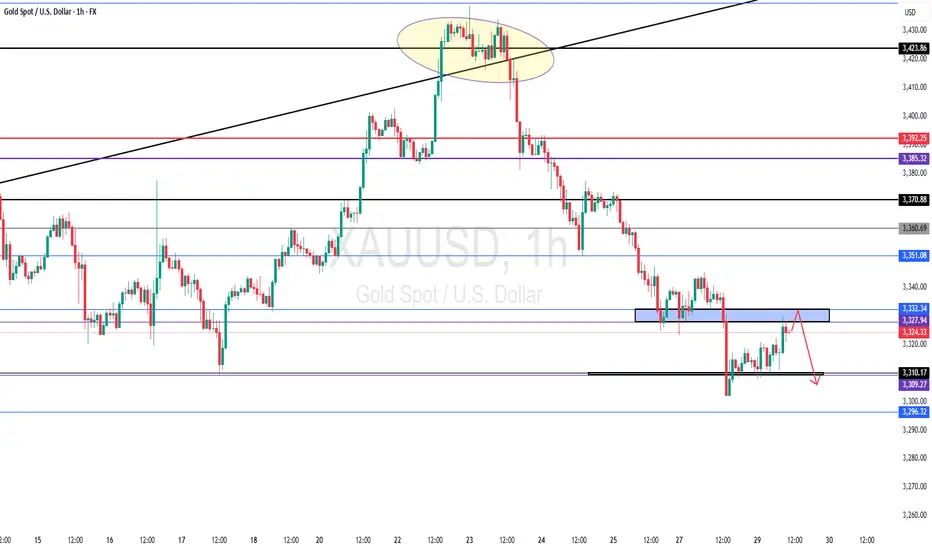
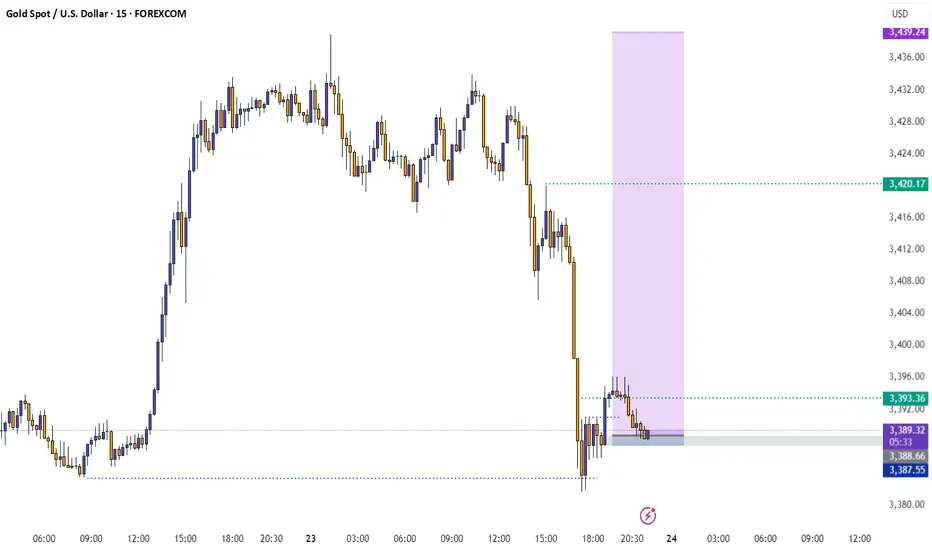
Gold 1H Intra-Day Chart 28.07.2025We saw a perfect move towards our $3,310 target, hitting our TP. What's next?
Option 1: Gold now moves higher into the $3,385 area, before we can determine the next major move.
Option 2: Gold drops lower towards $3,265 next.
Which scenario do you find more likely?

CHECK XAUUSD SIGNAL READ CAPTAINEntry Point: Around 3337.000 3333.000
Stop Loss: Around 3318.000
🎯 Target Levels
Take Profit 1:
3364.000
Take Profit 2:
3389.000
last target
3420.000


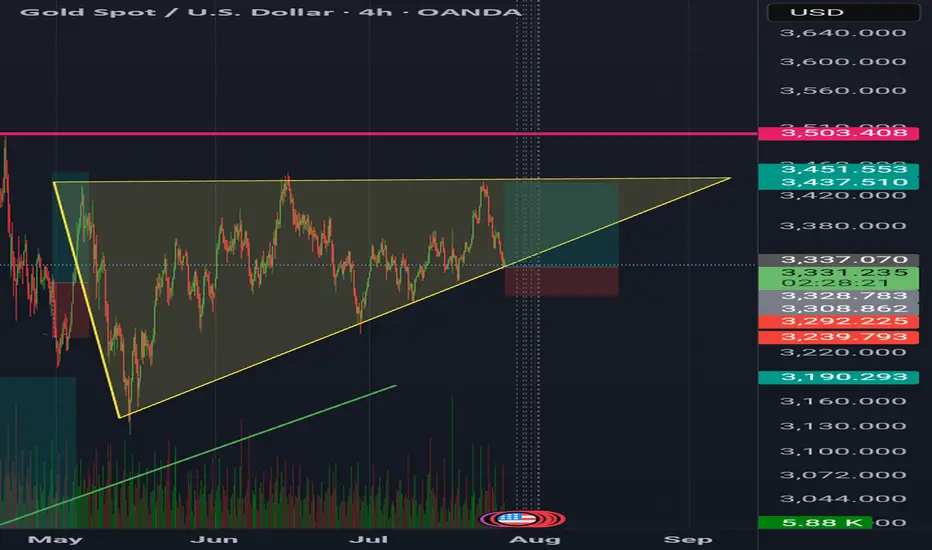
GoldXau usd daily analysis
Time frame 4 hours
Gold is moving up and down in the yellow triangle, you can see on the chart
I think Gold move up to 3450 $ and if we have no positive news, it will drop to the down side. This analysis has good benefit and Risk rewards ratio is 3
On the other hand if Gold break the 3320 $ my analysis is faild and must listen to the economic news
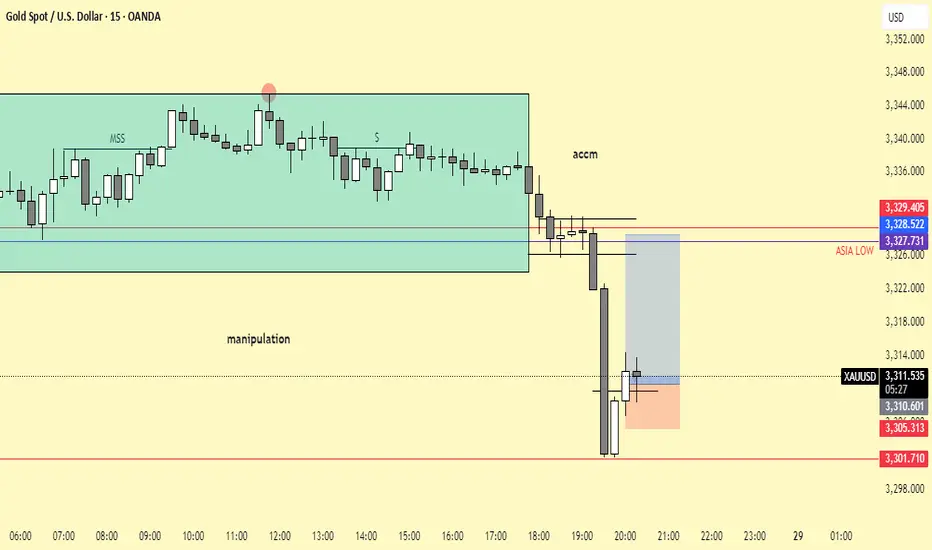
XAU / USD 4 Hour ChartHello traders. Taking a look at the 4 hour chart, I have marked my areas of interest as we are part way through the overnight sessions or so. Let's see if we for support and push back up, or do we keep pusing down today? Patience is key. I will post when the Pre NY volume starts to come in about 4 hours or so from now. Be well and trade the trend, Big G gets a shout out.

BuyRejection Level
Daily Volume
Market Structure Shift
London Session
Trend Line Break
Untapped Order Point
XAUUSDHello Traders! 👋
What are your thoughts on GOLD?
Gold has broken above its descending trendline and completed a successful pullback to the breakout level. Now, the price appears ready to resume its upward move, but it's still facing resistance near the $3375 level.
We expect another attempt to break through the $3375 resistance zone.
A confirmed breakout above this area would open the path toward higher targets and potentially trigger strong bullish momentum.
As long as price holds above the broken trendline and key support zone, the overall bias remains bullish.
Don’t forget to like and share your thoughts in the comments! ❤️

gold 4hour say: put sellstop in lowpersonaly i predict mini crash on gold and waiting for it , now we have powerfull 3angel pattern we must put sellstop in last low , buystop on last high
sellstop stoploss = last high
if sellstop open like new traders , dont close it soon , wait minimum 2 week ,understand?
ALERT= if gold can break last high , it can start new up trend, wave , so if you have old sells ,you must put SL or hedge buystop in last low
if sell
wishhhhhhhhhhhhhh youuuuuuuuuuuuuuuu win

XAUAUSD ideaWe are waiting for our asset to reach our action zone, and based on the reaction, we’ll decide on our next moves.ALWAYS WAIT FOR A CONFIRMATION TO SEE IF THE PRICE VALIDATES THE ZONE.and you what is your vision of the EURUSD its interests me! i wait you in the commentary

Gold: holding flat grounds Gold was traded relatively flat during the previous week, moving within a range of $3.370 and $3.313. The safe-haven asset was holding relatively steady on eased geopolitical and economic tensions. The US Dollar gained a bit last week on better than expected inflation and jobs data posted during the week. Analysts are in agreement that current concerns related to the U.S. debt growth and further trade tariffs updates will certainly support the price of gold in the near future period.
The RSI was holding relatively steady modestly above the level of 50. This indicates that investors are still not ready to take the move toward the oversold market side. The MA50 modestly slowed down its divergence from MA200, however, two lines are still holding a higher distance between them, in which sense, cross is certainly not in store for some time in the future.
Charts are indicating that the price of gold continues to be well supported around current levels. There is some potential for a small move toward the down side, till the levels around $3.310. Also, the $3.3K support line might be tested. On the opposite side, any news related to geopolitical or economic tensions might swiftly push the safe-haven asset toward the upside, at least till the level of $3.370.

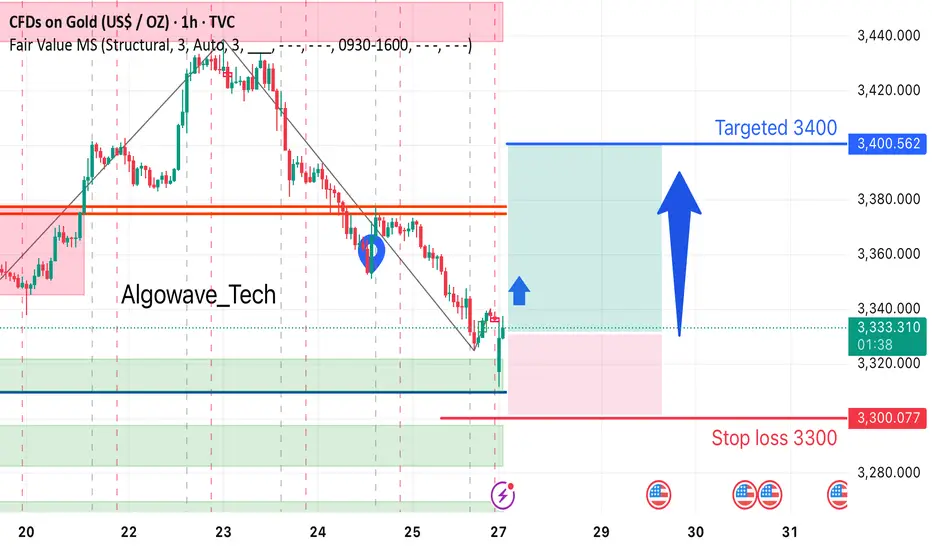
Gold Long Setup Alert!After a clean bounce from a strong demand zone, gold is showing potential for a bullish reversal.
🔹 Entry: Around 3331
🎯 Target: 3400
🛑 Stop Loss: 3300
Price has broken the bearish trendline, indicating possible momentum shift. Eyes on a push towards 3400 if bullish pressure sustains!
#GoldTrading #XAUUSD #AlgoWave_Tech #TechnicalAnalysis #BullishSetup #PriceAction #TradingSignals#Jasonwave_Fx1
Gold – Bear-to-Bull Transition in Motion?🧠 MJTrading:
TVC:GOLD – 8H Chart: Bulls, It’s Your Move.
📸 Viewing Tip:
🛠️ Some layout elements may shift depending on your screen size.
🔗 View the fixed high-resolution chart here:
The impulsive move from 3000 to 3500 wasn’t just a trend — it was a statement of strength.
That rally carved the ATH, then left behind weeks of digestion and structural compression.
Now, the market may be setting up for its next decision.
Notice how each bearish leg has been shrinking — a classic behavioral signal that sellers are losing momentum — possibly a shift in control underway.
We’re also pressing above the downtrend line from the ATH (3500), while the uptrend from 3000 remains clean and respected.
We’re now testing the 3400 zone — a key battleground.
📍 If bulls want to reclaim the momentum and show dominance, this is the moment to act.
🔹 1st Support: 3363–3377
🔹 2nd Support: Rising trendline
🎯 Target Zone: 3455–3500+ (Liquidity Pool & ATH proximity)
⚠️ Break back inside the triangle could delay the breakout narrative.
⚠️ If momentum fails to increase from here, and bulls can’t break out with conviction, the market is likely to remain range-bound for longer — extending the sideways phase between 3250–3500.
💭 If you’re watching for a new ATH… stay sharp, stay structured — the market rewards patience and readiness.
“If the structure speaks to you, let it echo, boost it.”
📐 MJTrading 🚀
What do you think?
#GoldAnalysis #XAUUSD #MarketStructure #LiquiditySweep #AnythingCanHappen
#MJTrading
#ChartDesigner
Psychology Always Matters:
Click on them for the caption...

Gold’s Precision Drop: Wave 5 Ignites the Bullish Reversal
---
### 🚀 **Golden Opportunity Ahead: Wave 5 Bullish Breakout Incoming!**
After perfectly completing the **bearish Gartley pattern**, gold dropped precisely to the **target zone at 3,323**, just as predicted. This move confirmed the formation of **Wave 5**, signaling the end of the corrective phase.
Now, all signs point to a **strong bullish reversal**—and the next step is a powerful rally toward the predefined targets. This is a **prime buying opportunity** for traders looking to ride the wave!
### 🎯 **Buy Zone:**
- **Entry:** Around **3,323 USD**
### 📈 **Profit Targets:**
| Target | Fibonacci Level | Price (USD) |
|--------|------------------|-------------|
| TP1 | 1.0 | 13,447.875 |
| TP2 | 1.27 | 13,536.025 |
| TP3 | 1.618 | 13,649.640 |
The link of. The previous analysis is below in the comment
---

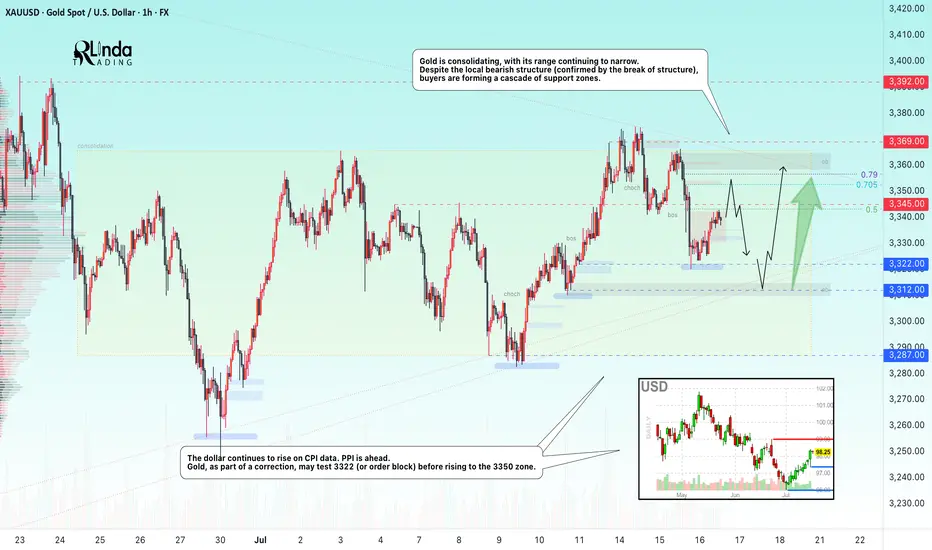
GOLD → Borders are shrinking. Consolidation continues...FX:XAUUSD is adjusting amid controversial CPI data and confirming the local bearish market structure. The PPI is ahead, and gold is consolidating, with its boundaries continuing to narrow...
Gold is recovering slightly but remains under pressure amid rising bond yields and a stronger US dollar. Higher inflation in the US reduces the chances of a quick Fed rate cut. Traders are cautious ahead of the PPI data release. If producer inflation exceeds forecasts, the dollar may rise again, putting further pressure on gold
Technically, we see consolidation in a symmetrical triangle pattern. Trading within the consolidation has a negative side - low volatility and unpredictable movements. The purpose of such movements is accumulation. However, decisions can be made based on relatively strong levels. In the current situation, we are seeing a rebound from 0.5 Fibonacci (I do not rule out a retest of the 0.7 zone before correction). The price may head towards the liquidity zone of 3322 before rising to the upper boundary of the consolidation and the zone of interest of 3350-3360.
Resistance levels: 3345, 3353, 3369
Support levels: 3322, 3312, 3287
The problem is that the price is in a consolidation phase. That is, technically, it is standing still and moving between local levels. You can trade relative to the indicated levels. Focus on PPI data. At the moment, gold is in the middle of a triangle and is likely to continue trading within the boundaries of a narrowing channel due to uncertainty...
Best regards, R. Linda!
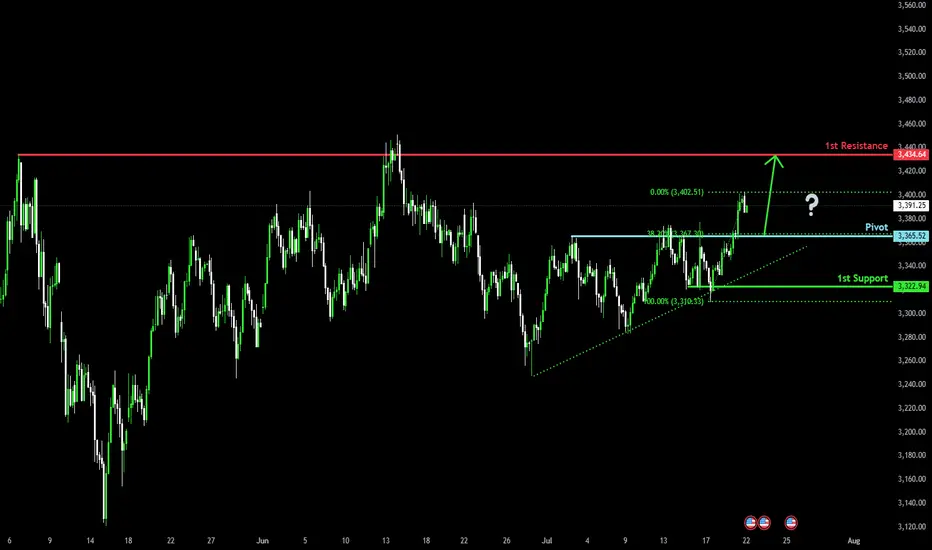
Falling towards pullback support?The Gold (XAU/USD) is falling towards the pivot which has been identified as a pullback support and could bounce to the 1st resistance.
Pivot: 3,365.52
1st Support: 3,322.94
1st Resistance: 3,434.64
Risk Warning:
Trading Forex and CFDs carries a high level of risk to your capital and you should only trade with money you can afford to lose. Trading Forex and CFDs may not be suitable for all investors, so please ensure that you fully understand the risks involved and seek independent advice if necessary.
Disclaimer:
The above opinions given constitute general market commentary, and do not constitute the opinion or advice of IC Markets or any form of personal or investment advice.
Any opinions, news, research, analyses, prices, other information, or links to third-party sites contained on this website are provided on an "as-is" basis, are intended only to be informative, is not an advice nor a recommendation, nor research, or a record of our trading prices, or an offer of, or solicitation for a transaction in any financial instrument and thus should not be treated as such. The information provided does not involve any specific investment objectives, financial situation and needs of any specific person who may receive it. Please be aware, that past performance is not a reliable indicator of future performance and/or results. Past Performance or Forward-looking scenarios based upon the reasonable beliefs of the third-party provider are not a guarantee of future performance. Actual results may differ materially from those anticipated in forward-looking or past performance statements. IC Markets makes no representation or warranty and assumes no liability as to the accuracy or completeness of the information provided, nor any loss arising from any investment based on a recommendation, forecast or any information supplied by any third-party.
XAUUSD – 4H Short Setup AnalysisGold (XAUUSD) has broken below the dynamic support zone of the Keltner Channel structure and is currently trading beneath the 200 EMA zone, signaling bearish momentum. Price has rejected the upper resistance band near 3385, forming a lower high and triggering a short entry at the 38.2% Fibonacci retracement zone.
📉 Trade Idea (Short Bias)
Entry: Around 3360
TP1: 3317 (key support zone)
TP2: 3275 (38.2% Fib ext)
TP3: 3208 (100% extension target)
SL: 3385 (61.8% Fib retracement)
Confluences:
Price rejection from upper channel
200 EMA trend resistance
Clean bearish structure with momentum confirmation
Fib confluence adds precision to entry and target levels
If momentum sustains below 3360, further downside is likely toward the 3200 zone.
