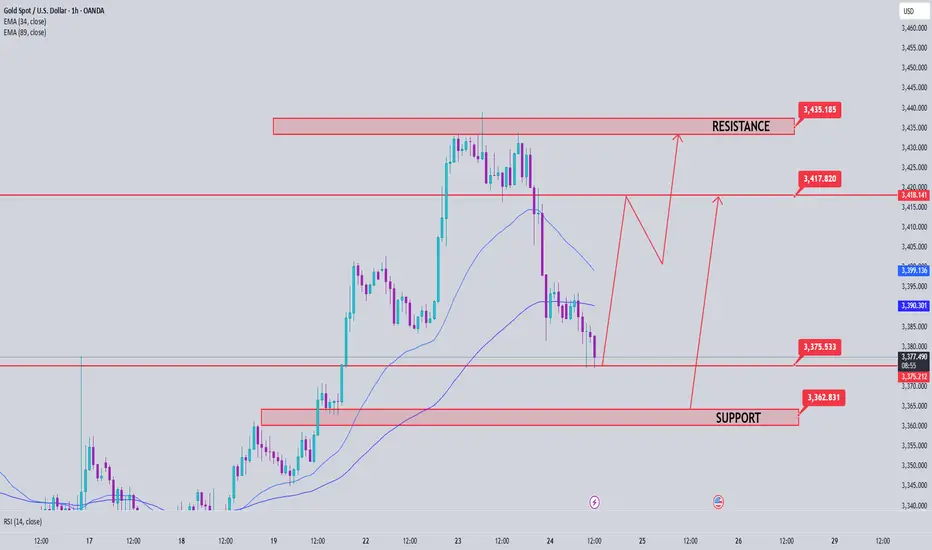
Current Gold Short tradeI'm currently trading gold short from 3430. I have taken partials and my SL are at BE.
Here we have 2 scenarios at Support.
Heavy volume selloff means there’s fuel for more downside.
If price consolidates here and keeps making lower highs, or retests 3,376 from below and rejects, that’s a short re-entry/continuation signal.
Odds:
Much higher at the moment. The last impulse was violent, and buyers have not stepped up yet.
If 3,372 breaks—look to short the retest (classic SR flip) for a move to 3,348 and below.
If you see a slow grind sideways (chop), walk away and wait for the breakout from this zone.
3,376–3,372 Do not long unless reversal candle forms High risk to knife-catch
<3,372 Look for shorts on retest Downside opens up fast
3,389+ Bullish confirmation only Only chase if true reversal
XAUUSDK trade ideas

XAUUSD: Market analysis and strategy on July 22.Gold technical analysis
Daily chart resistance level 3450, support level 3330
Four-hour chart resistance level 3420, support level 3375
One-hour chart resistance level 3402, support level 3375.
Gold rose sharply on Monday, fluctuated upward in the Asian session, and the NY market accelerated its rise, with the daily line rising sharply to 3400. The fundamentals of the bull market have not changed, and this time it is believed that the factor that triggered the unilateral rise is the expectation of the Fed's interest rate cut. Yesterday I mentioned that the 1-hour bottom structure appeared, and a new bullish opportunity appeared again!
Yesterday's idea was very clear. The Asian session stepped back to confirm the top and bottom conversion support level of 3344, and finally the NY market rose sharply, directly breaking through the key position of 3377.
Gold price stood firm at 3360, preparing to break through the key position of 3377 and then accelerate its rise. Yesterday's increase broke through the highest level in the past month. After all, the strength after the breakout after such a long period of volatility will not be small. In the previous few trading days, it returned to the previous high to complete the conversion of top and bottom. Today, pay attention to the support of the top and bottom conversion position of 3377. If it falls back during the day, you can continue to buy on dips based on the support of 3375. The bulls are accumulating momentum to break through the suppression of the 3400 mark. If it stands firm at 3400 after the breakthrough, it will be a large-scale increase.
In terms of intraday operations, buy more near 3377/75 after the retracement.
Buy: 3375 near
Buy: 3402near

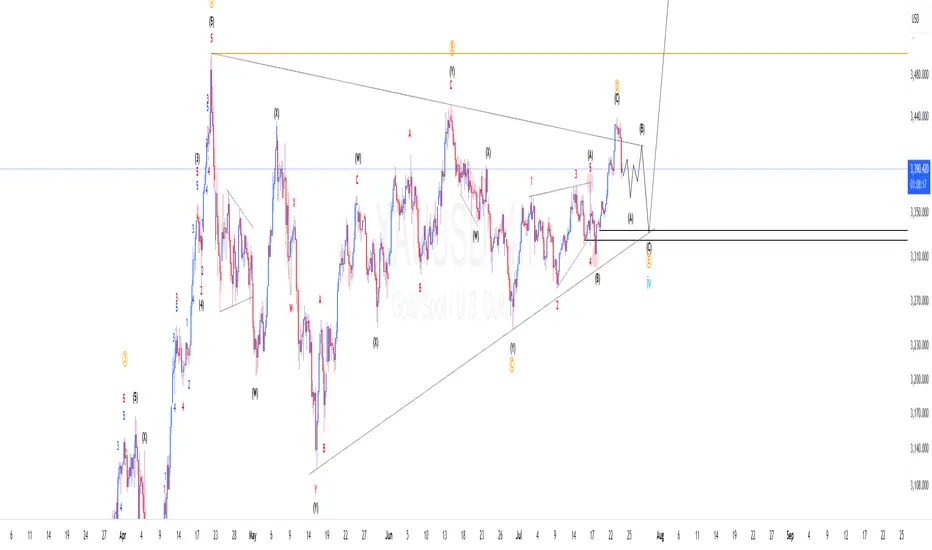
XAUUSD Elliotwaves updateWe are yet to complete wave 4. So far the structures supports the triangle correction and price completed wave "d" and started final wave "e". If we are correct we should expect price make another 3 waves down to complete wave 4 and then resume the bullish momentum. To take advantage of the overall trend one should find areas where price has high probability of finding support to take the trade.

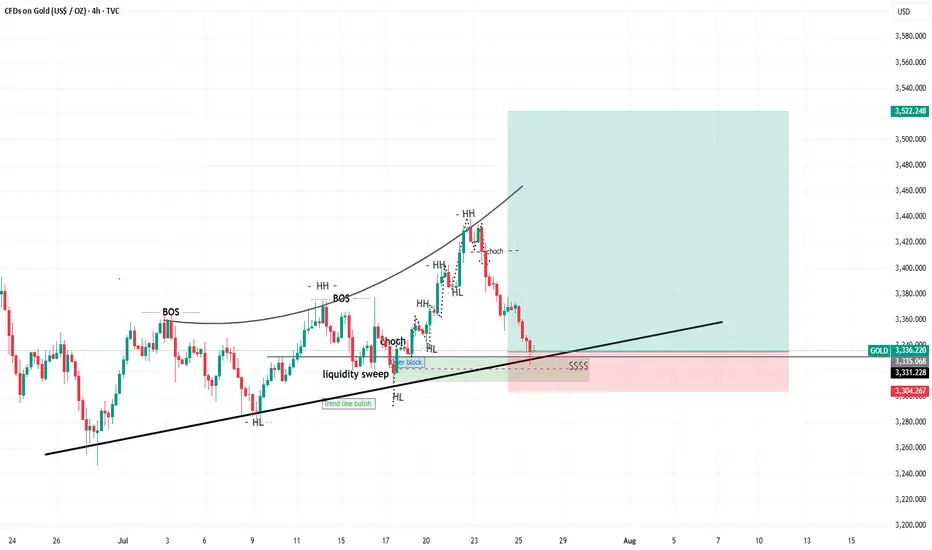
xauusd i think buy from here its not a bad ideatrend lines oder block fvg liquidity sweep choch higher high higher low.
Gold Next Bullish Move.As we see the bullishness in Gold Market, so I am here to share with you the idea to capture the expected bullish move.
1) On Daily TF, market has taken out FVG as well as mitigated the OB.
2) On 4-Hour TF, market has taken out previously unmitigated FVG and sweeped and closed above the recent recent 4 Hour Candle low.
3) Market has given a CHoCH on 15 mins with a significant FVG, which I expect market to fill it.
So, with all above analysis I expect market to go bullish after filling FVG.
I hope to see your comments regarding my analysis and hope to see some of your ideas.
Thank You.

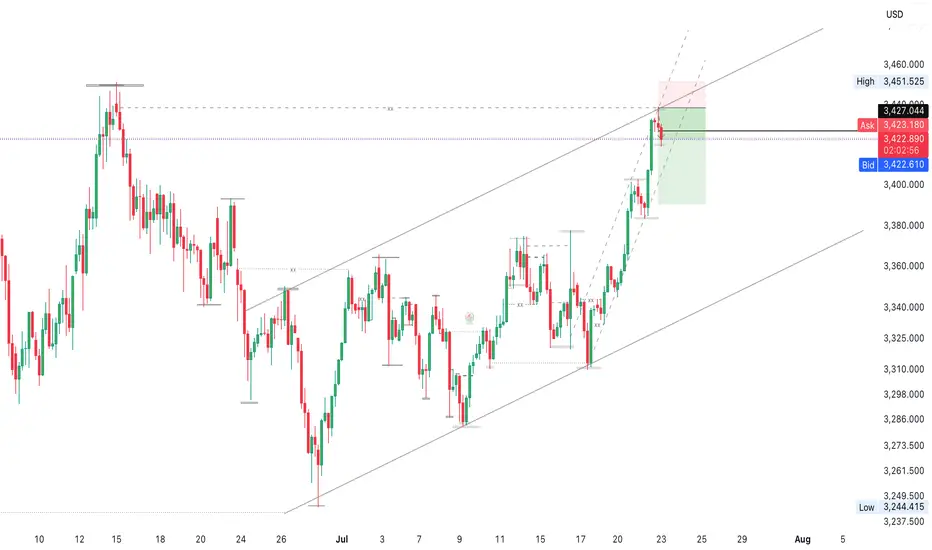
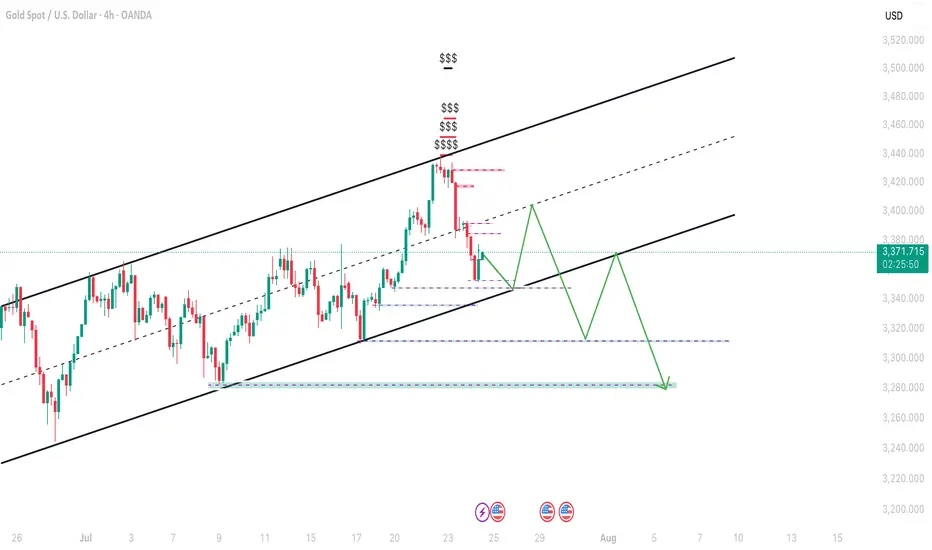
Gold Market Completes Bullish Wedge at 3439Gold market lures to 3439, completing the bullish wedge formation as anticipated.
A retracement is now setting in, with price action expected to sweep through 3391—a key zone that may determine the next leg of the trend.
Watch closely for confirmation at this level for a potential bullish continuation or deeper correction. follow for more insight , comment and boost idea
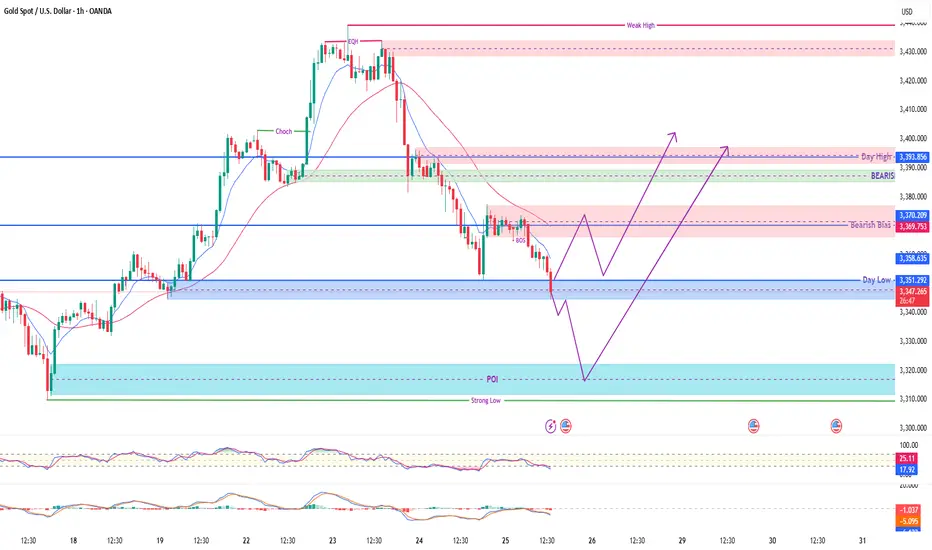
GOLD SPOT STRUCTURAL OUTLOOK & TRADE PLANCurrent Market Overview:
Gold is currently trading around 3345, sitting just above a strong intraday pivot point and previous Day Low support. Price recently experienced a Break of Structure (BOS) confirming bearish pressure from the higher OB (Order Block) and rejection near the bearish breaker zone.
📍 Key Levels to Watch:
🔴 Bearish OB (Resistance): 3369 – 3370
🟣 Bearish Breaker Zone: ~3380
🔵 Day High OB (Major Supply): 3393 – 3395
🟢 POI / Strong Low: 3310 – 3320 (Reversal Zone)
🔵 Day Low & Pivot: 3351 – 3345 (Short-Term Support)
📈 Possible Scenarios:
Scenario A – Bounce from Pivot (Aggressive Entry):
If price respects the pivot at 3345–3351, we may see a short-term bullish reversal toward 3369–3370, with extended targets at the Day High OB.
Scenario B – Deeper Sweep & Bullish Reversal:
A liquidity sweep below 3340 into the POI zone (3310–3320) may offer a premium long opportunity targeting 3370 → 3395.
⚠️ Bias:
🔻 Short-Term Bearish below 3370
🔼 Potential Bullish Reversal from 3320–3350 zones
✅ Technical Confluence:
✅ BOS confirms supply control
✅ POI aligned with historical reaction zones
✅ RSI and MACD showing signs of divergence – early reversal signals
✅ Multiple OBs mapped out for precision entries
🎯 Trade Setup Example (Scenario B):
Buy Limit: 3318
SL: 3305 (Below Strong Low)
TP1: 3370
TP2: 3393 (Day High OB)
Risk-Reward: ~1:4+
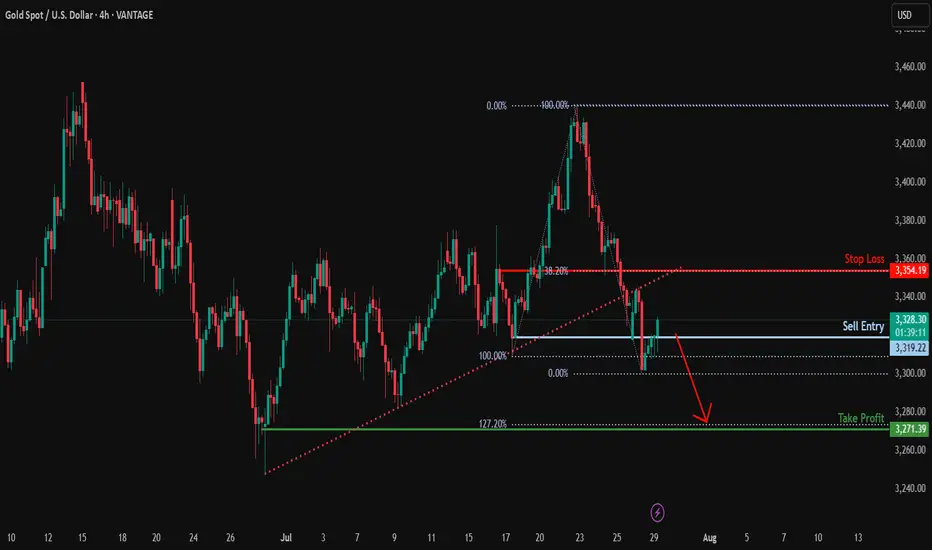
XAUUSD-Bearish reversal?XAU/USD is rising towards the resistance level, which serves as a pullback resistance and could drop from this level to our take-profit target.
Entry: 3,319.22
Why we like it:
There is a pullback resistance.
Stop loss: 3,354.19
Why we like it:
There is a pullback resistance that aligns with the 38.2% Fibonacci retracement.
Take profit: 3,271.39
Why we like it:
There is a swing low support that lines up with the 127.2% Fibonacci extension.
Market Structure is Not Strategy — It’s Your Starting Point“The chart doesn’t hide anything. But your mind does.”
Before any indicator, setup, or signal… comes structure.
🔍 What is Market Structure?
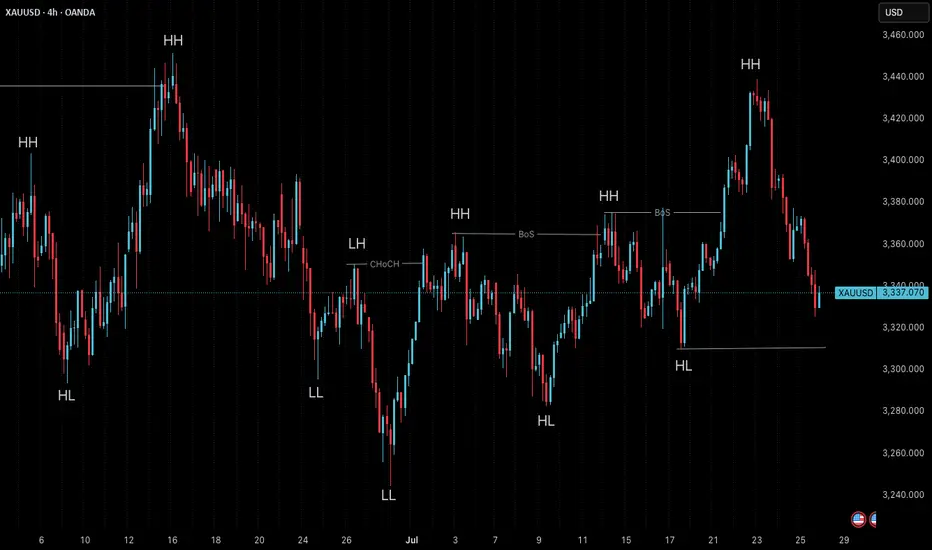
At its core, market structure is the sequence of higher highs (HH) and higher lows (HL) in an uptrend, or lower lows (LL) and lower highs (LH) in a downtrend.
It is the skeleton of price .
Everything else — entries, zones, signals — is just clothing.
If you can’t see the skeleton, you’re reacting to noise.
🎯 Why It Matters:
It’s not a signal. It’s context .
It tells you whether you’re trading with the market or against it .
It defines where your patience begins — not where your entry is.
Market structure helps you let go of the urge to chase. It brings order to the chaos.
🧩 Key Components to Track:
Break of Structure (BoS): Confirms trend continuation
Change of Character (ChoCH): Signals a potential reversal
Swing Points: Define the intent behind price moves
Liquidity Sweeps: Often mask real structure beneath short-term traps
🛑 Common Mistake:
Most traders jump straight to the setup without asking the most important question:
“Where am I in the structure?”
They try to buy a pullback — in a downtrend.
They try to fade a move — right before continuation.
They chase candles — instead of waiting for alignment.
That’s not strategy. That’s stress.
🛠 Tip to Practice:
Use this simple framework to build clarity:
Start from the H4 chart — this gives you the broader directional bias
Drop to M15 — here’s where structure begins to form tradeable setups
Finally zoom into M1 — this is where confirmation happens before entry
Ask yourself:
Where did the last BoS or ChoCH happen on each timeframe?
Is M15 aligning with H4 intent — or contradicting it?
Did you enter after M1 confirmation , or based on impulse?
You don’t need to predict price. You need to align with it.
🪞 Final Thought:
Structure isn’t strategy.
It’s the mirror that shows what’s real before your bias speaks.
When you master structure, you stop forcing trades — and start flowing with them.
💬 Want more like this?
If this post resonated with you — drop a comment below.
Let me know what you'd like to dive deeper into — price action, gold setups, market structure, or the psychology behind your trades.
I’ll build future tutorials based on what matters to you.
📘 Shared by @ChartIsMirror
Gold. Trade Swing buy setup 25/July/25XAUUSD "erased" all its early weekly gain by having deep pullback until its weekly pivot and channel support confluence zone again..

GOLD - WAVE 5 BULLISH TO $3,734 (UPDATE)Just because our 'sell trade' is running in deep profits, does not mean we completely rule out the possibility of any alternative trades.
As long as Gold remains above Wave 2 high ($3,245), this Gold bullish bias remains an option. As traders we always have to be prepared to adapt to different market conditions.

XAU/USD(20250723) Today's AnalysisMarket news:
White House officials plan to visit the Federal Reserve headquarters on Thursday local time.
Technical analysis:
Today's buying and selling boundaries:
3416.02
Support and resistance levels:
3465.76
3447.17
3435.12
3396.94
3384.89
3360.33
Trading strategy:
If the price breaks through 3435.12, consider buying, the first target price is 3447.17
If the price breaks through 3416.02, consider selling, the first target price is 3396.94

XAUUSD Technical Analysis – Strong Bullish Move Expected XAUUSD Technical Analysis – Strong Bullish Move Expected from Support Zone
Date: July 29, 2025
Chart Type: Price Action | Smart Money Concept (SMC) | Volume Profile
🧠 Educational Breakdown:
1. Strong Support Zone (Demand Area):
Price has entered a clearly marked strong support zone around $3,270 - $3,292.
This zone has previously acted as a major demand level, where buyers stepped in to reverse bearish pressure.
High volume node from the Volume Profile on the left confirms significant historical interest in this price region.
2. BOS – Break of Structure:
Multiple Break of Structures (BOS) throughout the uptrend confirm bullish market intent.
The recent decline appears corrective, not impulsive, suggesting a potential bullish continuation.
3. Bullish Fair Value Gap (FVG):
A Bullish FVG is visible just above current price, acting as a magnet for price action.
This imbalance is often targeted before further market movement, supporting the idea of an upcoming bullish move.
4. Liquidity Grab Setup:
Price dipped into the support area likely to sweep liquidity (stop losses) before a reversal.
This is a common Smart Money trap, where institutional players grab liquidity before moving the market in the intended direction.
5. Target Zone:
A clear target is set around $3,418, aligning with previous highs and potential Buy-Side Liquidity.
The projected move represents a clean higher high, following the higher low formed at the support zone.
Confirmation: Wait for bullish engulfing or displacement candle on lower timeframe (M15-H1).
Volume Support: Look for rising volume during the reversal to confirm smart money participation.
📘 Conclusion:
Gold (XAUUSD) is showing a textbook bullish reversal setup from a high-demand zone. With strong structural support, fair value gap targeting, and buy-side liquidity above, the setup favors bullish continuation toward $3,418.


Gold in Correction modeAs you can see in the analysis now gold is in correction mode and according to CRT also gold have to tap 3277 so be ready for 3277 by anytime as trade tentions are also cooling down which lead to dollar go up and gold go down.
Gold Price Analysis July 24After a correction of about 50 prices in yesterday's session, gold is showing a necessary "breathing" in the long-term uptrend. This is a positive signal, showing that the market is accumulating before continuing its journey towards a new ATH around the 3500 area.
Currently, gold prices are fluctuating within the boundary zone limited by two upper/lower trendlines - creating a clear structure of support and resistance. Avoid trading against the trend if this boundary zone is broken.
📌 Trading plan:
Strategy: Prioritize BUY when price sweeps to support zone
Active buy zone: 3375 (reaction price)
Potential buy zone: 3363 (deep support)
Target: 3431 in the immediate future → further towards 3490
Support: 3375 – 3363
Resistance: 3418 – 3431 – 3490
#GOLD Will Keep Growing!
HI,Traders !
#GOLD keep trading in An uptrend
along the rising support So as the gold
is approaching A the support we will be
Expecting a bullish rebound !
Comment and subscribe to help us grow !

maintain selling pressure around 3300, GOLD ⭐️GOLDEN INFORMATION:
Gold prices extended their slide for a fourth straight session, falling over 0.60%, as the U.S. and European Union reached a weekend trade agreement that halved proposed tariffs on EU goods—from 30% to 15%. XAU/USD is currently trading around $3,312, after earlier touching a high of $3,345.
The trade breakthrough lifted market sentiment, boosting risk appetite. Meanwhile, the U.S. Dollar is regaining strength, with the Dollar Index (DXY)—which measures the greenback against a basket of six major currencies—rising 0.99% to 98.64.
⭐️Personal comments NOVA:
Gold price maintains selling pressure around 3300, continuing the downtrend
⭐️SET UP GOLD PRICE:
🔥SELL GOLD zone: 3353- 3355 SL 3360
TP1: $3345
TP2: $3332
TP3: $3317
🔥BUY GOLD zone: $3287-$3285 SL $3280
TP1: $3295
TP2: $3307
TP3: $3320
⭐️Technical analysis:
Based on technical indicators EMA 34, EMA89 and support resistance areas to set up a reasonable SELL order.
⭐️NOTE:
Note: Nova wishes traders to manage their capital well
- take the number of lots that match your capital
- Takeprofit equal to 4-6% of capital account
- Stoplose equal to 2-3% of capital account

XAUUSD position takenI have taken a trade in XAUUSD at 3340 ( Target : 3700, SL : 3296).
Why I have taken this trade ?
It has made an ascending triangle pattern .
It is near its support line.
If you build a fixed range volume profile you will find that
it is at Point Of Control.

XAU/USD /IDEAGold continues its second consecutive aggressive bullish move, but the structure is beginning to show signs of a potential correction.
During this rally, highs and liquidity were taken,
and previously unfilled FVG zones from about a month ago have now been filled.
I'm watching for a possible correction toward the discount zone around 3360, where the following are located:
– A daily FVG
– A 4H FVG
– 1H Equal Lows, with clear liquidity resting below
If price sweeps the liquidity below these equal lows and reacts around 3360, I will anticipate a continuation of the bullish trend.
However, if a solid setup forms before that, I may enter a short position targeting 3360, where I’ll be looking to close the trade and potentially position for a reversal.
No entry yet – watching closely and waiting for price confirmation.

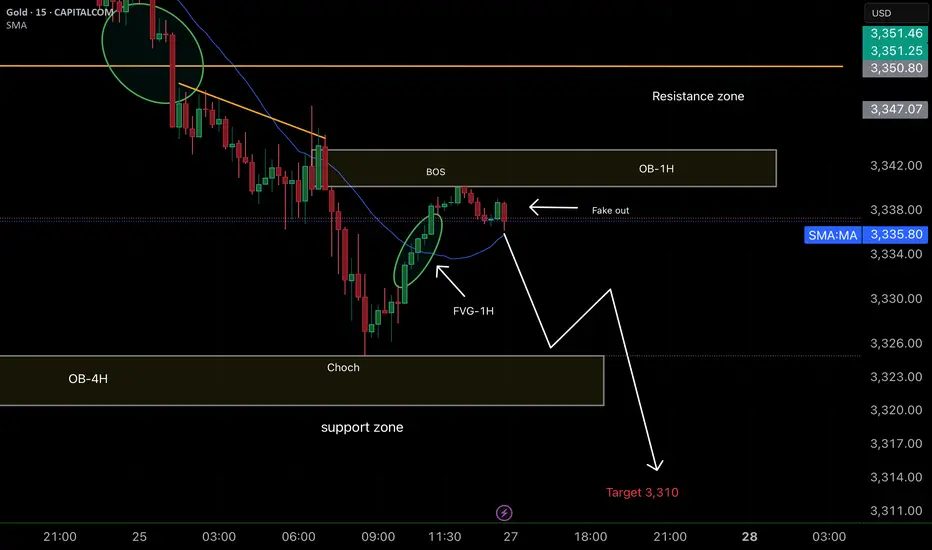
Smart Money concepts (SMC) Positive points of the analysis:
1. Clarity in the market structure (CHoCH + BOS):
It is clear that the market made a CHoCH and then confirmed it with a Break of Structure (BOS), which validates the downward trend change.
2. Well-identified fake out:
The "fake out" just after the BOS and within the 1H-OB is typical institutional behavior. This bullish wick is a trap to induce liquidity before the fall. Excellent reading.
3. Confluence zone (1H-OB + 1H-FVG):
The price rises to mitigate the 1H-FVG within the 1H-OB, providing a very good entry opportunity.
Furthermore, this occurs within the resistance zone, which gives it even more weight.
4. Support zone and target at 3310:
The TP is very well projected at 3310, just below the current support zone. If it breaks that zone, it is highly likely that it will reach the target.