GOLD - WAVE 5 BULLISH TO $3,734 (UPDATE)Quick & simple ‘Elliott Wave Theory’ analysis for our Gold ALTERNATIVE SCENARIO.
⭕️Complex 5 Sub-Wave Correction.
⭕️Buyers Remain Above $3,245.
⭕️Pending LQ at $3,500.
XAUUSDK trade ideas

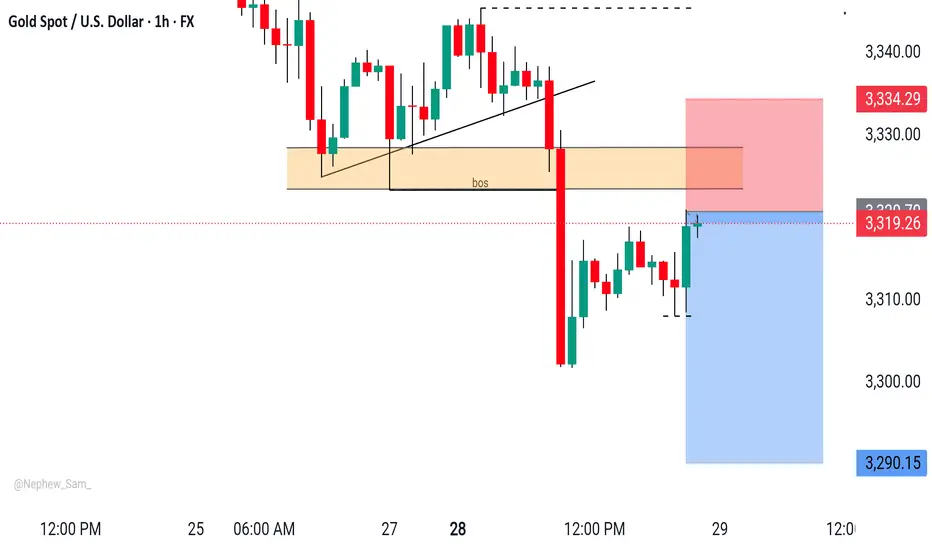
XAUUSD H1 Outlook XAUUSD - Smart Money in Play
Perfect CHoCH & BOS confirmation.
Price tapped into the supply zone — now rejecting hard.
Entry aligned.
Target: 3,290 ✅
Let it melt. 🧊📉
Gold protracted consolidation The Gold remains in a bullish trend, with recent price action showing signs of a continuation breakout within the broader uptrend.
Support Zone: 3308 – a key level from previous consolidation. Price is currently testing or approaching this level.
A bullish rebound from 3308 would confirm ongoing upside momentum, with potential targets at:
3387 – initial resistance
3400 – psychological and structural level
3435 – extended resistance on the longer-term chart
Bearish Scenario:
A confirmed break and daily close below 3308 would weaken the bullish outlook and suggest deeper downside risk toward:
3290 – minor support
3268 – stronger support and potential demand zone
Outlook:
Bullish bias remains intact while the Gold holds above 3308. A sustained break below this level could shift momentum to the downside in the short term.
This communication is for informational purposes only and should not be viewed as any form of recommendation as to a particular course of action or as investment advice. It is not intended as an offer or solicitation for the purchase or sale of any financial instrument or as an official confirmation of any transaction. Opinions, estimates and assumptions expressed herein are made as of the date of this communication and are subject to change without notice. This communication has been prepared based upon information, including market prices, data and other information, believed to be reliable; however, Trade Nation does not warrant its completeness or accuracy. All market prices and market data contained in or attached to this communication are indicative and subject to change without notice.

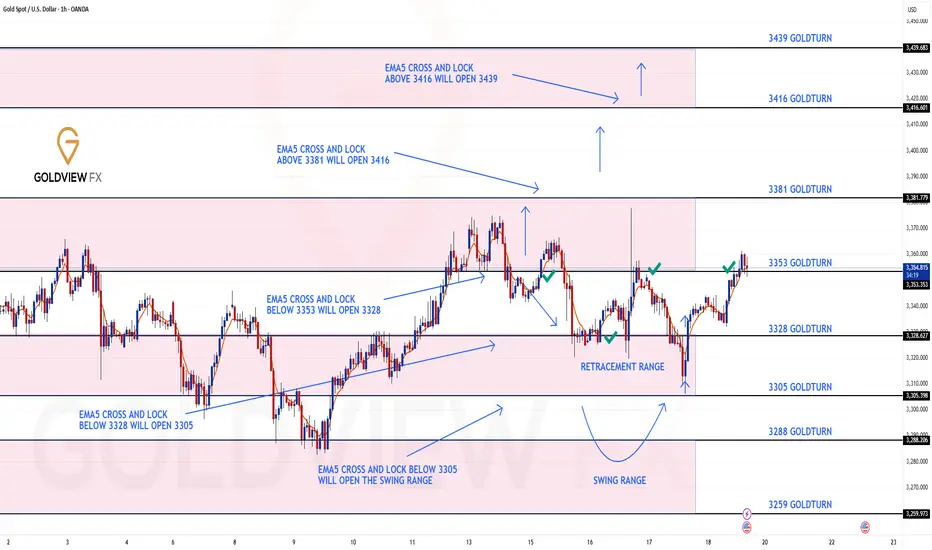
GOLD ROUTE MAP UPDATEHey Everyone,
End of week update following up on yesterday’s 1H chart outlook.
✅ 3353 was hit and respected to the pip, just as we mapped out and highlighted yesterday.
We saw the EMA5 cross and lock above 3328, confirming continuation.
The market respected structure beautifully
Rejections gave us clean dip buying entries
EMA5 methodology guided our execution
High probability Goldturn levels played out exactly as planned
Our discipline and patience were rewarded, yet again. Another strong end to the week.
We will now come back Sunday with a full multi timeframe analysis to prepare for next week’s setups, including updated views on the higher timeframes, EMA alignments, and structure expectations going forward.
Thanks again for all your likes, comments, and follows.
Wishing you all a fantastic weekend!!
Mr Gold
GoldViewFX
NordKern - XAUUSD InsightNordKern | Simplified Insight OANDA:XAUUSD – Short Opportunity Ahead
Gold is now near our important level at 3370, offering a shorting opportunity considering recent events and technical action.
Gold Price Decline – What's Behind It?
In the last two sessions (July 23–24), gold has retreated strongly owing to a set of global as well as market-specific circumstances:
1. Trade Deal Optimism
Advances in U.S.–Japan and U.S.–EU trade discussions lessened worldwide uncertainty, decreasing demand for gold as a safe-haven.
2. Higher U.S. Yields
Higher Treasury yields are rendering non-yielding assets such as gold less appealing, adding to downward pressure.
3. Technical & Profit-Taking
Following a recent rally, gold was exposed to selling. Stop-loss and profit-taking triggers hastened the fall.
Summary of Key Drivers
U.S. Trade Deals: Reduced geopolitical risk
Higher Treasury Yields: Decreased gold's relative attractiveness
Technical Selling: Enhanced the downward trend
Trade Setup – Bearish Bias
Entry : 3374.4
Stop Loss : 3387.3
Take Profit : 3345.4
Extended Target : 3322
Key Notes:
- Trade Deal Optimism: U.S.–Japan and U.S.–EU agreements eased global tensions, reducing demand for gold as a safe-haven asset.
- Yield Pressure: Rising U.S. Treasury yields made gold less attractive compared to interest-bearing alternatives.
- Technical Selling: Profit-taking and stop-loss triggers accelerated the decline after gold’s recent rally.
This setup remains tactically driven. Manage risk carefully and monitor for any renewed political shifts.
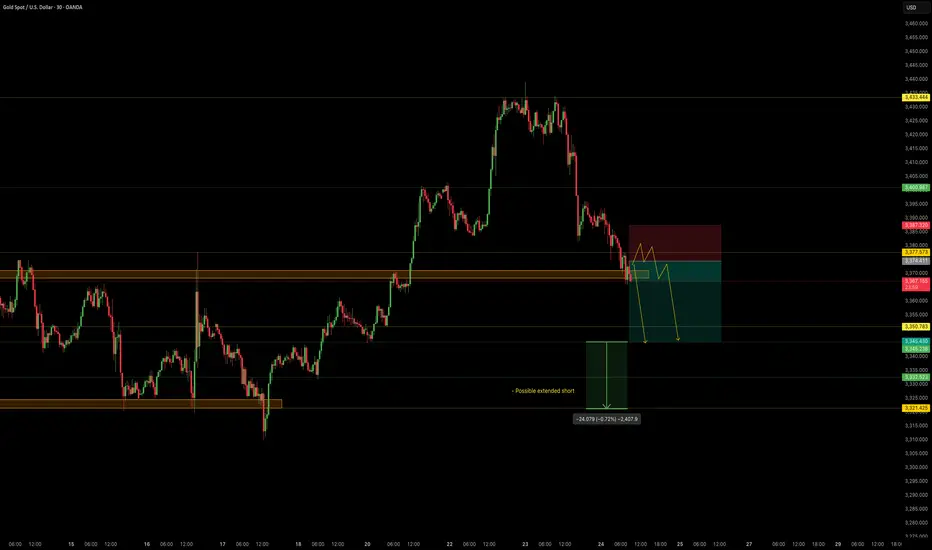
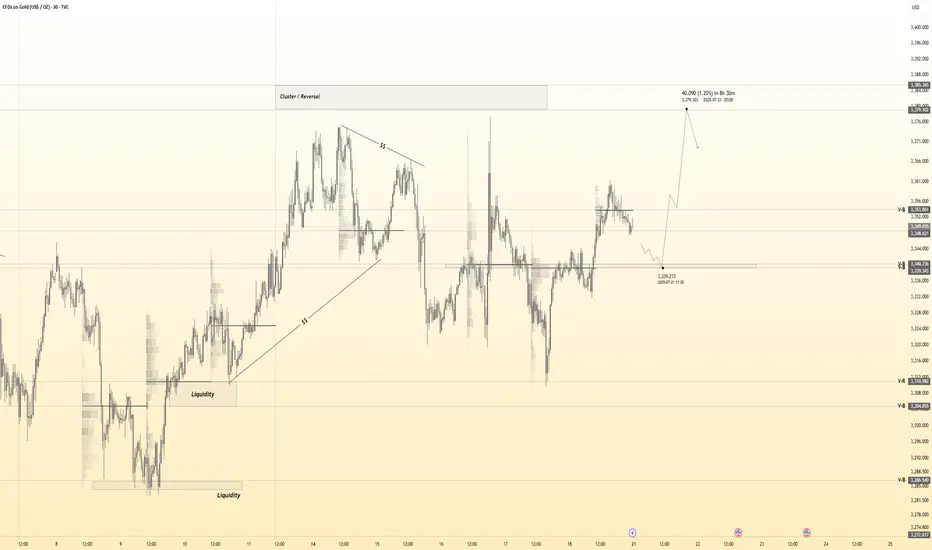
SWING TRADE OPPORTUNITY 〉LONGAs illustrated, I try to visualize what the next bullish impulse could look like if price holds 3300 as a key psychological and algorithmic price level.
Illustrated are the potential buy areas (a current one and an extended one in case a pullback occurs to manipulate lower levels in the next 24-48 hours).
This projection, if valid, could hold from now until next week, so it can be considered a swing trade to hold at least the next week and into the following one).
--
After this post, I will upload another analysis on the Daily timeframe projecting the longer term move, so make sure to go in my profile to check it out.
GOOD LUCK

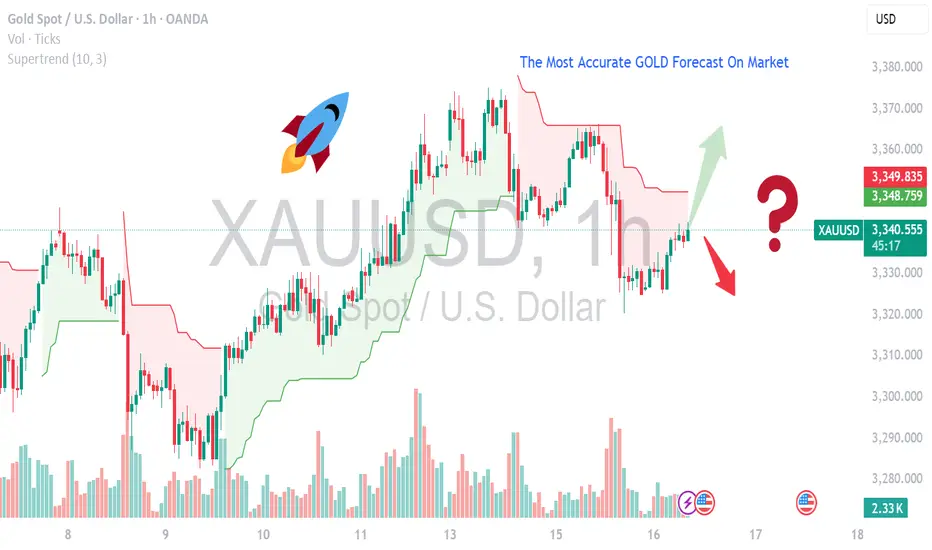
MOST ACCURATE XAUUSD GOLD FORECAST ANALYSIS MARKETCurrent Setup & Technical Outlook
Consolidation & Pennant Formation: Gold is building a bullish pennant and trading above its 50‑day MA — a classic continuation pattern suggesting a breakout toward new highs if momentum resumes .
Key Levels:
Support: $3,330–3,340 — confirmed by multiple technical sources .
Resistance/Breakout Zone: $3,360–3,375 — clearing this could trigger a rally toward $3,400+ .
Upside Targets: $3,390, then possibly $3,500–$3,535 per weekly forecast .
Alternate Bearish Scenario: A failure around the 0.618 Fibonacci resistance (~$3,374) and overbought RSI could spark a pullback to $3,356 or lower .
---
🧠 Fundamental Drivers
Inflation & U.S. Macro Data: Market awaits June CPI/PPI and Fed commentary — cooler inflation could boost gold via dovish expectations, while hotter data may strengthen the USD and weigh on bullion .
Geopolitical & Safe-Haven Demand: Trade tensions (e.g., tariffs) are keeping gold elevated near $3,350–$3,360 .
Central Bank & Real Yields Watch: Continued gold purchases and lower real rates are supportive, although mid-term easing in risks (like global trade) could curb momentum .
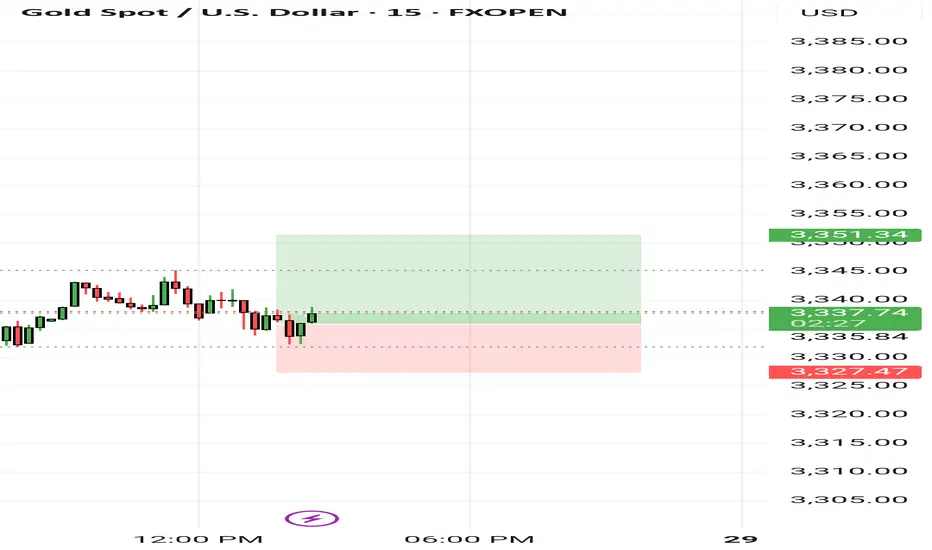
XAUUSD Expecting bullish Movement Buy Zone
Watch the 3310 to 3320 zone for potential bullish entries. This zone has acted as strong support in the past and could offer a solid risk-reward opportunity for buyers.
Target Levels
First Target 3375
Second Target 3390
Two scenarios are in play:
A direct breakout continuation to 3375 and then 3390.
A retracement towards the support zone before a bullish reversal.
Traders should monitor price action closely in the support zone for confirmation before entering trades

Gold 30Min Engaged ( Bullish Reversal Entry Detected )————-
➕ Objective: Precision Volume Execution
Time Frame: 30-Minute Warfare
Entry Protocol: Only after volume-verified breakout
🩸 Bullish Reversal From : 3341.5 Zone
➗ Hanzo Protocol: Volume-Tiered Entry Authority
➕ Zone Activated: Dynamic market pressure detected.
The level isn’t just price — it’s a memory of where they moved size.
Volume is rising beneath the surface — not noise, but preparation.
🔥 Tactical Note:
We wait for the energy signature — when volume betrays intention.
The trap gets set. The weak follow. We execute.
GOLD Price Continue to GrowXAUUSD has formed a bullish pattern after successfully testing and holding the strong support zone at 3310, which marked a key demand level. The recent bounce from this level confirms strong buyer interest despite temporary USD strength.
Demand for gold has sharply increased, often seen as a hedge during uncertain economic periods—even with a temporarily stronger dollar. The current price action reflects a bullish continuation pattern, suggesting potential for further upside. targeting will be 3360 3378 / 3400
You may find more details in the chart Ps Support with like and comments for better analysis.
I am Part of Trade Nations Influencer program and receive a monthly fee for using their Trading view charts charts in my analysis.

New ATH?Do you also think gold is going through a correction before heading toward its all-time high?
It's getting interesting :)

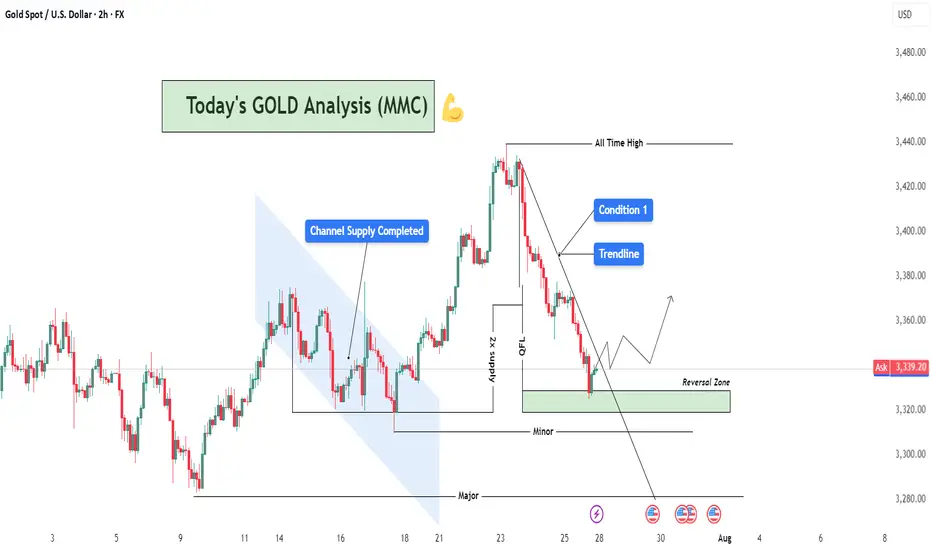
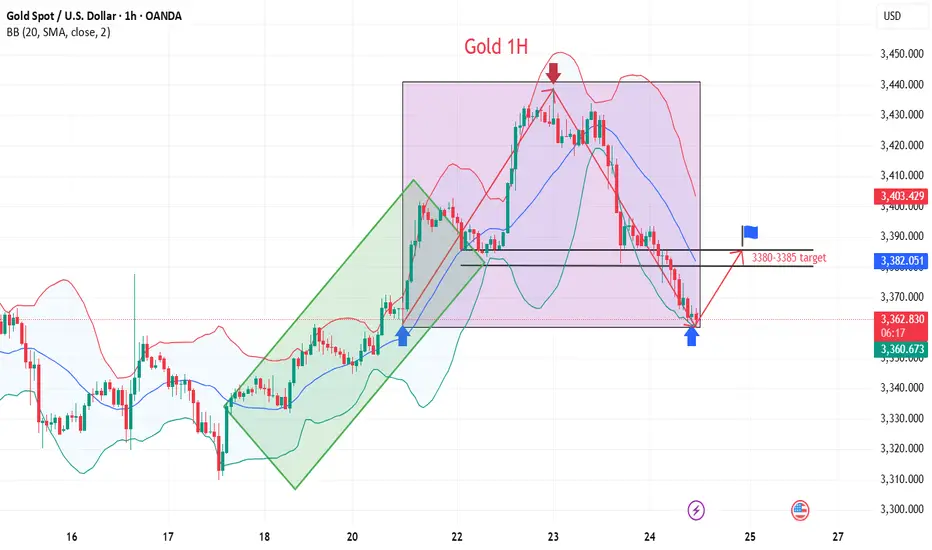
XAUUSD Analysis : Reversal Zone & Trendline Break Setup 🧠 Market Breakdown (Based on MMC Concepts)
Gold (XAU/USD) recently touched an All-Time High, followed by a sharp correction respecting a clean descending trendline — confirming strong selling pressure in the short term.
After price completed a Channel Supply zone (highlighted), it dropped significantly and created a 2x Supply Structure along with a QFL (Quasimodo Failure Level) — a strong indication of liquidity engineering by smart money.
Now, price has entered the Major Reversal Zone, which aligns with a key minor structural demand level. The reaction here becomes highly important, as it could mark the beginning of a new bullish leg.
📌 Technical Conditions
Trendline (Condition 1): Still active; breakout confirmation required for bullish entry.
Reversal Zone (Demand Area): Price currently reacting; signs of rejection forming.
Smart Money Behavior: Liquidity sweep + QFL zone = potential institutional accumulation.
Momentum Watch: Look for bullish engulfing or strong pin bar as confirmation.
🎯 Price Levels to Watch
Upside Targets:
🔹 TP1: 3,360 – 3,380
🔹 TP2: 3,420 – 3,440
Invalidation Zone:
🔻 Break and close below 3,300 = bearish continuation likely.
💡 Conclusion
Gold is approaching a decision point. If this reversal zone holds and we break the trendline, we could see a strong rally back toward previous supply zones. However, failure to hold could bring price lower for further liquidity grabs.
Stay patient. Let price confirm.
XAUUSD correction in progress Next target 3460-3470XAUUSD was trading in a up trend and currently consolidating, At the fib 0.5 and support channel support trendline both overlap at 3410-3415 area from where the price may resume again up the target can be 3460. let us see.

How to seize gold trading opportunitiesBased on yesterday's surge and then decline in gold prices and the current technical pattern, today's strategy is to focus on rebounding and selling. Gold fell under pressure from around 3337 in the Asian session yesterday, touching 3319 before rebounding to 3345. Pressure returned to 3301 in the US session, ultimately closing at 3314, marking a medium-sized bearish candlestick pattern on the daily chart. The current daily moving average system maintains a bearish trend, and the overall trend remains bearish; a technical correction is needed. The morning market is trading within a descending channel on the hourly chart. A rebound in the Asian and European sessions will focus on the key resistance zone of 3335-3340, which combines daily resistance, the 4-hour downward trend line, and the hourly chart gap. A strong break below the 3300 mark would indicate a continuation of the bearish trend, prompting a direct short position targeting the 3280-3275 area. The key strategy for the day remains to sell on rebounds, with the key bull-bear boundary at 3300.
Gold recommendation: short sell when it rebounds around 3335-3345, target 3300.

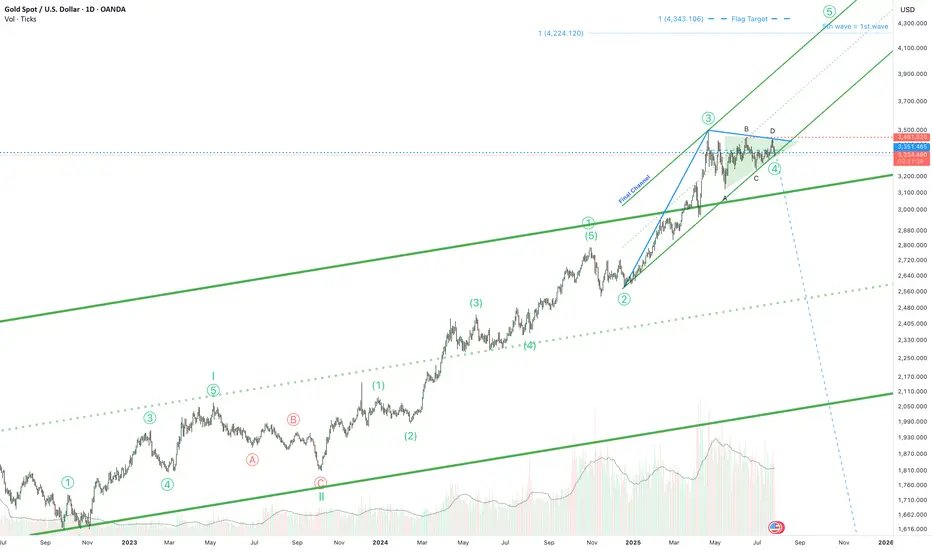
Gold is ready for the 5th wave!Hello! If you're following gold, here's some exciting news. The triangle correction phase that began in April is almost over. It's been a long journey, but we're almost there.
And guess what? The final phase is expected to reach around $4,300. But wait, there's more! The price is holding above the top of a long-term channel. This isn't just a random move; it could be a strong signal that the price could rise even higher than the $4,300 mark.
So, if you're following the gold market, keep your eyes peeled. Big moves could be just around the corner!
Gold failed to break through three times, short-term bearish?
💡Message Strategy
Gold's decline today means the second consecutive day of decline as investors turn their attention to more positive trade developments since yesterday.
However, gold still received buying support earlier this week and briefly broke through $3,400. This round of gains tested key resistance levels on the gold daily chart, but ultimately the bears held their ground.
This is the third time in nearly three months that gold has tried to break through the $3,430 to $3,435 resistance area, but all failed.
📊Technical aspects
Gold’s latest decline this week has brought the price back into a range-bound trading state between key hourly moving averages. This means that the short-term trend has become more neutral.
This shows that the upward momentum has clearly weakened and buyers need to regain short-term dominance before they can hope to challenge the key resistance area mentioned earlier again.
Currently, the 200 hourly moving average near $3,365 provides support to the downside. If the price can hold this level, it will indicate that buyers are still holding on and waiting for the next upside opportunity.
Combined with the current 1H chart trend analysis, there is still a great chance of a bullish pullback in gold in the short term.
💰Strategy Package
Long Position:3360-3365,SL:3340,Target: 3380-3400
"Gold at a Crossroads: 4H Close Below $3358 Could Trigger Major Technical Analysis
Key Levels:
Resistance Zones:
$3,451.42 – Major resistance.
~$3,410 – Mid-range resistance zone.
Support Zones:
$3,358 – Key support zone (critical level).
$3,330.50 – Secondary support.
$3,283.22 and $3,253.35 – Deeper support levels.
Current Price Action:
Price is currently trading at $3,366.47, pulling back after hitting a local top.
The yellow zone marks a decision area: Price may either bounce up or break down.
Two Scenarios Outlined:
🔼 Bullish Scenario: If price holds above $3,358 and breaks above the yellow zone, it may aim for $3,410 or even $3,451.
🔽 Bearish Scenario: A 4H candle close below $3,358 could signal continuation down toward $3,330, $3,283, and possibly $3,253.

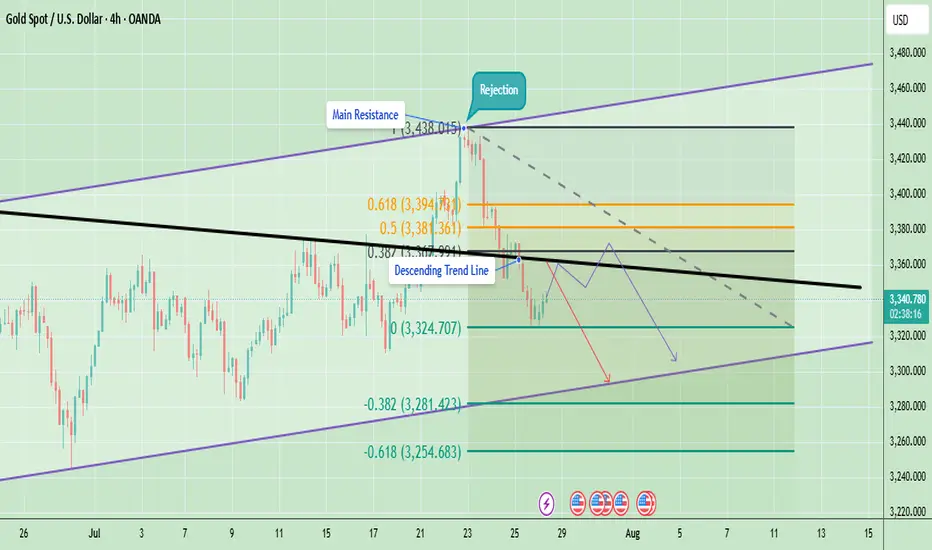
Technical Analysis - Gold Rejected at ResistanceGold is currently trading around $3,341 after facing a strong rejection from the $3,438 resistance area. This rejection coincided with the upper boundary of the trend channel and the main resistance zone, which also aligns with the Fibonacci 0.5–0.618 retracement levels. After the rejection, price fell below the descending trendline, indicating that short-term sellers have taken control.
On the downside, the immediate support sits at $3,324, which has acted as a short-term bounce level. A break below this could push gold lower toward $3,281 and potentially $3,254, which are key Fibonacci extension support levels. On the upside, the immediate hurdle is at $3,355–$3,360 (descending trendline). A breakout above this area will be critical for any bullish recovery attempt toward $3,381–$3,394 and eventually $3,420–$3,438.
At the moment, the short-term trend remains bearish because gold is trading below the descending resistance and showing lower highs. However, as long as gold holds above the $3,254 support zone, the medium-term structure remains neutral to bullish, giving bulls a chance if momentum shifts again.
Last week candle is pin bar bearish candle which is showing bearish momentum at the moment. The candle shows rejection near $3,400–$3,450, aligning with the triangle’s upper resistance trendline. If gold cannot reclaim and hold above last week’s high, price may drift lower to retest support zones around $3,248–$3,150 before another breakout attempt.
Note
Please risk management in trading is a Key so use your money accordingly. If you like the idea then please like and boost. Thank you and Good Luck!
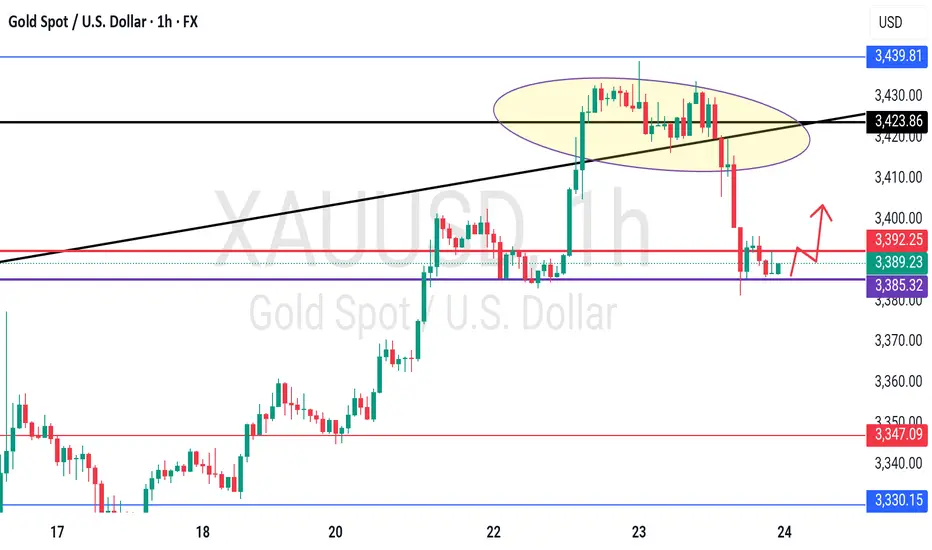
GOLD - One n Single Support, holding or not??#GOLD.. market just reached at his current ultimate supporting area and that is 3385
Keep close it and if market hold it in that case we can see again bounce otherwise not..
Note: we will go for cut n reverse below 3385 on confirmation.
Good luck
Trade wisely
Bullish on gold, but avoid chasing highs , beware of pullbacks!Analysis of gold trend: From the daily chart, gold is in an upward trend. From the technical indicators, MA5-MA10 moving averages are golden crosses, BOLL opens upward, K line runs on the upper track of the daily Bollinger band, and the MACD candle chart momentum column continues to increase, indicating that the bullish trend remains unchanged. KDJ runs near the 80 draw line and is overbought, which means that the short-term market upward momentum may be over-released, and there is a need for callback or shock consolidation. Although the general trend is bullish, it is difficult to form a continuous surge. This wave to 3440-3450 is very good, and it is likely to form a mid-term adjustment under the pressure of 3450. Be cautious about the current rise. If there is an effective adjustment, it may turn from strong to weak.
From the 4-hour chart, the performance in the chart has the possibility of reaching the top now. Gold surged to around 3438 after opening, and then fell back. The current strength is still relatively large. Therefore, today we should pay attention to whether there is a possibility of reaching the mid-term top. The support below is around 3410-3400. If it breaks below 3400, it may continue to adjust to -3385-3375 today. From the 1-hour chart, the technical indicators in the chart cross downward, indicating that there is a need for a short-term decline. The general trend is bullish. The short-term will first look at the retracement. Today, the support below is around 3410-3400. The intraday retracement relies on this position to continue to be bullish.
Gold operation strategy: short gold around 3435-3438, target 3420-3310. It is recommended to go long around 3410-3400, target 3420-3430.

Chart Analysis Gold (XAU/USD)Chart Analysis Gold (XAU/USD)
**Bearish Outlook (Short-Term)**
* **Price is below EMA 7 and EMA 21**, showing short-term bearish momentum.
* Strong **resistance zone** around **\$3,430–\$3,440** was rejected sharply.
* Price has broken below **\$3,405–\$3,395** support and is now **consolidating above \$3,385–\$3,380**, a critical support area.
* Volume is rising on red candles, supporting **selling pressure**.
**Key Support Zone:**
\$3,380 – If broken, next downside targets:
→ **\$3,370**
→ **\$3,360**
*Bullish Scenario (If Support Holds)**
* If **\$3,380** holds and price reclaims above **\$3,395**, a **bounce toward \$3,405–\$3,410** is possible.
* Look for a **break above EMA21 (currently near \$3,402)** for bullish confirmation.

#3,377.80 Resistance remains strongMy position: I have Bought Gold many times above #3,400.80 benchmark however as it got invalidated, I Bought #3,390.80 again late U.S. session and closed my set of Buying orders on #3,395.80 nearby extension. I left one runner (#3,390.80 entry point) with Stop on breakeven expecting Asian session to recover #3,400.80 benchmark, however it was closed on break-even as Gold extended Selling sequence. I will continue Selling every High's on Gold and if #3,357.80 gives away, expect #3,352.80 and #3,342.80 contact points to be met.
As expected Gold delivered excellent #3,372.80 and especially #3,365.80 - #3,352.80 Selling opportunities throughout yesterday's session which I utilized to it's maximum. I have also Bought Gold on late U.S. session with #3,372.80 as an entry point / however since Gold was ranging, I closed my order on break-even and met Gold below #3,352.80 benchmark this morning personally on my surprise (I did expected #3,377.80 to be invalidated to the upside).
Technical analysis: Gold’s Price-action is performing well below both the Hourly 4 chart’s and Daily chart’s Resistance zones for the cycle. Selling direction of today’s session is directly correlated with Fundamentals leaving the scene which found Sellers near the Intra-day #3,377.80 Resistance and most likely DX will close the Trading week in green, however struggling to make Bullish comeback and if #3,327.80 - #3,342.80 reverses the Selling motion, Gold’s Daily chart’s healthy Technicals which preserved core uptrend values. If the Price-action gets rejected at #3,352.80 - #3,357.80 Resistance zone, then further decline (under conditions where I will have more information with U.S.’s session candle) is possible and cannot be ruled out. Notice that at the same time and manner, Bond Yields are on consecutive Selling spree as well which Fundamentally has a diagonal correlation with Gold. The slightest uptrend continuation there, should add enormous Selling pressure on Gold.
My position: I am Highly satisfied with recent results and will take early weekend break (no need to Trade more). If however you decide to Trade today, Sell every High's on Gold / no Buying until Monday's session (my practical suggestion).
