GOLD Weekly Idea💡Why Gold Pulled Back
- Gold pulled back today after hitting $3439.04, just below resistance at $3451.53. Traders took profits ahead of key Fed and trade headlines. Right now, it’s trading around $3414.48, down 0.50%.
- The dip came after the U.S.-Japan trade deal eased geopolitical tension, cutting safe-haven demand. Plus, U.S. bond yields are climbing (10-year at 4.384%), which adds pressure on gold.
Support is building at $3374.42, with stronger buying interest expected around $3347.97 and the 50-day moving average at $3336.40 — a key level bulls want to defend.
Short-term looks a bit weak, but as long as gold holds above the 50-day MA, the bullish trend remains intact. Longer-term, weakness in the dollar, central bank gold buying, and concerns about Fed independence could push prices higher.
🔍Watching the Fed’s July 29–30 meeting next
XAUUSDK trade ideas
How can we seize the golden opportunity steadily and accurately?Yesterday, gold showed a trend of falling first and then rising to bottom out and rebound. After falling back to 3351, it quickly rebounded to around 3377. The overall fluctuation rhythm was highly consistent with our prediction. We accurately grasped the opportunity to arrange long orders and promptly notified the high position to reduce positions and make profits. The rhythm was properly controlled and we gained good returns.
From a technical point of view, the four-hour line fell and rebounded, and the short-term short momentum slowed down. Although it has not completely turned into a long structure, the short trend is no longer valid. At this stage, we will not look at new lows for the time being, and the operation is mainly based on the main long idea. At the daily level, pay attention to the long-short watershed of 3385. If it breaks through this level, it is expected to open up the upward space and look to 3392 or even above 3400; if it does not break, the market may continue the shock and wash pattern. Pay attention to the support below around 3365-3350. As long as it does not break and stabilizes, you can still choose to arrange low and long positions. In the short term, pay attention to the breakthrough of the rebound high point 3377. If it successfully stands firm, it will further enhance the continuity of the long position.

Weekly Analysis on GOLDFor next week trading sessions i will be more patience in waiting for my set up to appear before taking trades.
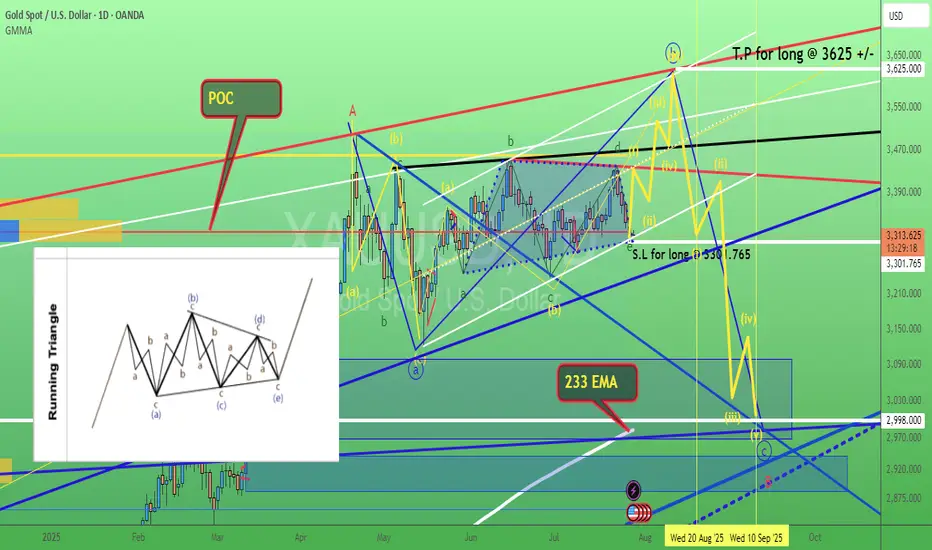
Hybrid Gartley-Elliott Wave Trade Setup on Gold Detailed Analysis & Prediction:**
This trade setup merges two powerful frameworks: a **bearish Gartley pattern** indicating a short-term pullback, and an **Elliott Wave interpretation** suggesting bullish continuation via wave five.
---
### 🧠 Thought Process:
1. **Gartley Pattern Completion:**
- The chart shows a completed bearish Gartley pattern with point D aligning around the **3,372 level**.
- As per harmonic rules, point D typically signals a reversal zone, suggesting a short-term drop.
2. **Projected Pullback:**
- A drop is expected toward the **3,323 support zone**, which coincides with previous swing lows and Fibonacci retracement confluence.
- This area likely marks the start of **wave five** in the Elliott Wave count — indicating that the bearish move is simply the final corrective wave before continuation.
3. **Wave 5 Bullish Opportunity:**
- Once price reaches the 3,323 zone and shows reversal confirmation, a strong bullish push is expected to begin.
- This aligns with historical wave structures and momentum indicators showing possible trend exhaustion.
---
### 🎯 Profit Targets:
| Target | Type | Price (USD) |
|--------|-----------------------|---------------|
| TP1 | Fibonacci 1.0 | 3,447.875 |
| TP2 | Fibonacci 1.27 | 3,536.025 |
| TP3 | Fibonacci 1.618 | 3,649.640 |
---
### 🛑 Stop Loss Strategy:
| Level | Type | Price (USD) |
|-----------|---------------------|---------------|
| SL1 | Conservative | 3,246.111 |
| SL2 | Aggressive | 3,198.444 |
---

Elliott waveAccording to the bearish structure, the ABC wave is completed, there are 5 more bearish waves.
Sell 3334, stoplos 3344, tp 3310

Gold Bullish Momentum still strongGeneral trend and momentum is still to the upside. We now have a nice pullback and an opportunity to buy low again. Price is currently reacting to an H1 TF demand zone. If this zone breaks, look for entries in H4 demand and continue to ride the bulls to All Time Highs.

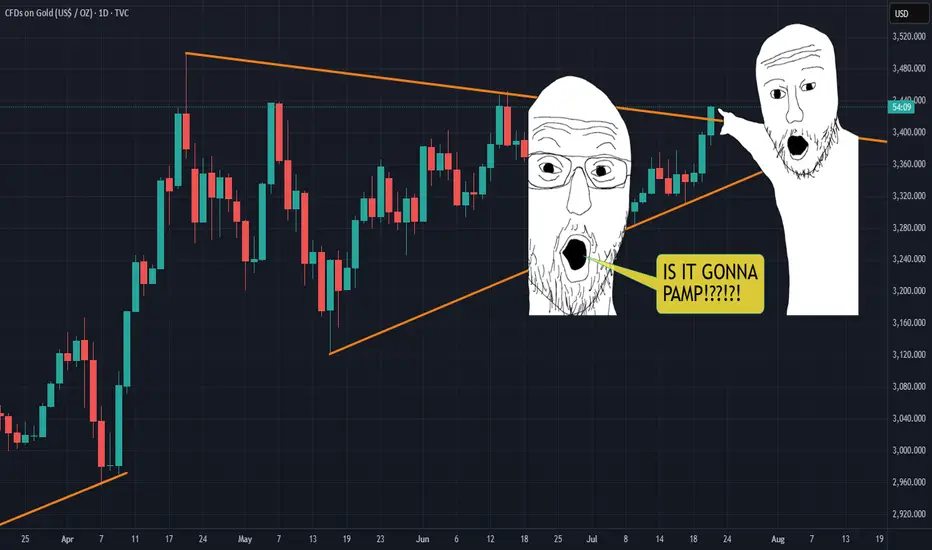
Will we be SHOWERED with GOLDen gainz?!IS IT PAMPIN TIME?!?!?! Looks like it's tryna break out, but beware of the fakeout. WIll it pop or double top!?
To those holding the golden treasure, may the lawd of pamp bless thee with gainz forever.
Gold miners went ham today too... probably nothing. LETS PAMP IT!
THANK YOU FOR YOUR ATTENTION ON THIS MATTER.
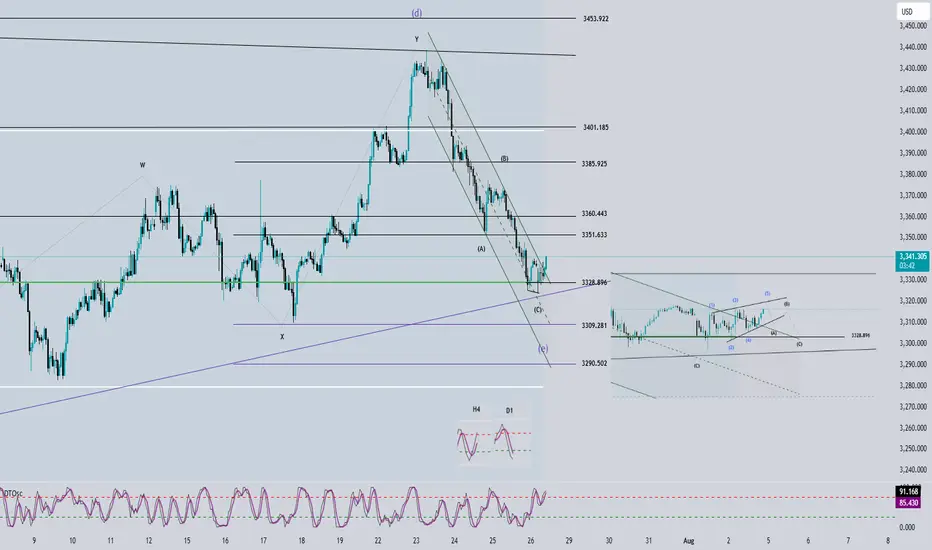
Elliott Wave Analysis – XAUUSD – July 28, 2025📊
________________________________________
🔍 Momentum Analysis:
• D1 Timeframe: Momentum has entered the oversold zone. This strongly suggests a potential bullish reversal today, which could lead to a rally or sideways movement lasting around 4–5 days.
• H4 Timeframe: Momentum is reversing upward. This indicates a likely bullish or sideways move in the short term, at least until momentum reaches the overbought zone (estimated within the next 2 H4 candles).
• H1 Timeframe: Momentum is currently overbought, so we may first see a pullback or sideways movement until a clearer reversal signal appears.
________________________________________
🌀 Wave Structure Analysis:
• On the H4 chart, as noted in previous plans, the assumption that price is forming a contracting triangle (abcde) is still valid. Price is currently in the final leg (wave e) of this triangle.
• On the H1 chart, we can observe a channel structure, within which an abc corrective pattern is unfolding.
• The lower boundary of the triangle (marked by the green trendline) combined with support zones will be critical areas to monitor for the end of wave e.
🔺 Note: Wave e does not necessarily end precisely at the triangle boundary – it can slightly overshoot. Hence, we’ll rely on smaller wave structures to identify potential reversal zones.
________________________________________
🎯 Key Price Zones to Watch:
• Target 1: 3329
• Target 2: 3309
• Target 3: 3290
________________________________________
🔎 Lower Timeframe Structure (M10):
From the current price action (as shown in the chart), we can see a leading diagonal triangle structure forming. This is a pattern commonly seen in wave 1. If this pattern is confirmed, a sharp and steep decline toward the 3329 zone is likely.
________________________________________
⚖️ Combining Momentum & Wave Structure:
• D1: Signals a potential reversal → favors Buy setups.
• H4: Momentum is rising, but price hasn’t confirmed a new bullish trend → need to stay alert and tighten Stop Loss.
• H1: Overbought + possible leading diagonal → Expecting a pullback for wave 2 toward 3329 → this would be the optimal Buy zone.
________________________________________
🧭 Trade Plan:
• For experienced traders:
→ Wait for price to reach key levels and watch for reversal signals before entering.
• For beginners:
→ Use the following Limit Buy setup:
✅ Setup 1:
• Buy zone: 3330 – 3328
• Stop Loss: 3320
• TP1: 3351
• TP2: 3370
• TP3: 3385
✅ Setup 2:
• Buy zone: 3310 – 3308
• Stop Loss: 3300
• TP1: 3328
• TP2: 3351
• TP3: 3370
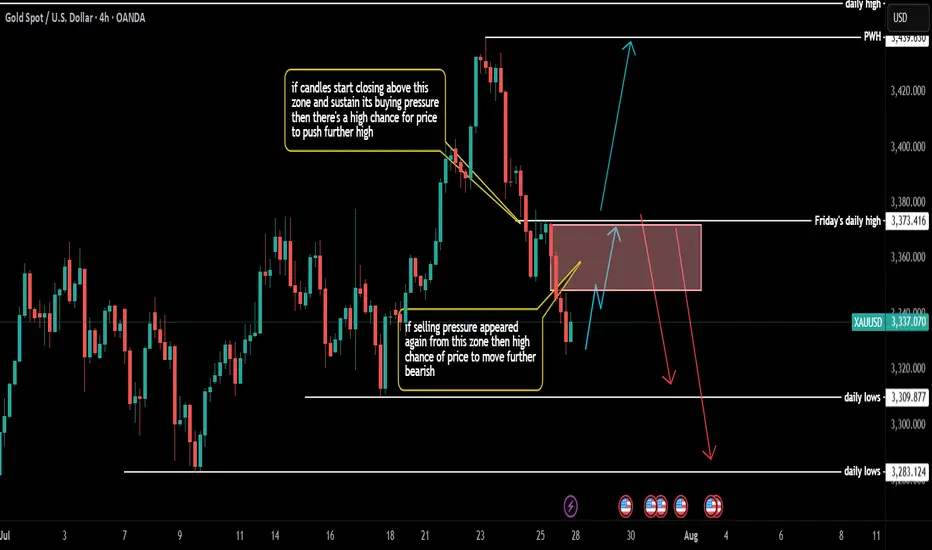
#XAUUSD H1 Setup – Smart Money Outlook📊 **#XAUUSD H1 Setup – Smart Money Outlook**
What we've been observing over the **last 3 sessions** is consistent **selling pressure** with **no meaningful pullback** yet — something that’s usually inevitable, even in strong downtrends.
🔁 A **retracement** is likely, and to identify key levels, we use the **Fibonacci Retracement Tool**.
---
### 🔍 **Market Sentiment Right Now**:
* Many traders are expecting a pullback into the **3348–3360 H1 Order Block**,
* Others are targeting **3368–3375** as a sell zone.
But here’s the twist:
⚠️ **Both these zones** could be potential **sell trap areas** (Fakeout Zone 1 & 2).
Why? Because **massive liquidity sits just above these levels**.
---
### 💡 **Smart Money Logic**:
Above the second fakeout zone lies an **inducement area** (liquidity pool).
And beyond that sits our **true institutional sell zone** at **3388–3393**, which aligns perfectly with the **Golden Fibo Zone (0.50–0.618)**.
📌 This is where we may see the **real bearish reaction**.
---
### 🟢 **Buy Setup Plan (Short-Term Opportunity)**:
If we get a **fully bullish H1 candle close above 3345**, we’ll look to **buy** with:
* **Entry:** Above **3345**
* **Stoploss:** Around **3332**
* **Target 1:** **3355**
* **Target 2:** **3368**
*(Potential final move into the trap zone)*
📢 **Important Note**: No buy will be considered without a strong **bullish H1 candle close** for confirmation. ✅
---
Let the market come to us — stay smart, not emotional. 🧠💰
\#SmartMoneyConcepts #XAUUSD #H1Analysis #LiquidityHunt #OrderBlock #GoldenFiboZone

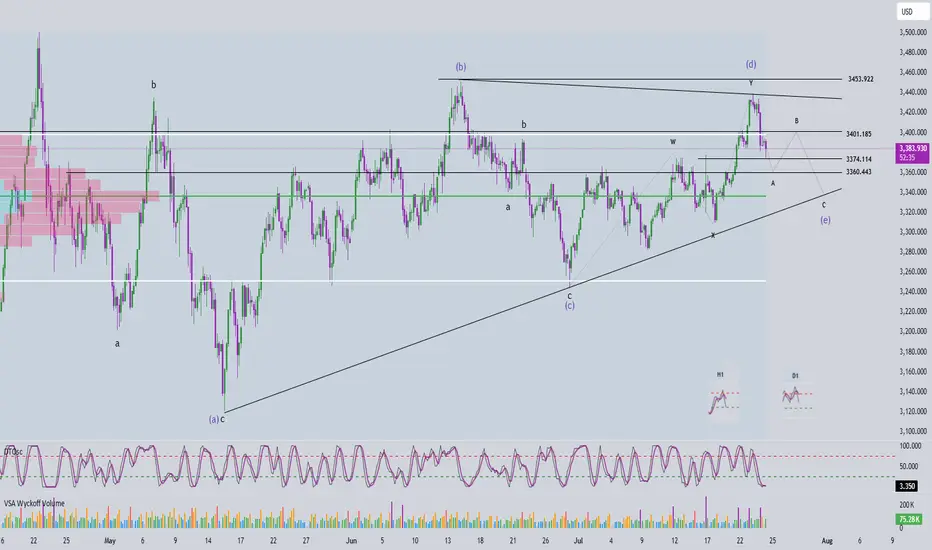
Elliott Wave Analysis – XAUUSD July 24, 2025📊
________________________________________
🔍 Momentum Analysis:
• D1 Timeframe: Momentum is currently in a downtrend, indicating that the dominant trend in the short term (at least until early next week) is likely to remain bearish or sideways.
• H4 Timeframe: Momentum has entered the oversold zone and is showing signs of a potential bullish reversal. This suggests that a corrective upward move may occur today.
• H1 Timeframe: Momentum is still declining and is expected to need around two more H1 candles before entering the oversold zone, implying that one more leg down may occur before a recovery begins.
________________________________________
🌀 Elliott Wave Structure Update:
Yesterday’s expectation of a breakout above the resistance zone at 3453 to confirm the start of a new bullish trend did not materialize. Instead, price dropped to the 3374 region, opening up two primary scenarios:
✅ Scenario 1: The correction is still unfolding
• Wave (d) in blue appears to be complete.
• The current leg is likely wave (e), the final leg in a contracting triangle correction.
• In this case, the lower boundary of the triangle and overlapping support zones will serve as key levels to watch for the completion of wave (e).
✅ Scenario 2: Wave 1 of a new bullish trend has completed
• The current decline is wave 2 in a new bullish impulsive sequence.
• The objective here is to identify the bottom of wave 2 to prepare for a potential buy entry into wave 3, which is expected to be stronger and longer than wave 1.
📌 Key difference between the two scenarios:
• Scenario 1 → Wave (e) completes, followed by wave 1 of wave 5.
• Scenario 2 → Wave 2 completes, followed by a powerful wave 3 of wave 5.
________________________________________
🧩 Current Wave Structure:
• A five-wave bearish structure is currently unfolding on the chart.
• According to Elliott Wave Theory, corrective patterns do not typically form five-wave structures.
• Therefore, this is likely wave A in a zigzag (5-3-5) formation.
• Possible targets for wave 5 within wave A:
o Target 1: 3374 – current reaction zone.
o Target 2: 3360 – next significant support level.
________________________________________
📌 Combining Wave Structure with Momentum:
The D1 momentum is firmly bearish, reinforcing the view that the market is undergoing a larger ABC correction.
On the H4 timeframe, momentum is oversold and showing early signs of reversal, aligning with the potential formation of wave B — typically a weak, sideways upward move. The likely resistance zone for the end of wave B lies between 3401 and 3410.
Meanwhile, H1 momentum is still falling and not yet in the oversold zone, suggesting there may be one more move down to complete wave 5. The ideal target for this final leg is around 3360.
Summary:
• D1 bearish → confirms ongoing major correction.
• H4 oversold → supports a potential weak wave B.
• H1 still declining → wave 5 may complete around 3360 before a recovery begins.
________________________________________
💼 Suggested Trading Plan:
For traders with limited experience or those not yet confident in reading live market signals, a Buy Limit strategy at clear support levels is recommended:
• Buy Zone: 3362 – 3360
• Stop Loss: 3352
• Take Profit:
o TP1: 3384
o TP2: 3400
🎯 For experienced traders, it is advised to observe price action at the target support zones and look for real-time reversal signals to optimize entry timing.
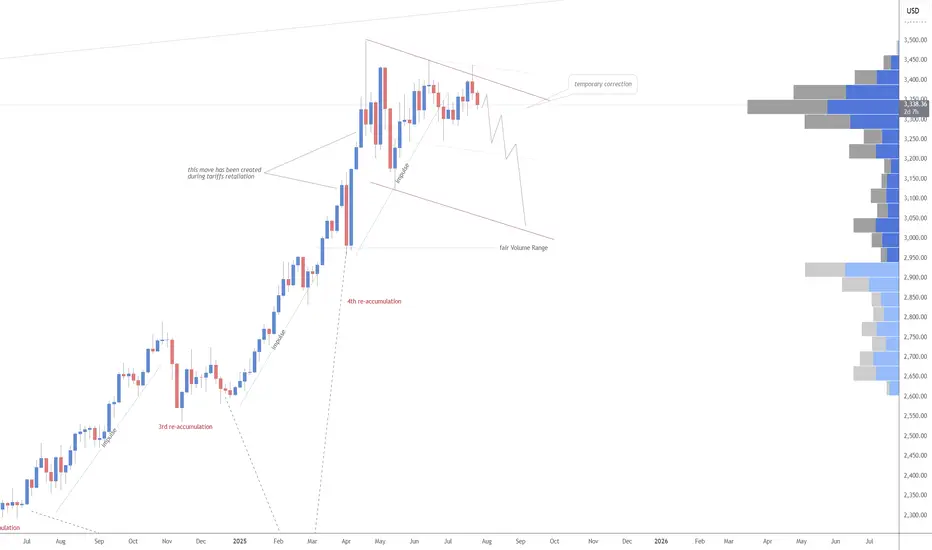
DeGRAM | GOLD above the resistance📊 Technical Analysis
● Five successive rebounds (green arrows) from the 4-month rising‐channel base at 3 293 keep the primary up-trend intact while turning the former wedge roof into support.
● Price is compressing inside a 4-day ascending triangle whose ceiling sits at 3 366; a break projects 1 : 1 to the March top/outer channel rail at 3 435.
💡 Fundamental Analysis
● FXStreet notes bullion ETF holdings rose for a second week as softer US PMI prices dragged 2-yr real yields back to early-July lows, trimming the dollar bid.
✨ Summary
Buy 3 345-3 355; triangle breakout >3 366 opens 3 389 then 3 435. Long bias void on an H4 close below 3 293.
-------------------
Share your opinion in the comments and support the idea with a like. Thanks for your support!

CHECK XAUUSD SIGNAL READ CAPTAINEntry Point: Around 3430.000 3426.000
Stop Loss: Around 3440.000
🎯 Target Levels
Take Profit 1:
3407.000
Take Profit 2:
3380.000
last target
3358.000

XAUUSD Technical Analysis – Resistance Turned Support, 📈 XAUUSD Technical Analysis – Resistance Turned Support, Bullish Continuation Expected
Gold (XAUUSD) has shown strong bullish momentum after breaking above the key resistance zone around $3,400, which now appears to be acting as a new support level. This structure shift signals a classic break-and-retest scenario, commonly observed in bullish continuations.
🔍 Key Observations:
Structure Shift: Previous resistance near $3,400 has been broken with strong bullish candles, suggesting buyer dominance. This level is now expected to serve as support.
Bullish Momentum: The move from the $3,320 support zone to above $3,430 was accompanied by clear trend formation and clean market structure, indicating sustained momentum.
Retest in Progress: Price is currently pulling back toward the new support zone ($3,400). If this area holds, a bullish reaction is expected.
Next Target: If support at $3,400 holds as expected, price could rally back toward the next resistance and projected target of $3,460.
📚 Educational Insight:
This setup illustrates the principle of resistance becoming support (RBS)—a foundational concept in technical analysis. After a breakout, a successful retest of former resistance often provides a high-probability entry point for trend continuation trades.

Smart Money Concepts (SMC)Positive aspects of the analysis:
1. Clear structural change (BOS and CHoCH):
A breakout of the previous bearish structure (Break of Structure) and a change in character (CHoCH) are evident, indicating an intention to change the trend.
2. Fake Out Identified:
The "fake out" toward the resistance zone is typical of liquidity traps designed to catch buyers before the actual decline. This provides institutional confluence for the short.
3. 15M block order + resistance zone:
Entry from a 15-minute OB, within a broader resistance zone. This strengthens the entry points, as there is a high probability of a bearish reaction there.
4. Mitigation of the previous 1H FVG:
The market has already mitigated the 1H Fair Value Gap, which generally indicates that the price no longer needs to rise further to balance this inefficiency.
5. Target in a logical zone (3,317):
Take profit placed just before a lower support zone. This is prudent, as many traders seek to close partial positions or exits before major support.

Gold is under pressure, shorts aim at 3310Gold is under pressure, shorts aim at 3310
Gold technical analysis and trading strategy: key support faces test, weak rebound, beware of breakout risk
Fundamental driving factors
The stabilization of the US dollar index suppresses gold prices: recent US economic data (such as retail sales, initial jobless claims) show resilience, the market's expectations for the Fed's rate cuts have been postponed, and US Treasury yields have rebounded, weakening the attractiveness of interest-free assets such as gold.
Risk aversion cools down: The situation in the Middle East has not escalated yet, and the rebound in US stocks has weakened the safe-haven demand for gold.
Fund flow: ETF holdings data show that institutional investors have continued to reduce their holdings of gold recently, reflecting that market sentiment is cautious.
Key technical signals
1. 4-hour cycle: oscillating bearish structure
Clear suppression: The overnight rebound high of 3375 (38.2% Fibonacci retracement level) constitutes a short-term strong and weak boundary, and the price has failed to stand firm here, indicating that bullish momentum is insufficient.
Support overlap: The 3340-35 area is the resonance area of the 4-hour trend line support and the Fibonacci downward target (3335-40). If it is lost, the downward space will be opened to 3320-3300.
Indicator divergence: The MACD histogram is shrinking and the fast and slow lines are close to the zero axis, and the RSI is hovering below 50, suggesting that the rebound momentum is exhausted.
2. 1-hour cycle: short-term technical structure is formed
Descending channel: Thursday's high of 3395 and the current high of 3377 form a secondary high point. Connecting the low point of the hourly chart can draw a descending channel, and the price runs along the lower track of the channel.
Key watershed: 3350 (61.8% retracement level) is a short-term long and short battle point. After breaking it, it will accelerate the test of 3340-35.
Today's trading strategy
Direction: Rebound high and empty mainly, and follow up after breaking the support.
Entry:
Aggressive short order: 3368-3373 light position short test, stop loss above 3380, target 3345-3340.
Steady short order: If the price rebounds to 3375-3380 under pressure, add short position, stop loss 3385, target unchanged.
Take profit and risk control:
Partial reduction of position near the first target 3340, the remaining position observes the support strength of 3340-35.
If it quickly breaks below 3340, short can be chased to 3325-3320 (previous low of daily line).
Alternative plan:
If the price unexpectedly breaks through 3380 and stabilizes, short position needs to be exited, wait and see the 3390-3400 pressure zone and then choose the opportunity to layout.
Key Tips
Don’t blindly buy the bottom: The current technical structure has not shown a bottom signal. Although the 3340-35 area is support, if it is accompanied by a large negative line break, it may trigger long stop-loss orders.
Data risk: Pay attention to the US PMI data in the evening. If it is stronger than expected, it may strengthen the dollar to suppress gold prices.
Gold – 25 July: Watching M15 Demand for Bullish Reversal📍 Gold – 25 July Outlook
Early Signs of Reversal from H4 OB Zone – Wait for Clear Continuation
🔍 Market Recap & Context:
Yesterday, the H4 Order Block zone (3359–3345) was retested and showed signs of holding. A visible M15 structure shift (ChoCH) suggests the market may be preparing to resume the uptrend.
However, the M15 Break of Structure (BoS) has not yet occurred — so this is not a confirmed reversal .
📍 Current Zone to Watch:
M15 Demand Zone: 3359.5 – 3351.5
Price is retracing into this zone. If respected, it could be the base for the next bullish leg.
📌 Trade Setup Possibility:
If price holds the M15 demand zone and M1 gives confirmation (e.g., micro-ChoCH + micro-BoS , a long trade could be considered.
But keep in mind — this would be an aggressive entry , because the M15 BoS is still pending.
This setup would rely on:
• Candlestick behavior
• Volume spikes or reaction
• Price action psychology
✅ Strategy Note:
Wait for signals like:
– Bullish engulfing on M1 or M5
– Micro ChoCH + demand hold
– Volume absorption or imbalance reaction
Only act if the market shows strength — not just a zone tap.
📝 Summary:
• Bias: Early bullish reversal watch
• Zone in Play: 3359.5–3351.5 (M15 demand)
• Confirmation: M1 LTF shift + strong candlesticks
• Caution: No M15 BoS yet — be precise and patient
• Risk Management: 1:3 RR — 40 pip SL / 120 pip TP
Let the chart speak first — observe with stillness, execute with precision.
📘 Shared by @ChartIsMirror

Buy level GoldStrong buy expected from our marked level strong buy trend line and fresh bullish engulfing level
Wait LTF confirmation then buy

Daily Analysis- XAUUSD (Thursday, 24th July 2024)Bias: Bearish
USD News(Red Folder):
-Flash Manufacturing PMI
Notes:
- Strong bearish closure, tariffs ease
- Looking for retracement to the downside
- Potential SELL if there's
confirmation on lower timeframe
- Pivot point: 3430
Disclaimer:
This analysis is from a personal point of view, always conduct on your own research before making any trading decisions as the analysis do not guarantee complete accuracy.

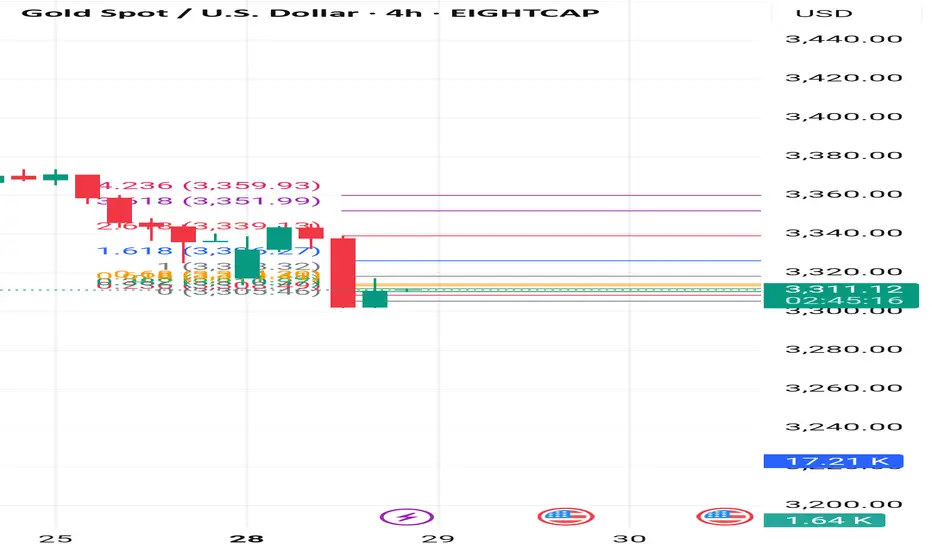
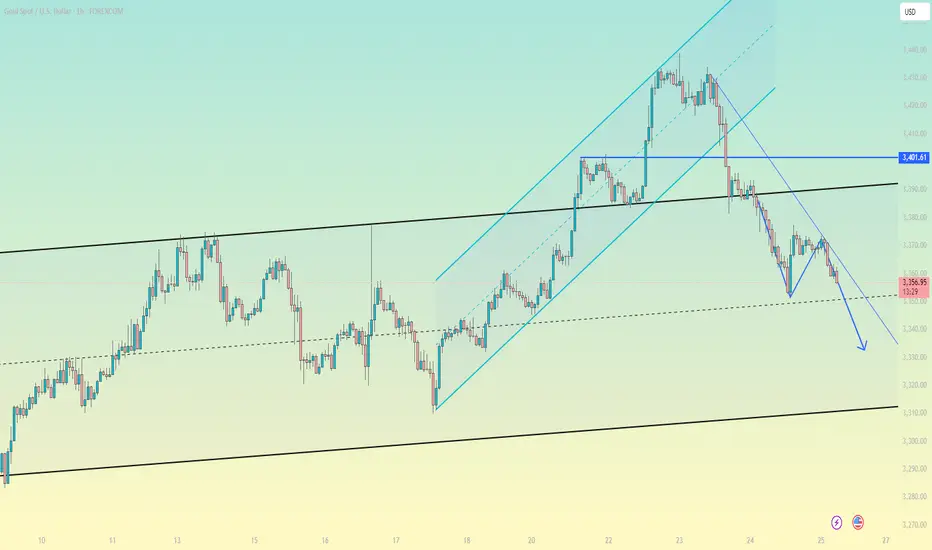
Gold. wave e (green) of triangle possible reached. 29/July/25XAUUSD based on speed of chart + confluence zone 1) Channel Support 2) POC of volume profile 3) Trendline support. Gold probably completed its wave e (green) of triangle.
Gold-----sell near 3350, target 3320-3300Gold market analysis:
The gold weekly candlestick pattern is a tombstone. The previous strong trend has turned into a weak trend after the high and low. Has the weekly selling come out? In fact, the historical weekly line has hit the top and fallen back three times, and there has been no big drop or deep drop. The long-term trend is still buying. The short-term adjustment has not changed the long-term buying trend. The international situation is not very clear, and it is difficult for gold to fall deeply. We are just a short-term trader. We need to follow. This week's operation idea is to follow the selling, or rebound selling. In addition, this week is a super data week, and buying and selling games will be inevitable. This week there are non-agricultural employment data and the Federal Reserve's interest rate meeting resolution, each of which can make the market magnificent. The daily K has entered its bottom support. Selling near 3300 needs to be avoided. These positions are all buying counterattack positions. In the rebound of the Asian session, we first focus on the suppression near 3350. This position is the K-intensive area of the bears, the K-line pattern suppression, and the daily moving average suppression position. Consider selling when the multi-layer suppression is close. I estimate that it will enter the repair at the beginning of this week, and wait for the data to bring direction later. Those who like to swipe back and forth can also find a good rhythm to sell long-term and buy short-term.
Support 3320, strong support 3306-3300, pressure 3350 and 3357, the watershed of strength and weakness of the market is 3350.
Fundamental analysis:
The latest news is that the United States and the European Union have reached a 15% tariff agreement, which overall supports the US dollar and suppresses gold. In addition, this week, pay attention to ADP employment data, non-agricultural employment data, and the Federal Reserve's interest rate decision and speech.
Operational suggestions:
Gold-----sell near 3350, target 3320-3300

Bullish or Bear trapHello Traders 👋
What are your thoughts on XAUUSD
Looking at the daily timeframe I anticipate manipulation by market players on gold.
Is likely that market players will stop Hunt Traders who have their stop losses at the different lows which is indicated with a red circle.
For every buyer there must be a seller and for every seller there must be a buyer.Where they are no sellers in the market the institutions will want to trigger stop losses in order to buy,which is known as stop hunting.That is to takeout previous buyers in the market and generate liquidity to buy.
And this stop hunting usually happens in a ranging market.
Looking at the structure of gold we can see that gold is ranging,
We can see a low or support of the range which was previously resistance and turned support for the ranging market.
I see the market using sell liquidity to liquidate buyers and react at the support or low of the range and move up to the range of the resistance

XAUUSD SELL SHORTXAUUSD SELL SHORT
- In Daily TF H4 TF Market is bearish
Selling from H4 SIBI In LTF Valid MSS then our entry
