XAUUSD on Bearish values and volume Gold is currently below rising channel and holding the Range of 3320-3335,although yesterday implusive drop is incompleted without testing 3290-3280
Eyes on DXY
What's possible scanarios we have?
▪️I will wait next for my sell trades at 3338-3345 area but what we have to watch during that time H4 candle closing.if H4 & H1 candle close above I will not hold or renter sell also below 3320 we have implusive drop.
▪️Secondly if H4 candle closing above 3345 this down move will be invalid and Price-action will reached 3370.
#XAUUSD
XAUUSDK trade ideas

XAUUSD
XAUUSD Updated in 15M :
The gold signal is marked on the chart based on the latest price changes and the supply and demand in the market. These points include the entry point, stop loss, and take profit

Gold Continues Mild Uptrend – Watching for Reaction at $3351📊 Market Overview:
Gold maintained its bullish momentum during the Asian–European session, rising from $3330 to $3344. A slightly weaker USD and safe-haven demand supported prices. However, price is now approaching a key resistance zone, where technical rejection may occur in the U.S. session.
________________________________________
📉 Technical Analysis:
• Key near-term resistance: $3345 – $3351
• Stronger resistance (higher zone): $3360 – $3366 and $3374
• Nearest support: $3335 – $3332
• Stronger support (lower zone): $3322 – $3315
• EMA 09 (H1): Price is above EMA09 → confirms short-term uptrend
• Candlestick / Volume / Momentum:
• Price is consolidating in an ascending triangle
• A breakout above $3345 may target $3360+
• RSI remains below overbought; volume is stable → room for continuation
________________________________________
📌 Outlook:
If gold holds above $3335 and breaks above $3351, the uptrend could extend toward the $3366–$3374 zone. However, failure to break $3351 followed by a drop below $3332 could lead to a deeper pullback toward $3315.
💡 Recommended Trading Strategies:
BUY XAU/USD: $3318 – $3315
🎯 TP: 40/80/200 PIPS
❌ SL: $3321
SELL XAU/USD: $3360 – $3363
🎯 TP: 40/80/200 PIPS
❌ SL: $3357

XAU/USD(20250728) Today's AnalysisMarket news:
Trump announced that the US and Europe reached a trade agreement: 15% tariffs on the EU, $600 billion in investment in the US, zero tariffs on the US by EU countries, the EU will purchase US military equipment, and will purchase US energy products worth $750 billion. However, the US and Europe have different statements on whether the 15% tariff agreement covers medicines and steel and aluminum. Von der Leyen: The 15% tariff rate is the best result that the European Commission can achieve.
US Secretary of Commerce: The deadline for tariff increases on August 1 will not be extended. The United States will determine the tariff policy on chips within two weeks.
Technical analysis:
Today's buying and selling boundaries:
3345
Support and resistance levels:
3393
3375
3363
3326
3315
3297
Trading strategy:
If the price breaks through 3345, consider buying in, the first target price is 3363
If the price breaks through 3326, consider selling in, the first target price is 3315

GOLD (XAU/USD) SHORT TRADE PLAN
July 25, 2025
Trade Overview (My setup)
- Direction: Short (SELL)
- Entry Price: $3,330
- Take-Profit: $3,270
- Stop-Loss: $3,370
- Lot Size: 0.18 lots (18 oz)
- Risk: $720
- Reward: $1,080
- Risk/Reward Ratio: 1.5 : 1
Technical Analysis Supporting the Bearish Bias
1. Price Structure & Trend
- Descending channel observed on the 4H chart - strong short-term bearish signal.
- Series of lower highs and lower lows confirms bearish trend.
- Price is testing $3,325-$3,300 support - breakdown opens downside to $3,270-$3,250.
2. Key Support/Resistance Zones
- Key support: $3,300 being tested.
- Resistance: $3,360-$3,370 zone - logical stop-loss location.
3. Indicator Confirmations
RSI (4H): ~35-40, bearish territory, no bullish divergence.
Moving Averages: Price below 50 EMA and 200 EMA - bearish crossover.
MACD: Bearish crossover, histogram confirms selling momentum.

Elliott waveelliott 5 wave structure bearish continuation
sell limit 3347-3350 stoploss 3355, tp 3320
GOLD Will Move Higher! Buy!
Here is our detailed technical review for GOLD.
Time Frame: 12h
Current Trend: Bullish
Sentiment: Oversold (based on 7-period RSI)
Forecast: Bullish
The market is on a crucial zone of demand 3,347.64.
The oversold market condition in a combination with key structure gives us a relatively strong bullish signal with goal 3,425.86 level.
P.S
We determine oversold/overbought condition with RSI indicator.
When it drops below 30 - the market is considered to be oversold.
When it bounces above 70 - the market is considered to be overbought.
Disclosure: I am part of Trade Nation's Influencer program and receive a monthly fee for using their TradingView charts in my analysis.
Like and subscribe and comment my ideas if you enjoy them!

CHECK XAUUSD SIGNAL READ THE CAPTAINEntry Point: Around 3356.000 3352.000
Stop Loss: Around 3338.000
🎯 Target Levels
Take Profit 1:
3372.000
Take Profit 2:
3391.000
last target
3410

XAU/USD(20250725) Today's AnalysisMarket news:
The European Central Bank announced that it would maintain the three key interest rates unchanged, reiterated data dependence, warned that the external environment is highly uncertain, and President Lagarde did not rule out the possibility of future rate hikes. Traders reduced their bets on ECB rate cuts.
Technical analysis:
Today's buying and selling boundaries:
3370
Support and resistance levels
3412
3397
3386
3355
3344
3329
Trading strategy:
If the price breaks through 3370, consider buying in, with the first target price of 3386
If the price breaks through 3355, consider selling in, with the first target price of 3344

XAUUSD Chart Analysis: Bullish Flag PatternBased on the provided XAUUSD chart, a classic bullish flag pattern appears to be forming on a short-term timeframe. This is a continuation pattern that suggests a potential resumption of the prior uptrend.
Here's a breakdown of the pattern's components:
The Flagpole: The pattern begins with a strong and rapid upward price movement, which forms the "flagpole." This sharp rally is visible around the 21:00 mark on the chart, indicating strong buying pressure.
The Flag (Consolidation): Following the flagpole, the price has entered a period of consolidation. This forms the "flag," which is characterized by the price action moving downward within a well-defined parallel channel or falling wedge. The two white trendlines neatly outline this corrective phase.
Potential Breakout: The price is currently testing the upper trendline (resistance) of the flag. A bullish flag pattern is confirmed when the price breaks decisively above this upper trendline.
Interpretation and Potential Trade:
Continuation Signal: A breakout would signal that the consolidation period is over and the initial bullish momentum is likely to continue.
Price Target: The "Long Position" tool on the chart illustrates a potential trade based on this pattern. Typically, the target for a flag pattern is measured by taking the height of the flagpole and adding it to the breakout point. The tool projects a take-profit level around 3,395.538.
Risk Management: The tool also indicates a potential stop-loss placed below the low of the flag (around 3,364.496), which is a common strategy to manage risk if the pattern fails.
In summary, the chart shows a pause in an uptrend. Traders will be watching for a confirmed breakout above the flag's resistance to anticipate further upward movement in XAUUSD.

Gold Intraday Trading Plan 7/25/2025Gold closed the day right at the 3365-3373 support which was the previous resistance. It is also just at the EMA line. Yesterday it also tested the trendline support. The situation is very tricky right now. It seems it is testing the supports and trying to break down. I will be cautious to engage buying orders today.
If I see it rejecting the supports again, I will engage buying orders. Alternatively, if the trendline is broken, I will engage selling orders.
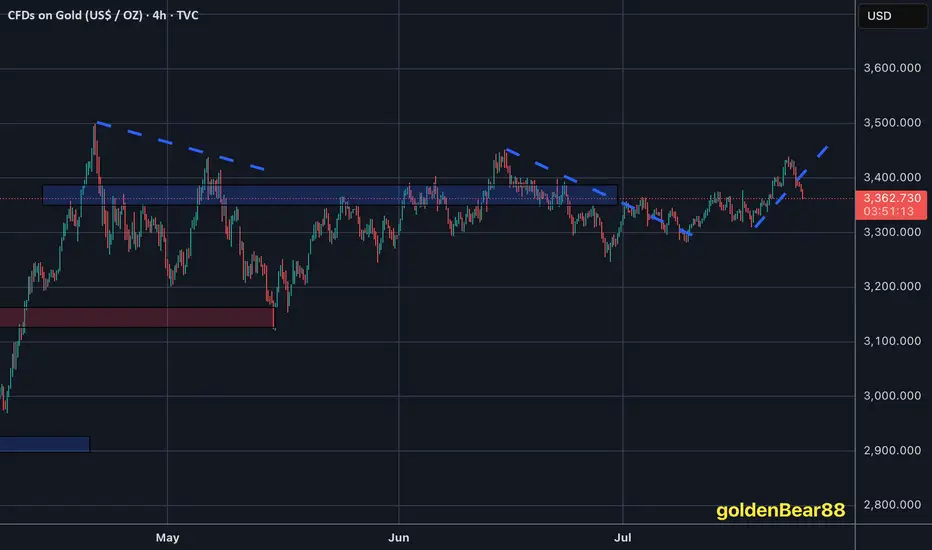
Gold didn't managed to recover #3,400.80 benchmarkAs discussed throughout my yesterday's session commentary: "My position: I spotted that many Traders Sold Gold throughout yesterday's session which was a mistake personally as Gold will remain strong on each next session due global Fundamentals. Firstly I have Bought #3,385.80 Bottom with #4 orders. First one I have closed near #3,400.80 benchmark, second two I have closed at #3,407.80 since Profit was already great and left final runner which I closed on #3,424.80 / expecting #3,434.80 final destination which was delivered. I will keep Buying every dip on Gold as long as #3,400.80 benchmark holds as an Support from my key re-Buy points."
Technical analysis: Price-action came even closer to my projected #3,357.80 Support fractal. As expected the #3,400.80 - #3,405.80 structure acted effectively as an Resistance zone as it was places within last MA periods. Daily chart is again marginally Bearish on its vast majority, only Supported now by the #3,352.80 - #3,357.80 which is interval level, and if Support zone gets invalidated, #3,342.80 Support in extension will be set in motion (Daily chart suggests an even Lower Support base towards #MA50 which is reasonable configuration to expect considering the wide frame on my Volume formula).
My position: I have Bought Gold many times above #3,400.80 benchmark however as it got invalidated, I Bought #3,390.80 again late U.S. session and closed my set of Buying orders on #3,395.80 nearby extension. I left one runner (#3,390.80 entry point) with Stop on breakeven expecting Asian session to recover #3,400.80 benchmark, however it was closed on break-even as Gold extended Selling sequence. I will continue Selling every High's on Gold and if #3,357.80 gives away, expect #3,352.80 and #3,342.80 contact points to be met.
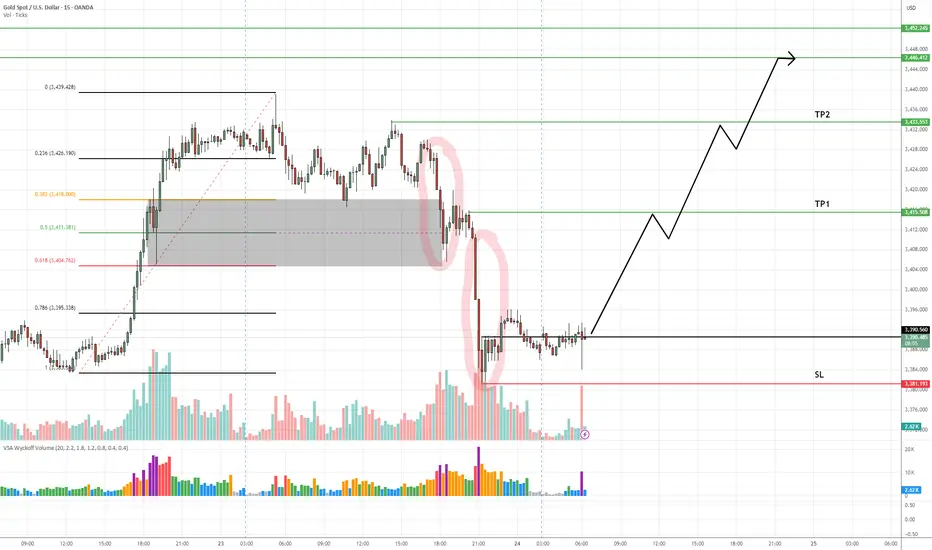
XAUUSD Buy Setup – VSA + Smart Money Reaction at Demand Zone✅ Entry: Current price action (around 3,392)
🎯 Take Profit 1 (TP1): 3,415
🎯 Take Profit 2 (TP2): 3,446–3,452
🛑 Stop Loss (SL): 3,381 (below the confirmed demand zone)
📊 Technical Insight (VSA-Based Analysis):
The sharp markdown into the demand zone occurred with expanding volume and wide spreads, a classic sign of stopping volume—potential smart money absorption of panic selling.
The second wide-range down candle was followed by lower volume and tighter spread bars, indicating supply exhaustion.
The market is forming a cause (accumulation) at the bottom of this drop, confirmed by:
No follow-through selling despite high volume
Narrow spread candles showing hesitation from sellers
Increasing volume on small up-bars, suggesting hidden buying
The zone aligns with previous structure and lies just above the 0.786 Fib retracement, adding further confluence to the bullish case.
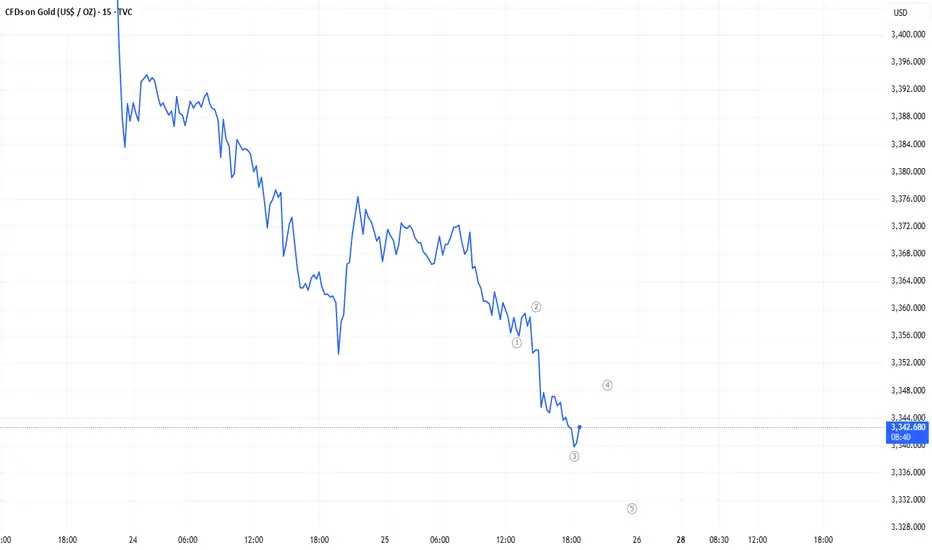
Hybrid Gartley-Elliott Wave Trade Setup on Gold – Bearish Dip In📊 Detailed Analysis & Prediction:**
This trade setup merges two powerful frameworks: a **bearish Gartley pattern** indicating a short-term pullback, and an **Elliott Wave interpretation** suggesting bullish continuation via wave five.
### 🧠 Thought Process:
1. **Gartley Pattern Completion:**
- The chart shows a completed bearish Gartley pattern with point D aligning around the **3,372 level**.
- As per harmonic rules, point D typically signals a reversal zone, suggesting a short-term drop.
2. **Projected Pullback:**
- A drop is expected toward the **3,323 support zone**, which coincides with previous swing lows and Fibonacci retracement confluence.
- This area likely marks the start of **wave five** in the Elliott Wave count — indicating that the bearish move is simply the final corrective wave before continuation.
3. **Wave 5 Bullish Opportunity:**
- Once price reaches the 3,323 zone and shows reversal confirmation, a strong bullish push is expected to begin.
- This aligns with historical wave structures and momentum indicators showing possible trend exhaustion.
Profit Targets:
| Target | Type | Price (USD) |
|--------|-----------------------|---------------|
| TP1 | Fibonacci 1.0 | 3,447.875 |
| TP2 | Fibonacci 1.27 | 3,536.025 |
| TP3 | Fibonacci 1.618 | 3,649.640 |
---
### 🛑 Stop Loss Strategy:
| Level | Type | Price (USD) |
|-----------|---------------------|---------------|
| SL1 | Conservative | 3,246.111 |
| SL2 | Aggressive | 3,198.444 |

XAUUSD: Fluctuation of $30/ounce. Do you want to know?Yesterday, I frantically notified followers to buy around 3366-3375, and the market finally rose to 3430. This is a huge profit. I will continue to update it in the Band Trading Center Research Institute later. If you don’t want to miss it, follow me. If you see it but are still not sure how to trade. Then you can leave me a message at the Swing Trading Center Research Institute. I will reply to you one by one when I see it.
This week, some followers have achieved weekly profits of 50%-268%. If your profit is not ideal. Or don’t know how to trade. Remember to like and follow. I will lead everyone to victory.
Buy around 3400-3410. When will it close? I will post the results on the Swing Trading Center. Stay tuned.

XAU/USD Technical Analysis (Revised): A Confirmed Sell SetupThis analysis outlines a tactical, aggressive short-term selling (scalping) opportunity on XAU/USD. This plan includes a specific confirmation trigger and a crucial risk management rule. It is vital to remember that this is a counter-trend trade, and our primary strategic focus remains on finding a long (buy) position.
I. The Aggressive Sell (Scalping) Setup
The immediate price action suggests a potential short-term sell, for which we will await confirmation before acting.
Rejection from Resistance: The price has been firmly rejected from the key resistance level around 3,433.556, showing that sellers are active in this area.
Initial Breakdown: The price has dipped below the immediate consolidation zone (gray rectangle), signaling potential bearish momentum.
Risk Management: Half-Risk Approach (0.5R)
Instruction: For this specific trade, it is highly recommended to use only half of your standard risk (0.5R). If you normally risk 1% of your account per trade, you should risk only 0.5% on this setup.
Reasoning: This is an aggressive, counter-trend trade. The primary market trend is bullish, and trading against it carries inherently higher risk. By reducing our position size, we mitigate potential losses if the market unexpectedly reverses and continues its strong upward move. This conservative approach allows us to test the bearish hypothesis while preserving capital for the main, higher-probability buy setup later.
Trade Plan:
Entry Confirmation (Key Condition): Do not enter preemptively. Wait for a 15-minute candlestick to close decisively below the support level of 3,423.915. A solid close below this level confirms that sellers are in control and validates the entry.
Stop Loss: After a confirmed entry, place the stop loss above the recent high and the resistance zone, around 3,439.035.
Take Profit Targets:
TP1 (Aggressive): The 0.618 Fibonacci retracement level (around 3,416.000) is the first target for a quick scalp.
TP2 (Full Target): The area between the 0.786 Fibonacci level and the lower support line (around 3,404.800) is the final target for this corrective move.
II. The Primary Buy (Main Focus) Strategy
This sell trade is a tactical maneuver within a larger uptrend. Our primary goal is to re-enter the market on the long side.
Underlying Bullish Strength: The market's previous strong, impulsive rally indicates that buyers control the larger picture. The current downward move is likely a retracement.
Potential Buy Zones: The take-profit zones for our short trade are the ideal areas to look for a buy entry. We will be monitoring these levels for signs of a reversal:
Zone 1: The 0.618 Fibonacci level (~3,416.000).
Zone 2: The 0.786 Fibonacci level (~3,408.000) and the nearby ascending trendline.
We will wait for bullish confirmation (e.g., pin bars, engulfing candles) in these zones before executing a buy order.
Summary:
The plan is to wait for a 15-minute candle close below 3,423.915 to confirm a short entry. This trade will be taken with half the usual risk (0.5R) due to its counter-trend nature. We will aim to take profit at key Fibonacci support levels, where we will then look to pivot and execute our primary strategy: buying in alignment with the dominant bullish trend.

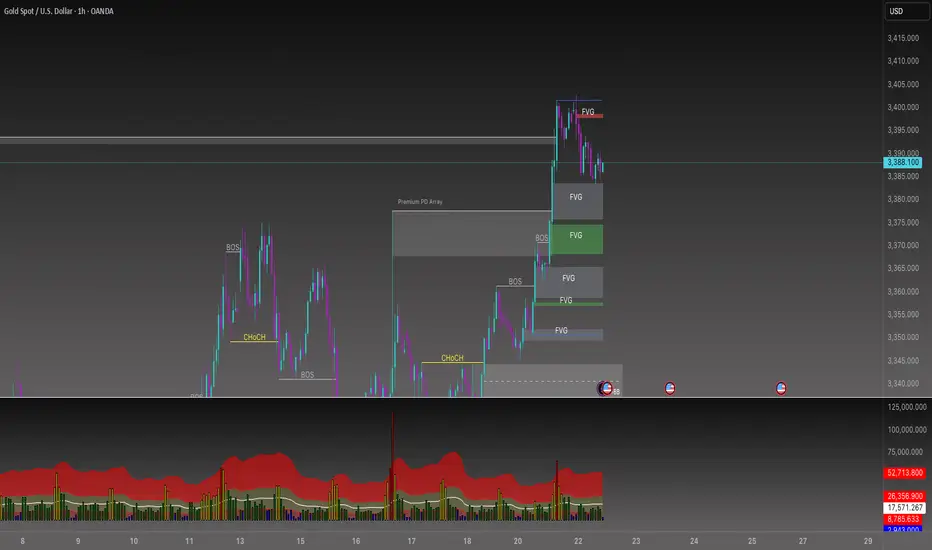
Gold vs US Dollar (XAUUSD) Technical AnalysisSpotted a clean FVG with sharp rejection off the zone. I’m expecting Gold to bounce up, fill the bearish FVG above, and retest 3,395.80.
CHECK XAUUSD SIGNAL READ CAPTAINEntry Point: Around 3326.000 3329.000
Stop Loss: Around 3314.000
🎯 Target Levels
Take Profit 1:
3343.000
Take Profit 2:
3365.000
last target
3386.000

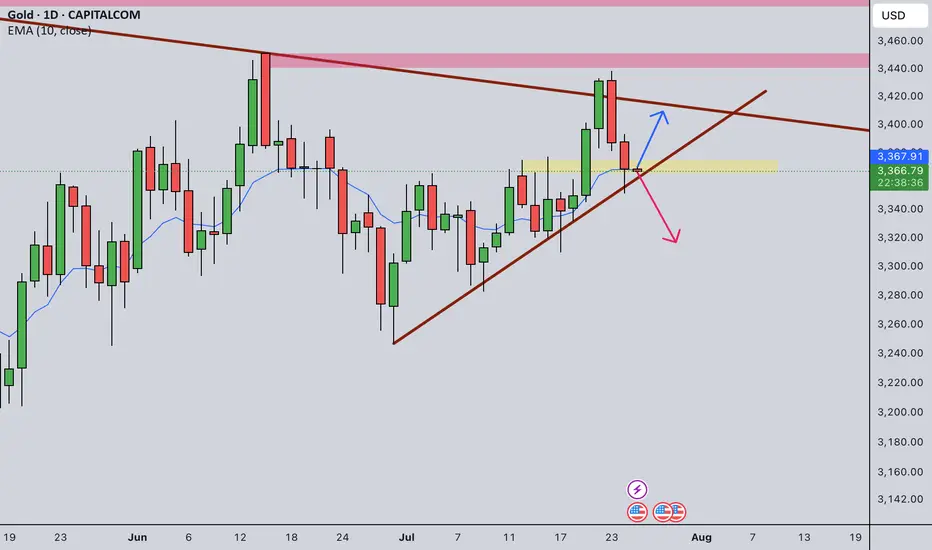
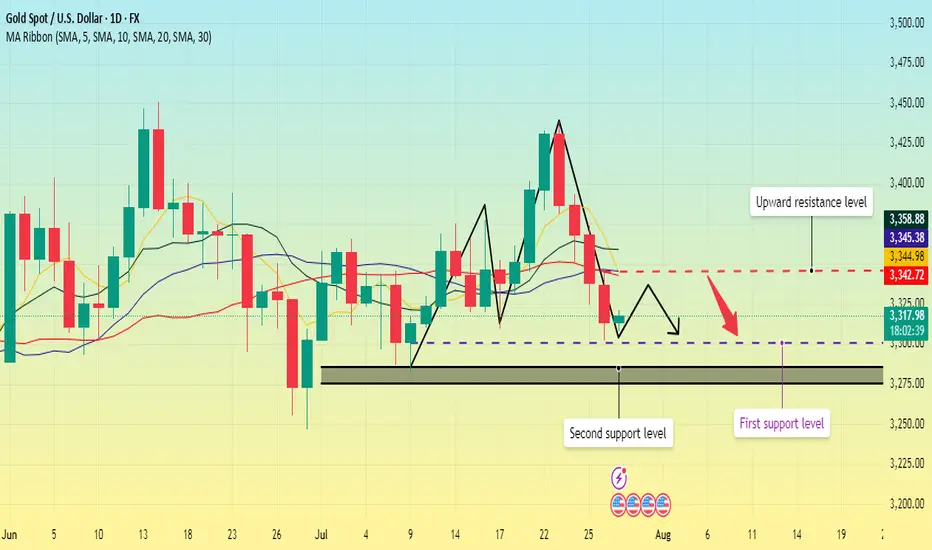
Golden View 20250729How should we view the current market conditions?
High-level shock, large triangle convergence and breakout, has been confirmed
Bearish expectations
Next, you can try to adopt a short strategy.
The question is, where to enter the short position?

Gold repeatedly tested lows. Will it break through?On Monday, the Asian market opened low and rose in the early trading. In the European trading, it rose to around 3345. The European trading was under pressure and fluctuated. The US trading began to accelerate its decline, and the lowest point reached around 3302. Then it continued to fluctuate in the range of 3300-3320.
On July 27, the United States and the European Union reached a framework trade agreement; the agreement reduced market concerns about the global economic recession, promoted the attractiveness of risky assets, and boosted the stock market and the US dollar. Although Trump has repeatedly pressured for a substantial interest rate cut, the market has strong expectations for a September interest rate cut. The current expectation of maintaining a stable interest rate dominates the market, coupled with the strength of the US dollar, which puts gold prices under downward pressure in the short term.
Gold opened low in the early trading on Monday and then rebounded to recover the losses, but then fell below the low again, and the daily line closed in the negative, and now it has formed a four-day negative decline. MA5 and 10-day moving averages form a dead cross, and there is a downward turn.
The focus on the upper side is around Monday's high of 3345, which is also near the current position of MA5, 20, and 30-day moving averages. Below this position, gold is weak; if it breaks upward, it is necessary to prevent the possibility of a rebound correction.
The lower support first focuses on the 3300 integer mark; secondly, focus on the area around 3285-3275.
Operation strategy:
Short near 3340, stop loss 3350, profit range 3320-3300;
Long near 3300, stop loss 3290, profit range 3320-3340.
Before the release of US data on Tuesday, you can maintain this operation strategy; after the data is released, adjust the strategy based on the impact of the data.
Gold is fallingGold is in the neutral zone, and based on the candlesticks on higher time frames, trend line breakouts, etc., I see that it is correcting to the specified zone by the end of the week.

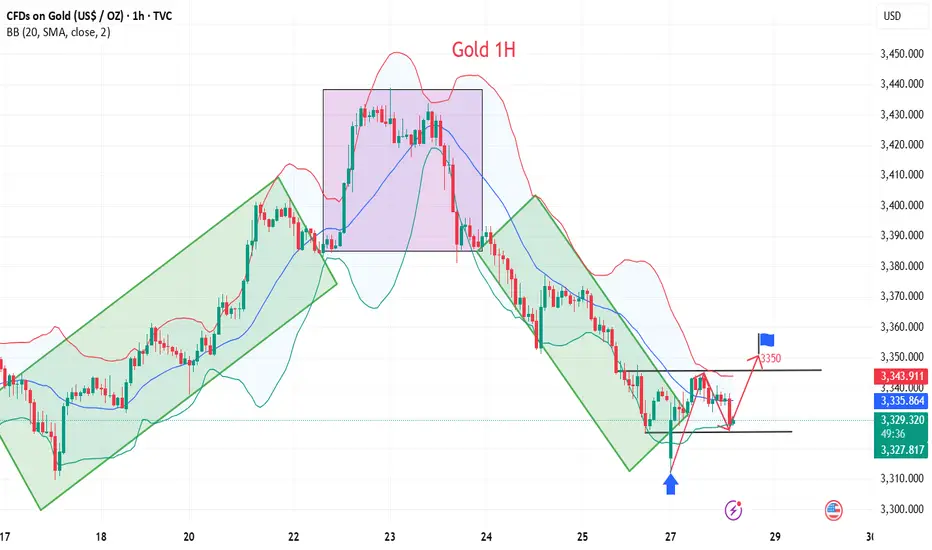
Gold short-term rise waiting for breakthrough
💡Message Strategy
During the Asian trading session, gold prices rebounded slightly from $3,320, filling the short gap at the start of the new week. As investors chose to stay on the sidelines before the Fed's two-day monetary policy meeting, the bullish force of the US dollar temporarily weakened, providing support for gold, an interest-free asset.
However, with the 15% tariff agreement between the United States and Europe and the positive progress of trade easing between the United States, Japan and the United States, market risk appetite has rebounded, weakening the appeal of gold as a safe-haven asset.
According to market surveys, "The current optimistic atmosphere of trade has weakened the safe-haven demand for gold, while the weakening of the US dollar has provided support for gold prices. The two forces offset each other, causing gold to fluctuate."
Investors are focusing on the FOMC meeting to be held on Tuesday. Although Trump continues to pressure the Fed to cut interest rates, the market generally expects that the interest rate will remain unchanged at this meeting because the US labor market remains strong.
In addition to the interest rate decision, this week will also usher in the US second quarter GDP estimate, PCE price index and non-farm payrolls report, all of which may have a significant impact on gold.
📊Technical aspects
From the technical trend, gold triggered a rapid correction after breaking below the lower edge of the short-term rising channel and the 50% Fibonacci retracement level last week. The current gold price stabilized in the $3,320 area and received some buying at the 61.8% Fibonacci support.
However, it is worth noting that the 200-period moving average on the 4-hour chart is at $3,350, which constitutes an important technical resistance for a short-term rebound. On the contrary, if gold breaks through the $3,350 level, gold will continue to develop a bullish pattern.
From the technical trend, gold triggered a rapid correction after falling below the lower edge of the short-term rising channel and the 50% Fibonacci retracement level last week. The current gold price stabilized in the $3,320 area and received some buying at the 61.8% Fibonacci support.
However, it is worth noting that the 200-period moving average on the 4-hour chart is at $3,350, which constitutes an important technical resistance for a short-term rebound.
On the contrary, if gold breaks through the $3,350 line, it will be expected to attack the $3,371-3,373 area in the short term, and further look to the key pressure levels of $3,400 and $3,440.
💰Strategy Package
Long Position:3320-3325,SL:3300,Target: 3350