XAU/USD | Gold Below $3345 – Key Demand Awaits at $3282–$3296!By analyzing the gold chart on the 4-hour timeframe, we can see that after dropping to the $3301 area, strong demand came in, helping the price stabilize above $3300 and rally up to over $3334. Currently, gold is trading around $3331. If the price fails to break and hold above $3345 within the next 8 hours, we may see a price correction soon. A key demand zone lies between $3282–$3296, where a strong bullish reaction could occur if price revisits this area. Important supply levels to watch are $3366, $3382, $3393, and $3404.
Please support me with your likes and comments to motivate me to share more analysis with you and share your opinion about the possible trend of this chart with me !
Best Regards , Arman Shaban
XAUUSDK trade ideas

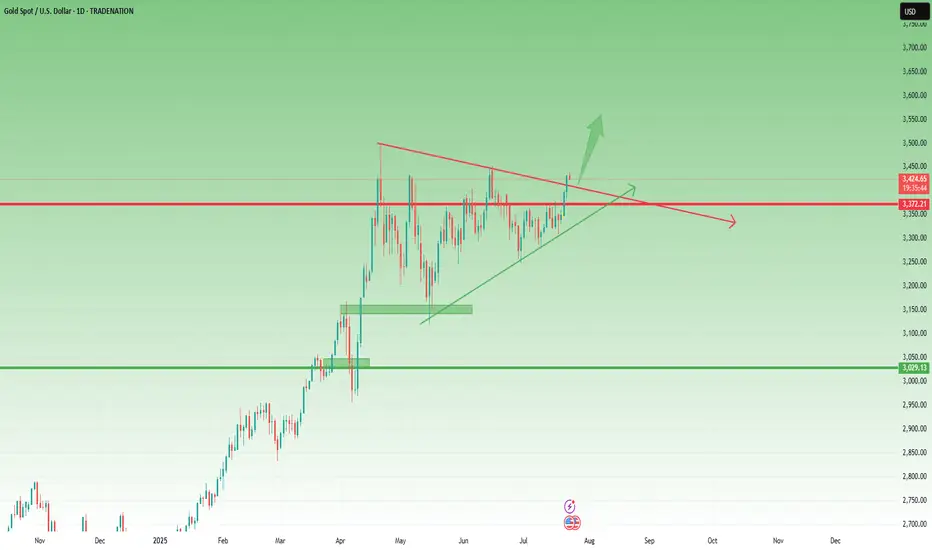
Gold Update – Strong Breaks, Strong BullsYesterday, after the break of the key 3370 resistance, Gold corrected slightly toward 3383, then consolidated briefly in that area. From there, it launched into a strong new leg up, closing the day once more near the highs, around 3430.
📌 What’s important here is that the price did not even come back to retest the broken resistance — now turned support. Combined with the strong daily close near the high of the range, this gives us a clear message:
➡️ Bulls are in full control.
________________________________________
🔍 This Week – Three Key Breaks
So far this week, Gold has delivered three major breakouts:
• ✅ A clean breakout from the box consolidation that kept price stuck and indecisive last week
• ✅ A decisive break above the 3400 psychological figure
• ✅ A breakout above the symmetrical triangle resistance, which had been forming since late April
Each of these is significant on its own. Together, they suggest a shift toward a more aggressive bullish scenario.
________________________________________
🔮 What’s Next?
All these breakouts point to the potential for more gains ahead.
In fact, the next logical step could be an attempt to mark a new All-Time High.
My view remains the same:
Buying dips remains the strategy of choice, with a focus on the 3400 zone as a key support area, and a swing target around 3500.
Disclosure: I am part of TradeNation's Influencer program and receive a monthly fee for using their TradingView charts in my analyses and educational articles.
GOLD REVERSALHello folks, most traders stop out on this idea right? lets get back to previous month opening price, for short idea stoploss above. 3440.
But If you can wait for LONG below. maybe in the next 2 days.
Goodluck. I prefer LONG? I will update once I see volumes on downtrend today or the next day.
I only see short today. the volume is declining/exhausted. I predict reversal atm.
ciao.. see the chart above.
this is not a financial advice.
trade it like its your own business.

GOLD 4H CHART ROUTE MAP UPDATE & TRADING PLAN FOR THE WEEKHey Everyone,
Please see our updated 4h chart levels and targets for the coming week.
We are seeing price play between two weighted levels with a gap above at 3354 and a gap below at 3297. We will need to see ema5 cross and lock on either weighted level to determine the next range.
We will see levels tested side by side until one of the weighted levels break and lock to confirm direction for the next range.
We will keep the above in mind when taking buys from dips. Our updated levels and weighted levels will allow us to track the movement down and then catch bounces up.
We will continue to buy dips using our support levels taking 20 to 40 pips. As stated before each of our level structures give 20 to 40 pip bounces, which is enough for a nice entry and exit. If you back test the levels we shared every week for the past 24 months, you can see how effectively they were used to trade with or against short/mid term swings and trends.
The swing range give bigger bounces then our weighted levels that's the difference between weighted levels and swing ranges.
BULLISH TARGET
3354
EMA5 CROSS AND LOCK ABOVE 3354 WILL OPEN THE FOLLOWING BULLISH TARGETS
3424
EMA5 CROSS AND LOCK ABOVE 3424 WILL OPEN THE FOLLOWING BULLISH TARGET
3499
EMA5 CROSS AND LOCK ABOVE 3499 WILL OPEN THE FOLLOWING BULLISH TARGET
3561
BEARISH TARGETS
3297
EMA5 CROSS AND LOCK BELOW 3297 WILL OPEN THE SWING RANGE
3236
3171
EMA5 CROSS AND LOCK BELOW 3171 WILL OPEN THE SECONDARY SWING RANGE
3089
3001
As always, we will keep you all updated with regular updates throughout the week and how we manage the active ideas and setups. Thank you all for your likes, comments and follows, we really appreciate it!
Mr Gold
GoldViewFX

Gold price continues to decrease, keep the rate unchanged✍️ NOVA hello everyone, Let's comment on gold price next week from 07/28/2025 - 08/1/2025
⭐️GOLDEN INFORMATION:
Gold (XAU/USD) looks set to close the week lower, pressured by upbeat U.S. economic data and progress in trade negotiations, which have reduced demand for safe-haven assets. Despite declining U.S. Treasury yields, the U.S. Dollar regained some ground. At the time of writing, XAU/USD is trading around $3,336, down nearly 1%.
Looking ahead, the Federal Reserve is widely expected to keep interest rates steady at 4.25%–4.50% for the fifth time this year. Recent data supports this stance, with Initial Jobless Claims falling for the fourth straight week—signaling a resilient labor market—while Friday’s sharp drop in Durable Goods Orders, driven by weaker aircraft demand, adds a mixed tone to the outlook.
⭐️Personal comments NOVA:
Gold prices continue to fall as interest rates remain unchanged almost this week. Along with the H4 time frame, prices continue to break important support and continue to follow a downward trend.
🔥 Technically:
Based on the resistance and support areas of the gold price according to the H4 frame, NOVA identifies the important key areas as follows:
Resistance: $3350, $3428
Support: $3312, $3280, $3246
🔥 NOTE:
Note: Nova wishes traders to manage their capital well
- take the number of lots that match your capital
- Takeprofit equal to 4-6% of capital account
- Stoplose equal to 2-3% of capital account
- The winner is the one who sticks with the market the longest

XAU/USD) Bullish trend analysis Read The captionSMC Trading point update
Technical analysis of Gold (XAU/USD) on the 1-hour timeframe. Here's a breakdown of the key trading
---
Technical Overview
Price: $3,428.71 (currently near the upper consolidation)
EMA 200: Around $3,367.38 (well below price, indicating strong uptrend)
Target Point: $3,468.52
Indicators:
RSI (14): 60.19–62.55 → shows moderate bullish momentum, not yet overbought.
---
Key Technical Elements
1. Bullish Breakout Structure:
Price has broken out of a previous range, and is forming a bullish flag or rectangle, which typically leads to continuation higher.
Measured move projection from previous leg (approx. $51.57 gain) targets the $3,468.52 level.
2. Strong Support Zones:
Two yellow zones highlighted:
Upper support level (around $3,415): acting as immediate structure support.
Lower key support (around $3,380): crucial structure level from where the trend initiated.
3. Trend Line Support:
A clearly marked ascending trend line supporting higher lows—indicating bulls are in control.
Expect price to stay above this trend line to maintain bullish bias.
4. Volume & RSI Confirmation:
RSI remains in a bullish zone but isn’t overbought → leaves room for upside.
Volume remains steady, confirming healthy consolidation.
Mr SMC Trading point
---
Conclusion & Trade Idea
Bias: Bullish
Entry Zone: On breakout or retest of minor support ($3,415–$3,420)
Stop Loss: Below trendline or below $3,415
Target: $3,468.52
Confirmation: Hold above trendline + RSI staying above 50
This is a classic bullish continuation setup supported by structure, RSI, and trend momentum. Traders could look for buying opportunities on minor dips or trendline retests.
---
Please support boost 🚀 this analysis)

XAU/USD Powerful Bullish Rally AheadThe XAU/USD 4-hour chart shows a decisive breakout from a symmetrical triangle pattern, signaling a shift towards bullish momentum. Price action has moved strongly above the upper trendline, indicating that buyers are in control. The Ichimoku cloud provides additional confirmation of the uptrend, with price holding well above the cloud zone. Previous resistance areas have been converted into support, and the upward projection suggests potential continuation of the rally. The chart structure reveals consistent higher highs and higher lows, which further supports bullish sentiment. As long as the price remains above the breakout zone and maintains strong volume, the trend is expected to extend upward, reflecting strong market confidence in gold’s short-term growth.
Entry Buy : 3420
First Target :3450
Second Target :3500
If you found this analysis helpful, don’t forget to drop a like and comment . Your support keeps quality ideas flowing—let’s grow and win together! 💪📈

GOLD 1H CHART ROUTE MAP UPDATEHey Everyone,
Great finish to the week with our chart ideas playing out, as analysed.
We completed all our Bullish targets on this chart with ema5 cross and lock confirmation. We were also able to step away today after the final target with no further ema5 cross and lock, confirming the rejection that we are seeing now.
BULLISH TARGET
3356 - DONE
EMA5 CROSS AND LOCK ABOVE 3356 WILL OPEN THE FOLLOWING BULLISH TARGETS
3381 - DONE
EMA5 CROSS AND LOCK ABOVE 3381 WILL OPEN THE FOLLOWING BULLISH TARGET
3404 - DONE
EMA5 CROSS AND LOCK ABOVE 3404 WILL OPEN THE FOLLOWING BULLISH TARGET
3424 - DONE
EMA5 CROSS AND LOCK ABOVE 3424 WILL OPEN THE FOLLOWING BULLISH TARGET
3439 - DONE
We will now come back Sunday with a full multi timeframe analysis to prepare for next week’s setups, including updated views on the higher timeframes, EMA alignments, and structure expectations going forward.
Thanks again for all your likes, comments, and follows.
Wishing you all a fantastic weekend!!
Mr Gold
GoldViewFX

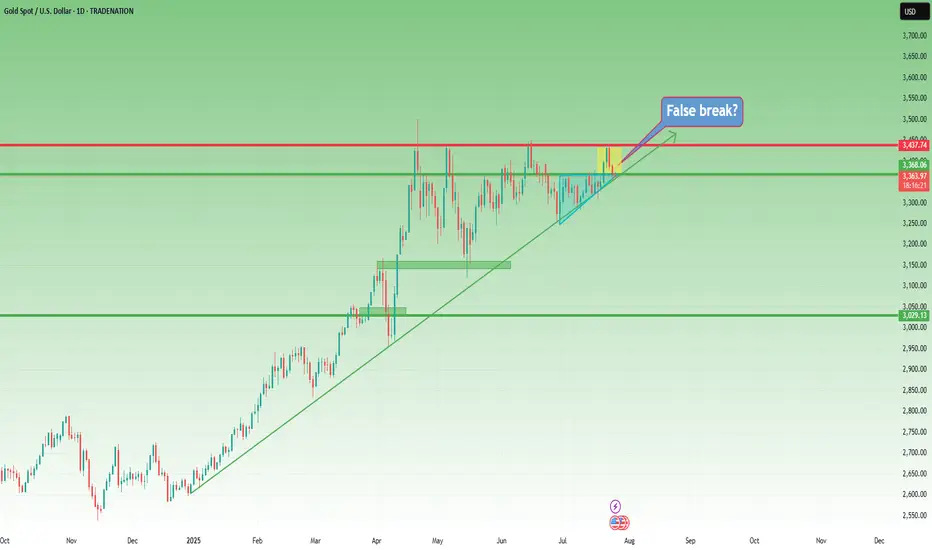
XAUUSD – The Structure Is Still Bullish... But Barely Holding 📌 In yesterday’s analysis, I mentioned that although Gold corrected deeper than expected, dropping below 3400, the bullish structure remained intact — and I stayed true to that view by buying dips.
🎯 The trade didn’t go as planned. Fortunately, the New York rebound from 3350 helped me exit at breakeven.
🧭 So now the big question is:
Is Gold reversing to the downside?
The answer: Not confirmed yet.
The structure is technically still bullish, but the chart is far from pretty.
🧨 What’s going wrong?
❌ Bearish engulfing candle on Wednesday – I chose to ignore it yesterday, but it’s still there.
❌ The breakout above 3375 (ascending triangle resistance) is failing – and could now turn into a false breakout trap.
❌ The ascending trendline from January 2025 is under pressure.
❌ And if today we close near 3350, the weekly chart will show a bearish Pin Bar – not exactly a sign of strength.
📉 My current plan:
- If price rallies back above 3380 → I’m looking to sell into strength, not buy.
- If we break below 3350 → I’ll also look to sell the breakdown.
Right now, for Gold to regain bullish momentum, it needs to reclaim 3400. No compromise.
⚠️ Summary:
Yes, the bigger structure is still bullish.
But momentum is fading, and price action is starting to turn against the bulls.
We need confirmation, not hope.
If 3350 breaks cleanly – things could accelerate to the downside.
Disclosure: I am part of TradeNation's Influencer program and receive a monthly fee for using their TradingView charts in my analyses and educational articles.
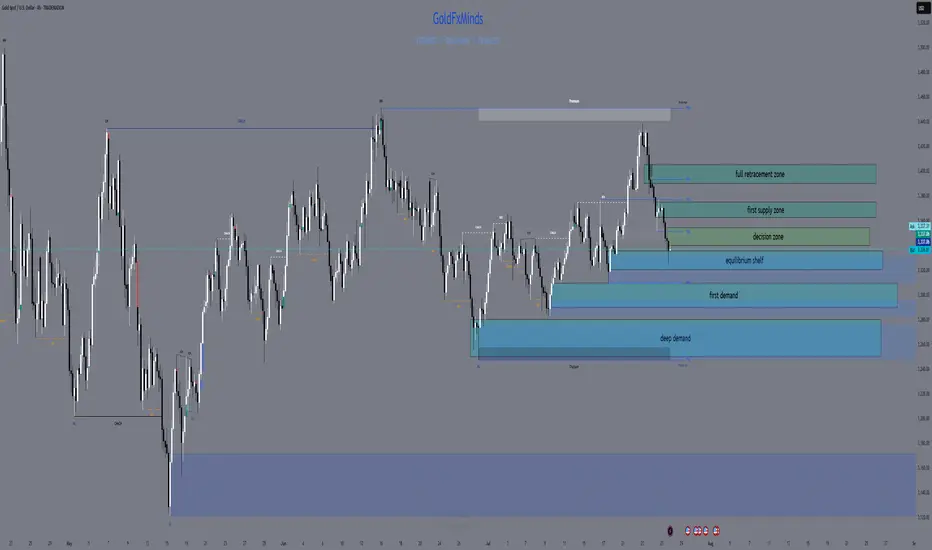
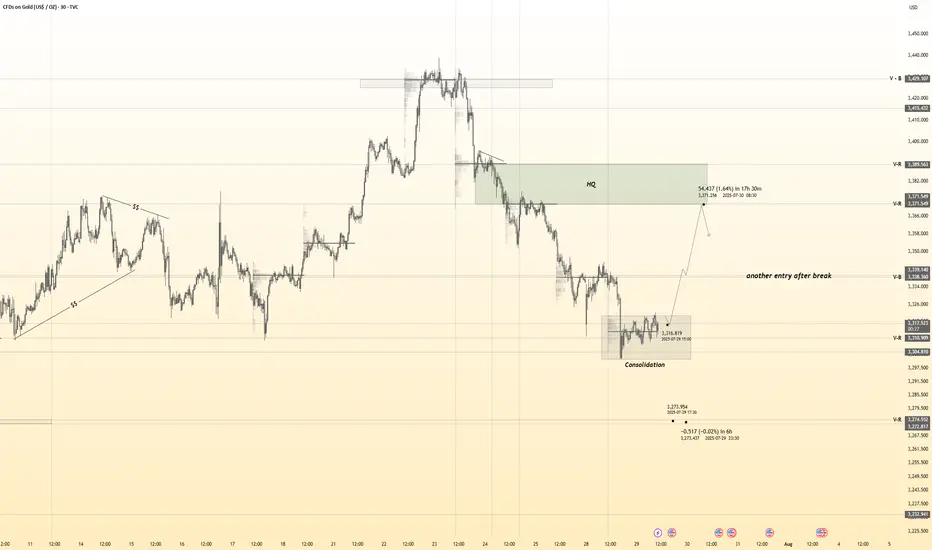
XAUUSD H4 Outlook – “Fed Week: Only the Real Zones”Hello, gold traders!
FOMC week is here, the dollar’s flexing, and gold is stuck under a fortress of supply. No fantasy, no overlaps, just your real, actionable H4 map—zones spaced, logic tight, and all fluff deleted.
⬜Bias:
Neutral to bearish while price is capped under 3,355 and the EMA cluster.
Only flip bullish if price closes and holds above 3,375 with strong confirmation after news.
Current Price: 3,336.81
Summary for your audience:
Neutral–bearish: All the EMAs (21/50/100/200) are overhead, and the primary supply and decision zones are blocking any upside.
No reason to flip bullish unless gold breaks out and holds above both the decision zone and the full supply ceiling after major news.
All bounces into supply are likely to get faded, unless the structure changes dramatically post-FOMC.
🟥 ULTRA SUPPLY ZONE: 3,390 – 3,405
127–161.8% Fib extension—liquidity grab and stop-hunt target for news-driven spikes
Only short if you see a monster upper wick and hard rejection
🟥 PRIMARY SUPPLY: 3,365 – 3,375
All EMAs (21/50/100/200) are stacked overhead; unfilled FVG at 3,370–3,375
Short on a clear rally rejection or bearish engulfing candle—this is where most breakouts get trapped
🔶 DECISION ZONE: 3,340 – 3,355
EMA100/200 straddle this level; small FVG at 3,350–3,352
Market “decides” here—fade unless price closes decisively above 3,355
🔵 EQUILIBRIUM SHELF: 3,320 – 3,335
50% Fib at 3,327; filled FVG at 3,325–3,330; SMA50 just below
Bounce/fake-break zone—wait for a clean H4 reversal, not a guess
🟢 FIRST DEMAND BASE: 3,290 – 3,310
H4 Order Block, hidden FVG (3,300–3,305), Fib 38.2% around 3,295
Longs only with strong pin-bar/engulf and quick EMA50 reclaim
🔵 DEEP PULLBACK BAY: 3,250 – 3,280
Weekly EMA21 and 61.8% Fib (~3,260), strong volume
Only consider a long on a panic flush and a powerful reversal wick
⚡️ MACRO CONTEXT
USD: On fire into ADP and FOMC; gold moves will be explosive, not logical
Events:
Tue: ADP
Wed: FOMC + Powell
Thu: Core PCE
Fri: NFP, ISM
Bias: Neutral-bearish under 3,355; only bullish if we close and hold above 3,375
EMAs: Clustered tightly overhead—bulls get no respect until this ceiling is crushed
🎯 TRADE LOGIC
Shorts:
3,390–3,405 (big wicks and clear rejection only)
3,365–3,375 (news spike or failed breakout with bearish candle)
Longs:
3,340–3,355 (only on a confirmed close above)
3,320–3,335 (strong reversal only—don’t front run)
3,290–3,310 (classic H4 pin-bar/engulf + EMA50 reclaim)
3,250–3,280 (deep panic flush and major reversal only)
NO TRADE: In the gaps—let the gamblers get chewed up, not you.
💬 Which zone will you snipe? Drop a comment and show you’re here for structure, not noise!
👍 Like & Follow for high-value, real-time sniper maps every day.
Disclosure: Chart via Trade Nation’s TradingView feed. Influencer Program participant.
GoldFxMinds 💛
Gold Potential UpsidesHey Traders, in tomorrow's trading session we are monitoring XAUUSD for a buying opportunity around 3,320 zone, Gold is trading in an uptrend and currently is in a correction phase in which it is approaching the trend at 3,320 support and resistance area.
Trade safe, Joe.

GOLD could test 3375 before falling furtherGOLD could test 3375 before falling further
In our previous analysis, we were looking for gold to fall from the top and, as we can see, it has already reached 3341 from the 3430 area.
From the top down, the price depreciated by 2.85% in less than 3 days, so a possible correction is expected near the area of the structure coming from the left side around 3375.
Given that gold is only moving down, it may be possible for the downward movement to continue slowly. Both scenarios are possible at this point.
You may find more details in the chart!
Thank you and Good Luck!
PS: Please support with a like or comment if you find this analysis useful for your trading day

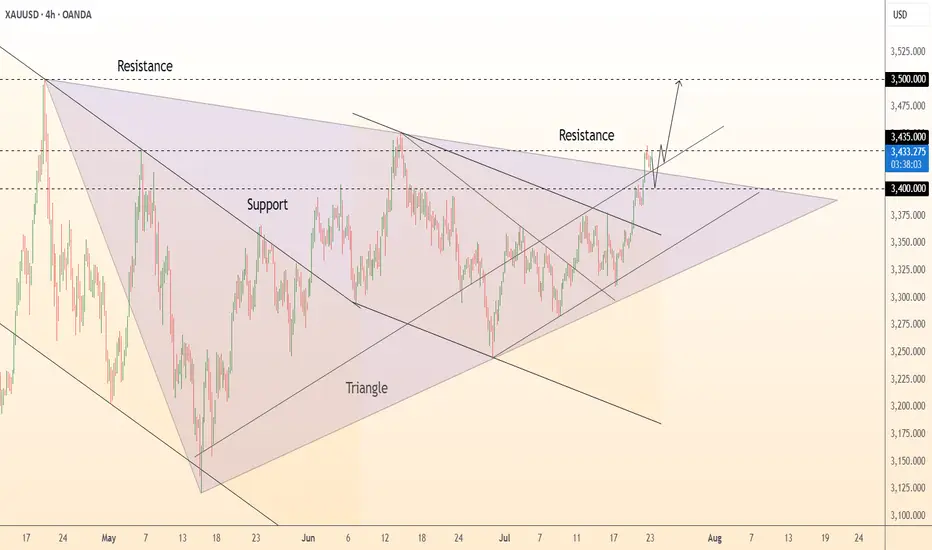
DeGRAM | GOLD exited from the triangle📊 Technical Analysis
● Price has burst above the five-month symmetrical-triangle ceiling at 3 400, converting that line into support; the breakout’s measured move targets the June peak 3 435 and aligns with the rising-channel top near 3 500.
● A tight bull flag is forming on higher-lows inside the new micro up-trend; repeated bids on pull-backs to 3 400-3 405 confirm fresh demand and favour continuation.
💡 Fundamental Analysis
● Gold is buoyed by a softer USD and safe-haven demand as trade frictions grow and Fed guidance turns less certain, keeping XAU/USD firm above $3 400.
✨ Summary
Buy 3 400-3 410; sustained trade over 3 435 eyes 3 500. Bull view void on an H4 close below 3 360.
-------------------
Share your opinion in the comments and support the idea with a like. Thanks for your support!
XAUUSD 30-Min Chart Analysis: Bullish Move Toward Resistance This 30-minute chart of XAUUSD (Gold vs. USD) shows key support and resistance levels. The price is currently around 3,422.615. Resistance is marked at 3,447.337, while the first and second support levels are at 3,412.474 and 3,404.985, respectively. The chart suggests a potential bullish move toward resistance.

GOLD (XAU/USD) 4H Bearish Reversal AnalysisThe chart suggests a clear bearish outlook for Gold (XAU/USD) based on the following key observations:
🔻 Bearish Signals:
Rejection from Resistance Zone: Price faced strong resistance near $3,380 - $3,400, forming a double top pattern before reversing.
Bearish Structure Forming: Price is currently retesting the broken support turned resistance around $3,336, suggesting a possible continuation to the downside.
Ichimoku Cloud Pressure: Price is below the Ichimoku cloud, indicating bearish momentum.
🔽 Expected Bearish Move:
A minor pullback or consolidation near $3,336 - $3,340 could be followed by a drop.
First Support/TP1: $3,310
Second Support/TP2: $3,280
Final Target/TP3: $3,260
⚠️ Invalid if:
Price breaks above $3,380 resistance zone and holds.
Summary: Current 4H structure supports a bearish continuation, targeting the $3,310 → $3,280 → $3,260 levels unless the price reclaims $3,380.

Gold 30Min Engaged ( Bullish After Break Out Entry Detected )———
Time Frame: 30-Minute Warfare
Entry Protocol: Only after volume-verified breakout
🩸Bullish Break - 3339
➗ Hanzo Protocol: Volume-Tiered Entry Authority
➕ Zone Activated: Dynamic market pressure detected.
The level isn’t just price — it’s a memory of where they moved size.
Volume is rising beneath the surface — not noise, but preparation.
🔥 Tactical Note:
We wait for the energy signature — when volume betrays intention.
The trap gets set. The weak follow. We execute.
DeGRAM | GOLD will retest the channel boundary📊 Technical Analysis
● Fresh rejection at the blue resistance line (~3 435) pushed XAU back to the 3 355 mid-band, yet successive higher-lows (green arrows) keep price inside the May-origin rising channel.
● The pullback is probing 3 328-3 355 — confluence of the former flag roof and triangle top; holding this zone should launch another test of 3 400/3 435, with the channel crest targeting 3 500.
💡 Fundamental Analysis
● U-S S&P-Global PMIs softened, nudging 2-yr real yields to three-week lows, while cautious ECB rhetoric limits dollar gains — both supportive for gold.
✨ Summary
Long 3 328-3 355; above that aims 3 400 ➜ 3 435, stretch 3 500. Invalidate on an H4 close below 3 293.
-------------------
Share your opinion in the comments and support the idea with a like. Thanks for your support!

Some investors take profits. Opportunity to buy gold to 3500?✏️ OANDA:XAUUSD price correction of 50 appeared yesterday. This is obvious to happen in a sustainable uptrend. Today's strategy will look for liquidity sweeps to support to BUY to ATH 3500. Gold's current border zone is limited by the upper and lower trendlines. Be careful not to trade against the trend when breaking the trend zone.
📉 Key Levels
Support: 3375 -3363
Resistance: 3418-3431-3490
Buy trigger: Buyers react at 3375
Buy zone: 3363
Target: 3430; level higher at 3490
Leave your comments on the idea. I am happy to read your views.

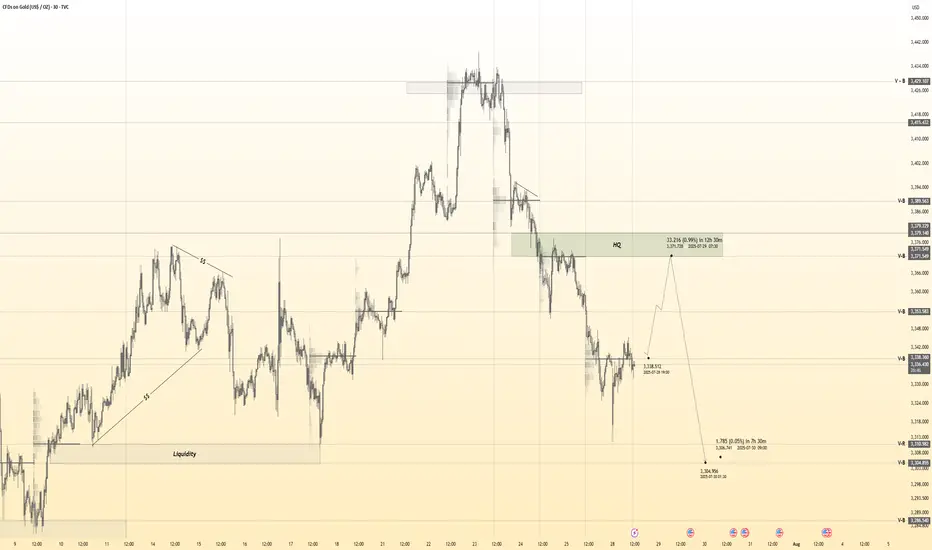
GOLD → Formation of a trading range. 3345?FX:XAUUSD confirms support for the local range. A false breakdown has formed and the price has returned to the buying zone. We are waiting for the bulls to take the initiative...
Gold is trying to recover after falling to $3302, remaining under pressure ahead of key events in the US: the publication of GDP data and the Fed's decision on interest rates. Support is provided by a pause in the dollar's growth, expectations of an extension of the US-China trade truce, and growing demand for safe-haven assets amid a surge in oil prices due to the threat of new sanctions against Russia. However, the sustainability of growth is in question: the dollar may strengthen thanks to optimism about the US economy and progress in negotiations.
A false breakdown of the support range is forming. Focus on 3310-3320. If the bulls keep the price above this zone, gold will have a chance to grow. BUT! If the price starts to contract and stick to 3310, we can expect the decline to continue...
Resistance levels: 3345, 3375
Support levels: 3320, 3310, 3287
The two-day movement has most likely exhausted its potential, or the market has decided to recover slightly due to the unpredictability factor. A false breakdown of support could trigger a pullback to the strong level of 3345, from which a rebound could form (either before growth or before the continuation of the decline; it is necessary to monitor the reaction and the market background...).
Best regards, R. Linda!

Gold 30Min Engaged ( Bullish Reversal Entry Detected )Time Frame: 30-Minute Warfare
Entry Protocol: Only after volume-verified breakout
🩸Bullish Reversal - 3318
➗ Hanzo Protocol: Volume-Tiered Entry Authority
➕ Zone Activated: Dynamic market pressure detected.
The level isn’t just price — it’s a memory of where they moved size.
Volume is rising beneath the surface — not noise, but preparation.
🔥 Tactical Note:
We wait for the energy signature — when volume betrays intention.
The trap gets set. The weak follow. We execute.
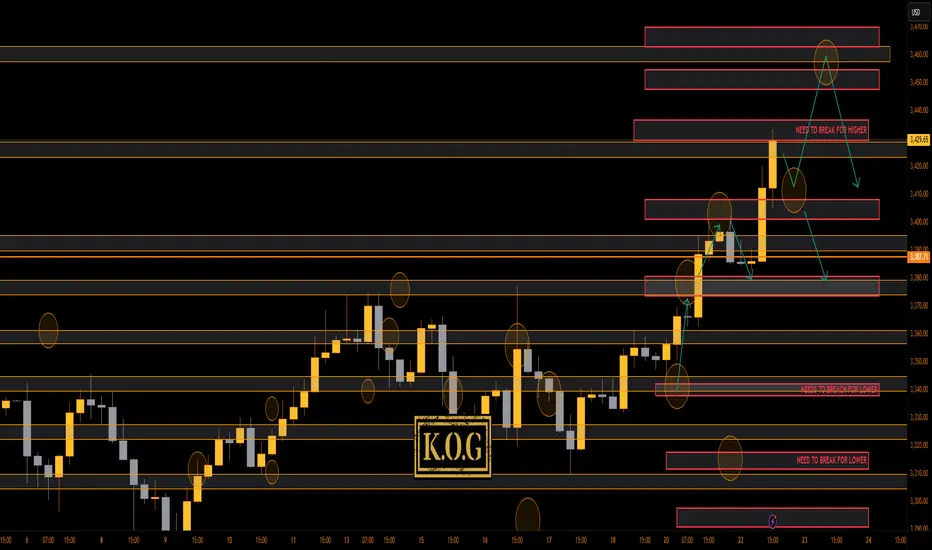
THE KOG REPORT - UpdateA rare day for us today even though we got the level for the short from above, we activated again, and due to everything lining up confirming the short into the lower order region where we wanted to bounce, we took it. Gold, had other plans, engulfing upside resulting in us having to SL the trade. It then went on to break above and complete our daily targets.
You win some, you lose some!
Now, we have support below at the 3410 region which will need to break to change short-term structure, while there is the order region above 3430-35 which could hold price and accumulate. All our bullish targets for the day are completed, we just wanted lower to then go higher.
If lower support can be targeted and held, we could see a move higher into the 3345-50 region before then a reaction in price. I'm still not happy with this move, something doesn't quite look right, so let's play it day by day.
RED BOXES:
Break above 3395 for 3404✅, 3410✅ and 3420✅ in extension of the move
Break below 3375 for 3368 and 3355 in extension of the move
As always, trade safe.
KOG
Japanese Candlestick Cheat Sheet – Part Two- 2 candle patternsTwo-Candle Patterns That Signal Shifts in Sentiment
Single candles whisper…
But two candles talk to each other — and when they do, they often reveal the first signs of a reversal or continuation.
In this second part of the series, we go deeper.
From engulfings to haramis, tweezer tops to piercing lines — these patterns don’t just look good on charts… they capture the psychological tug-of-war between buyers and sellers.
Price doesn’t lie.
And two candles in a row can say: “Something just changed.”
Learn to spot them early. Learn to listen when the chart speaks.
This is Part Two of your practical guide to mastering candlestick formations.
BULLISH KICKER
Bias: Bullish
What is the Bullish Kicker pattern?
The Bullish Kicker forms when a strong bullish candle follows a bearish one with no overlap between the two, indicating a sudden shift in sentiment. This pattern is a powerful indicator of a reversal as buyers take control. The sharp contrast between the bearish and bullish candles reflects a dramatic shift in market psychology, where bears are caught off-guard and forced to cover their positions.
Bullish Kickers are rare but extremely telling, providing a clear signal that sentiment is favoring buyers. Recognizing such decisive patterns can be a game-changer.
Meaning:
Found after downtrends or sell-offs; suggests a sudden shift in sentiment, indicating strong buying interest and potential trend reversal.
BULLISH ENGULFING
Bias: Bullish
What is the Bullish Engulfing pattern?
The Bullish Engulfing pattern occurs when a large bullish candle fully engulfs the previous smaller bearish candle, signaling a potential trend reversal. This pattern highlights a moment when buyers overpower sellers, often marking the beginning of upward momentum. Psychologically, it suggests that buyer confidence is returning, and sellers are losing their grip.
For traders, understanding Bullish Engulfing patterns can provide crucial entry points into emerging trends. Learning to identify and trade such patterns is essential for capturing momentum and new trends.
Meaning:
Typically found in downtrends, this pattern signals a potential bullish reversal as buyers overpower sellers, often indicating a shift toward upward momentum.
BULLISH HARAMI
Bias: Bullish
What is the Bullish Harami pattern?
The Bullish Harami consists of a small bullish candle within a preceding larger bearish one, indicating a pause in downward momentum and hinting at a potential reversal. This pattern shows that sellers are beginning to weaken as buyers cautiously test the waters. The Harami reflects a shift in sentiment from bearish to neutral, often marking a transitional phase in the market.
Interpreting the Bullish Harami helps traders spot moments when sentiment is shifting, potentially signaling the start of a trend change.
Meaning:
Seen in downtrends, it suggests indecision, with possible bullish reversal if the following candles confirm buying strength, indicating a weakening bearish trend.
PIERCING LINE
Bias: Bullish
What is the Piercing Line pattern?
The Piercing Line forms when a bullish candle opens below the previous bearish candle’s low but closes over halfway into it. Found in downtrends, this pattern reflects strong buying pressure as buyers step in at lower prices, creating a potential bullish reversal. The Piercing Line pattern suggests that sentiment may be shifting as buyers gain confidence.
This pattern’s strength lies in its psychological impact, revealing moments when buyers are willing to take risks. Recognizing these signs early can provide valuable insights for traders looking to time entries.
Meaning :
Found in downtrends, this pattern suggests a possible bullish reversal if buying continues, as sellers lose control to buyers.
TWEEZER BOTTOM
Bias: Bullish
What is the Tweezer Bottom pattern?
The Tweezer Bottom pattern is characterized by two consecutive candles with nearly identical lows, one bearish and one bullish. This pattern often signals the end of a downtrend, as the matching lows suggest a strong support level where buyers are stepping in. The Tweezer Bottom highlights market psychology at work, with sellers unable to push prices lower, reflecting renewed buying interest.
Tweezer Bottoms are ideal for traders looking to identify support zones and potential reversal points. By understanding this pattern’s significance, traders can make informed decisions.
Meaning:
Found in downtrends, it signals potential reversal, showing strong support at the matching low, suggesting buyers are stepping in.
BEARISH KICKER
Bias: Bearish
What is the Bearish Kicker pattern?
The Bearish Kicker is the inverse of the Bullish Kicker, forming when a strong bearish candle follows a bullish one without overlap, indicating a sharp sentiment shift. This pattern often marks a sudden reversal, with sellers taking control after an initial bullish period. Psychologically, Bearish Kickers are powerful, signaling that buyers are caught off-guard and losing momentum.
Recognizing Bearish Kickers provides traders with insights into sudden shifts in market dynamics, helping them avoid buying into weakening trends.
Meaning:
Found after uptrends; indicates a sudden sentiment shift, signaling potential trend reversal and intensified selling pressure.
BEARISH ENGULFING
Bias: Bearish
What is the Bearish Engulfing pattern?
The Bearish Engulfing pattern forms when a large bearish candle engulfs the previous smaller bullish candle, suggesting a potential reversal in an uptrend. This pattern signals that sellers have regained control, often marking the start of downward momentum. The Bearish Engulfing reveals a psychological shift, as selling pressure overtakes buying interest.
This pattern is a powerful tool for traders who aim to catch trend reversals, allowing them to align with emerging downward momentum.
Meaning:
Typically found in uptrends, this pattern signals a potential bearish reversal as sellers overpower buyers, often indicating a downward momentum shift.
BEARISH HARAMI
Bias: Bearish
What is the Bearish Harami pattern?
The Bearish Harami consists of a small bearish candle contained within a larger preceding bullish one, reflecting indecision and a potential trend reversal. Found in uptrends, it hints that buyers are losing strength, while sellers are cautiously testing the market. This pattern highlights moments when buyer momentum begins to wane, suggesting caution.
Interpreting the Bearish Harami allows traders to spot potential shifts in sentiment, helping them manage risk and time their exits.
Meaning:
Seen in uptrends, it suggests indecision with a potential bearish reversal if following candles confirm, indicating a weakening bullish trend.
DARK CLOUD COVER
Bias: Bearish
What is the Dark Cloud Cover pattern?
The Dark Cloud Cover appears when a bearish candle opens above the previous bullish candle but closes over halfway into it, reflecting a shift in control from buyers to sellers. This pattern suggests that bullish momentum may be fading, hinting at a potential reversal. Dark Cloud Cover patterns reveal moments when sentiment shifts from optimism to caution.
For traders, understanding this pattern helps them anticipate reversals at the top of uptrends.
Meaning:
Found in uptrends; signals potential bearish reversal if selling continues, as buyers lose control to sellers.
TWEEZER TOP
Bias: Bearish
W hat is the Tweezer Top pattern?
The Tweezer Top is formed by two candles with matching or nearly matching highs, typically one bullish and one bearish. This pattern signals potential resistance, as sellers are consistently pushing back against the same level. The Tweezer Top reflects a moment of seller strength, often marking the end of an uptrend.
Recognizing Tweezer Tops helps traders spot resistance zones and potential reversal points, allowing them to avoid buying into weakening trends or even shorting the asset.
Meaning:
Found in uptrends, it signals potential reversal, showing strong resistance at the matching high, suggesting selling pressure.
🧭 Final Thought
Two-candle formations often appear at key turning points — right where most traders hesitate or get trapped.
Learn to read them not just as patterns, but as conversations between candles — one pushing, the other reacting.
And if this is your first time reading the series, don’t miss Part One – where we covered single-candle signals like dojis, hammers, and marubozus — the very foundations of candlestick reading.
XAUUSD bullish breakout from major supply zone retracement done📊XAUUSD Forecast – 1H Timeframe
Gold has broken out above the major supply zone at 3375, showing strong bullish intent
Price is now pulling back — retracement in progress back to the breakout level for a potential bullish continuation
📍 Key Zone to Watch:
3375 now acting as strong support — waiting for a bullish confirmation candle from this zone
🎯 Next Resistance / Target Levels:
🔹 3399 – minor resistance
🔹 3435 – key supply zone on watch
🧠Waiting patiently for confirmation before re-entering — structure still bullish on the 1H timeframe
What’s your next move on Gold? Drop your thoughts below
👍 Like | 🔔 Follow | 💭 Comment for real-time trade ideas
#xauusd #gold
