GOLD Will Keep Growing!
HI,Traders !
#GOLD keep trading in
An uptrend along the rising support
So as the pair is approaching
A the support we will be
Expecting a bullish rebound !
Comment and subscribe to help us grow !
XAUUSDK trade ideas

XAU/USD – Inverse Head & Shoulders Breakout? Long term plansGold (XAU/USD) has recently formed a classic Inverse Head and Shoulders pattern on the 8H chart, with a breakout now pushing above the neckline (~$3,400). This pattern typically signals a bullish reversal, especially after a prolonged downtrend.
🔹 Pattern Breakdown:
Left Shoulder: Early May
Head: Late May
Right Shoulder: Early July
Neckline Breakout: Now testing above $3,430
🔍 Market Context:
Price is consolidating around key resistance near $3,430–$3,450.
Broader sentiment is supported by safe-haven flows, softening USD, and ongoing macro uncertainty.
Analysts expect upside continuation toward $3,500+ if this breakout holds.
📈 Outlook:
Bullish bias while above $3,365–$3,380 support zone.
Confirmation of the breakout could target $3,500–$3,600 in the short-to-medium term.
🕊️ Watch for: U.S. economic data, Fed tone, geopolitical tensions, and neckline retests.

GOLD ROUTE MAP UPDATEHey Everyone,
Quick follow-up on yesterday’s 1H chart update
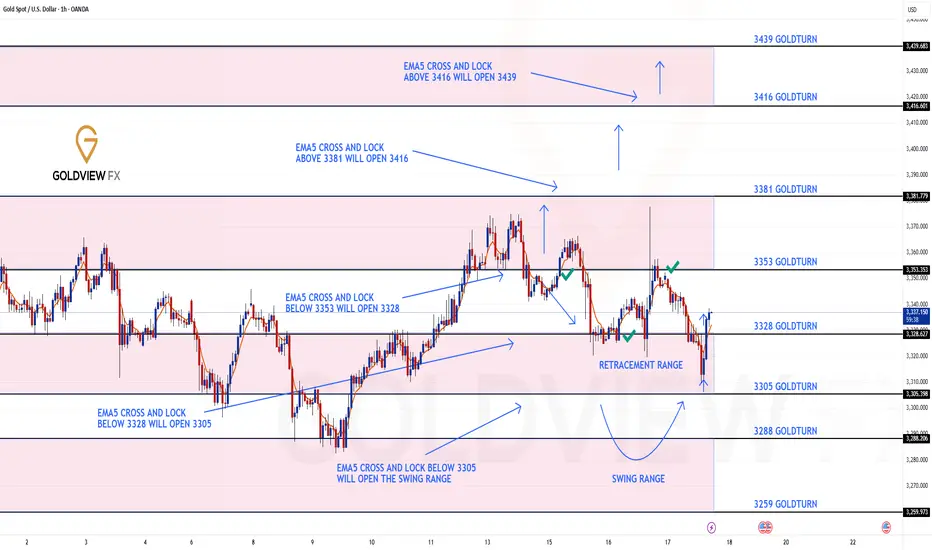
After hitting 3353, we did not see an EMA5 cross and lock above this level. That lack of confirmation was key and it validated a rejection right at 3353, leading to another drop into the retracement zone.
As per plan, that retracement provided yet another clean bounce, perfectly in line with our dip buying strategy.
We are once again looking toward 3353, and just like before, we will be closely watching for an EMA5 cross and lock confirmation to validate any continuation.
This kind of movement continues to confirm the power of patience, structure, and disciplined execution. No chasing just clean planned executions with high probability setups based on our EMA5 methodology.
We’re also still watching the 3381 gap a key magnet above, and a level we’ve been tracking since the Monday outlook. The roadmap remains unchanged. We’re trading the structure, managing risk, and letting confirmations guide the execution.
Updated Reminder of Key Levels:
BULLISH TARGET
3381
EMA5 CROSS & LOCK ABOVE 3381 opens
3416
EMA5 CROSS & LOCK ABOVE 3416 opens
3439
BEARISH TARGETS
3353 ✅ HIT
EMA5 CROSS & LOCK BELOW 3353 opens
3328 ✅ HIT
EMA5 CROSS & LOCK BELOW 3328 opens
3305
EMA5 CROSS & LOCK BELOW 3305 opens Swing Range:
3288
3259
As always, we’ll continue monitoring and sharing updates, as price reacts around these zones. Thank you all for the continued support, your likes, comments, and follows are genuinely appreciated!
Mr Gold
GoldViewFX
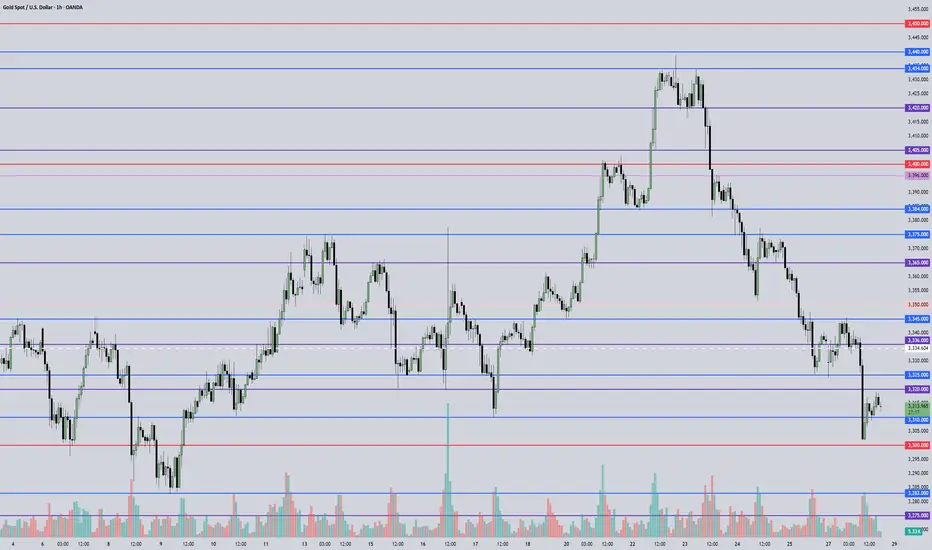
Gold short-term fluctuations downward, first short and then longGold showed a trend of rising and falling. After touching the central axis pressure level, gold fell downward. After breaking the 3320 support level, it accelerated to around 3302. It rebounded at the end of the trading day and reached the highest level of 3318.8 before falling again. The daily line finally closed with a cross Yin line with upper and lower shadows. From the current market, the short-selling trend at the daily level has not changed, and the moving average system is arranged in a short position and diverges downward. After the rebound, it is observed that the price of the hourly chart is still running in the downward channel, so the operation is still mainly based on rebound shorting. Since the daily level is to complete the bottoming or reversal, the short-term moving average must follow up downward, and the current upper pressure level is around 3337 on the daily line, which coincides with the upper pressure level of the hourly chart. In addition, the lower pressure level of 3330 on the four-hour chart also formed suppression here yesterday. The specific operation suggestions are as follows: the support level focuses on the 3285-3280 area, and the pressure level focuses on the 3340-3345 area. Operation strategy: If gold rebounds to 3335-3340, you can enter the market conservatively to short, and set the stop loss at 3347; if it touches 3285-3280, you can go long with a light position, and the rest of the points can be handled flexibly according to the intraday trend.
Operation strategy:
1. If gold rebounds to 3335-3340, you can go short, with a stop loss at 3347 and a target at 3320-3300. If it breaks, continue to hold;
2. If gold pulls back to 3285-3280, you can go long, with a stop loss at 3272 and a target at 3310-3330. If it breaks, continue to hold.

Please check how to trade later.Since the release of the trading strategy, I have been able to accurately predict market trends. I am also grateful to so many brothers for following me. My premium privileges are about to expire. I will put the subsequent trading content in the group. If any brothers are interested, they can find me through 🌐. As for how to deal with the future market, I have stated the extraordinary situation and will patiently wait for the rebound of gold. At the same time, I will pay attention to the impact of the Sino-US trade talks.
European session under pressure 3321 continue to shortI reminded everyone last night that if gold holds the 3300 mark, it will consolidate in the 3300-3345 range in the short term. The current gold price basically fluctuates narrowly between 3320-3310. Judging from the daily chart, the short-term upper pressure is at 3330. Only if the daily line stands firmly above 3330, there is a possibility of a rebound upward in the short term. Judging from the hourly chart, gold is still in a downward trend, and the hourly line is blocked near 3321. In the short term, if it cannot break through 3320-3330, gold will continue to fall. You can consider shorting, with the target at 3310-3300. If the European session is still volatile, maintain high shorts and low longs to participate in the cycle.
My premium privileges are about to expire, and subsequent trading strategies and analysis will be published in the group.

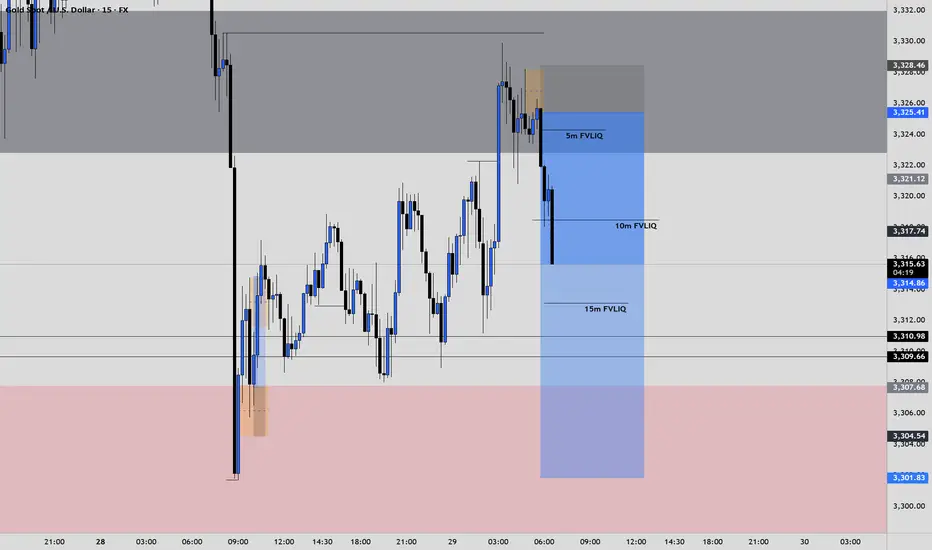
XAUUSD ShortElite Analysis
Noticed price came to structural liquidity
Obtain confirmations to short
Executed from 3m OB
Targeting Lower liquidity pools, main target London low

SHORT | Gold | 4H Chart Direction: Bearish
Moving Average: Blue < Red
Pattern Impulse: Impulse correction
Fib Retracement: 38.2
MACD > 0
1st Target = 3302
2nd Target = 3290
Lots: 0.02
RISK: Economic instability still begs the question around whether commodities continue higher over the coming months.
Trade 1/20

Gold----Sell near 3326, target 3300-3280Gold market analysis:
The recent gold daily line is still weak. It rebounded yesterday and fell again. It has touched the strong support of the weekly line. Today's idea is still bearish. Consider continuing to sell it if it rebounds. It is estimated that it will be repaired if there is support at 3300. The daily line was a cross star yesterday, and the upper shadow line was very long. The daily moving average suppression position was also around 3345, and the suppression position of the pattern was also around 3350. Today, the price is below 3345. We insist on being bearish. This week is a data week. The subsequent trend depends on the release of data. If the data is not strong and the weekly selling signal is added, it is very likely that gold will enter the 3200 era. After the weekly line breaks 3280, it basically opens up the weekly line's downward space, and will start a deep decline in the later period. In the Asian session of gold, we pay attention to the suppression of 3326. This position is the indicator suppression and the small suppression of the pattern. Consider selling it near this position. If it stands above 3326, don't sell it. The repair range will be 3345. Consider selling it at 3345. If the US market cannot break 3300, we should consider whether it will rebound. On the contrary, if it breaks 3300 directly in the Asian market, we should consider selling it directly.
Support 3300 and 3280, suppress 3326 and 3345, and the watershed of strength and weakness in the market is 3326.
Fundamental analysis:
This Monday and Tuesday are relatively quiet, and the big data will be released one by one starting from Wednesday.
Operation suggestion:
Gold----Sell near 3326, target 3300-3280

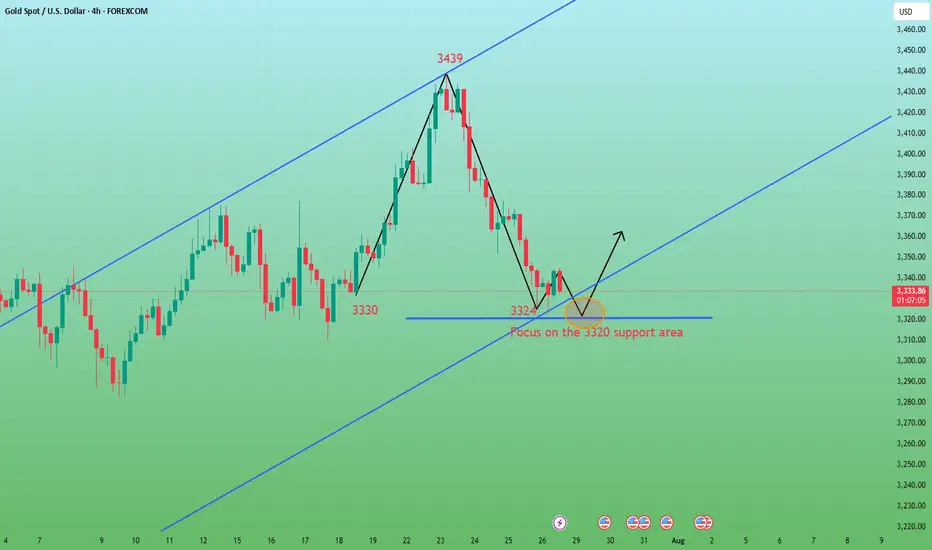
XAUUSD – Technical rebound, but downside risks remainOn the H4 chart, gold is bouncing slightly from the 3,323 support zone after a sharp drop. However, price remains within a large descending channel and is approaching a dense cluster of bearish FVGs around 3,360–3,374.
News context:
– US GDP and ADP data beat expectations, boosting the USD and adding pressure on gold.
– JOLTS dipped but remains above 7 million → limited support for gold.
– Thailand–Cambodia conflict provides only short-term impact.
Strategy: Favor SELL if price retests 3,360–3,374 and gets rejected. Downside targets: 3,323 or lower.
Main trend remains bearish, unless gold breaks above the descending channel.

July 29, 2025 - XAUUSD GOLD Analysis and Potential OpportunitySummary:
The downtrend continues, but a technical rebound is possible today.
Keep a close eye on the 3310 level — if price holds, bulls may fight back and we look for long setups on pullbacks.
If 3310 is broken, the bearish momentum is likely to extend, and we shift to selling on failed rallies. The next significant support lies at 3283.
🔍 Key Levels to Watch:
• 3384 – Resistance
• 3375 – Key resistance
• 3365 – Resistance
• 3345 – Resistance
• 3320–3325 – Key resistance zone
• 3310 – Critical support
• 3300 – Psychological level
• 3283 – Major support
• 3275 – Support
• 3265 – Support
📈 Intraday Strategy:
• SELL if price breaks below 3310 → target 3305, then 3300, 3290, 3283
• BUY if price holds above 3320 → target 3325, then 3336, 3345, 3350
👉 If you find this helpful or traded using this plan, a like would mean a lot and keep me motivated. Thanks for the support!
Disclaimer: This is my personal view, not financial advice. Always use proper risk control.
Analysis and strategy of gold market on July 28:
Core influencing factors
Risk aversion cools down: Despite frequent geopolitical risk events, market panic has not significantly increased, weakening gold safe-haven buying.
US dollar strengthens: US economic data supports the continuous rise of the US dollar, and funds flow back to US dollar assets, suppressing the attractiveness of gold.
ETF holdings outflow: Short-term risk appetite has rebounded, and gold ETFs have seen a slight outflow of funds, reflecting the cautious attitude of the market.
Key events focus:
US-EU and US-China trade negotiations: If progress is optimistic, gold prices may fall to the $3,300/ounce mark.
Federal Reserve resolution: Pay attention to policy independence (affected by Trump's pressure) and interest rate guidance.
Non-farm data: Released on Friday, if the employment data is strong, it may strengthen the US dollar to further suppress gold.
Key technical points
Weekly level:
Watershed $3,325: If it is held, it will maintain high-level fluctuations, and if it is lost, it will open up downward space.
Support area: If the daily support is broken, the weekly support may be tested (reference 3300-3310).
Daily level:
Key support: The current daily support is facing the risk of breaking down, and we need to be alert to the acceleration of short positions.
4-hour level:
Resistance 3388 US dollars (middle track): Before the rebound is not broken, the short-term is short.
Weak signal: The price continues to run below 3363, and the rebound is weak.
Hourly chart:
Strong and weak boundary 3363 US dollars: Maintain weakness before breaking, and avoid bottom-fishing against the trend in the negative market.
Operation strategy suggestions
Short-term direction: Short-selling on rebound is the main, supplemented by light-weight buying at key support levels.
Short-term selling opportunities:
Ideal entry: 3370-3375 area (below the 4-hour middle track), stop loss above 3380.
Target: 3320-3310, if it breaks down, look at 3300.
Opportunities to buy long orders in the short term:
Participate cautiously: If the support of 3320-3310 stabilizes, combine the K-line signal to hold a light long position, and stop loss below 3300.
Quick in and out: You can exit the market when it rebounds to 3340-3350.
Risk warning:
Before the Fed’s decision: Avoid heavy positions, and be wary of unexpected hawkish policies that cause volatility.
Non-agricultural data: If the data exceeds expectations, it will be bearish for gold.
Summary: Gold is short-term technically bearish, but be wary of event-driven reversals. Trading requires strict stop losses and flexible response to data and policy risks.
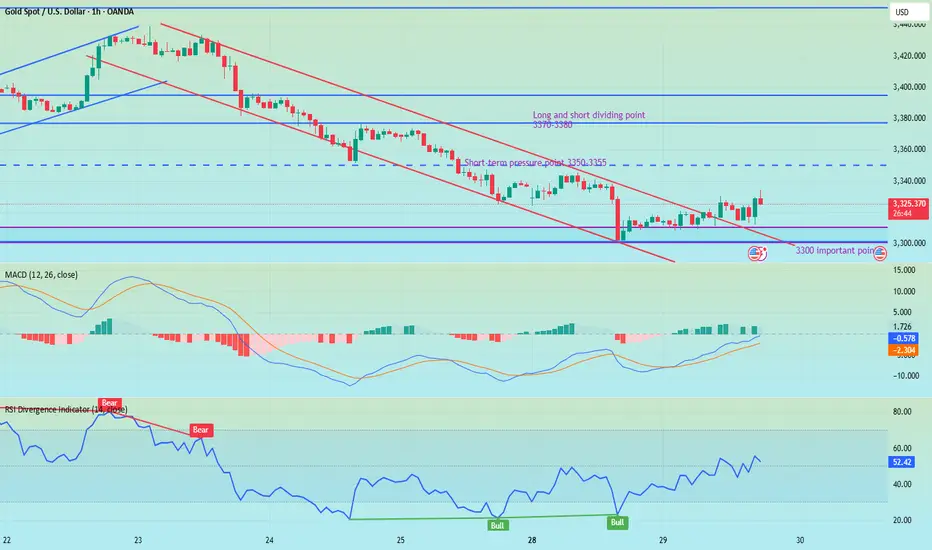
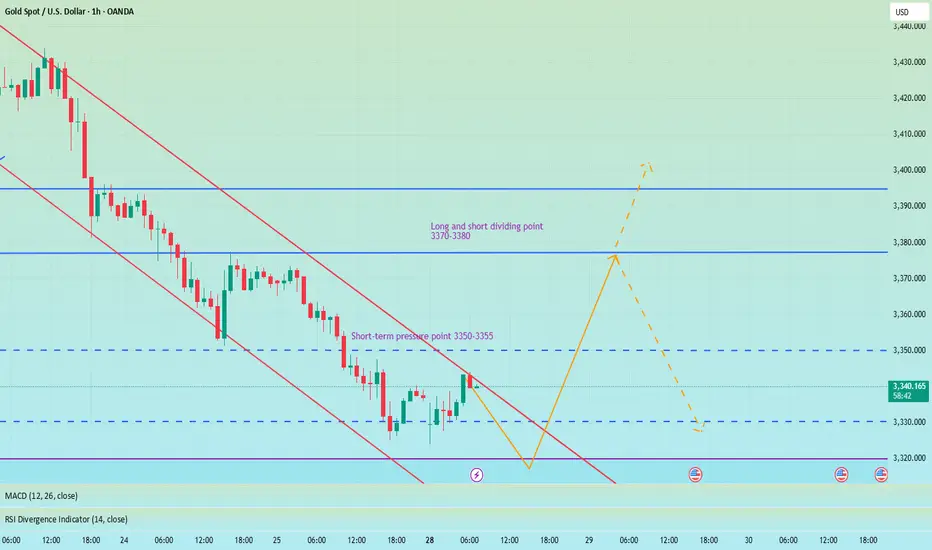
Pay attention to 3350 gains and lossesGood morning, bros. This morning gold again tested last week's low near 3325. From the chart, gold may continue to rise this week, with tariffs approaching, the Fed's interest rate cut, and NFP data imminent. The current strength and weakness are at 3350-3355. If it can effectively break through and stand above, it is expected to continue to test the previous high point, which is also the long-short dividing point of 3370-3380.
From the daily chart, there is not much change in the operational range of gold in the short term, and the change in the 4H chart is more obvious. After the decline in the early trading, it is now rebounding. There is a possibility of closing positive at the low. If it is directly positive on Monday, then it will bottom out directly at the beginning of the week. If it refreshes the low on Monday, the low point of 3285 will be seen below. Therefore, today's market focuses on the continuity of long and short. Of course, according to the current changes, the biggest possibility is to continue to rebound at the low point, pay attention to the support of 3310-3300 below, and pay attention to the gains and losses of the high point of 3355 above.
Gold Buy OfferIn 4H time frame there is a good Demand area in 3309.5-3351 price.
Ofcourse it is a thick one and S/L would be too far. So I prefer to enter the Buy position in the middle it .( some price around 3330 if drops )

basicsmost recent trend in five , exhausted down trends with so much buy side demand and structural sets in OUR most recent play wisely

XAUUSD long day trade idea hello
day trading idea long up to 3372-3383 price zone
fibonaci levels , maybe 3390


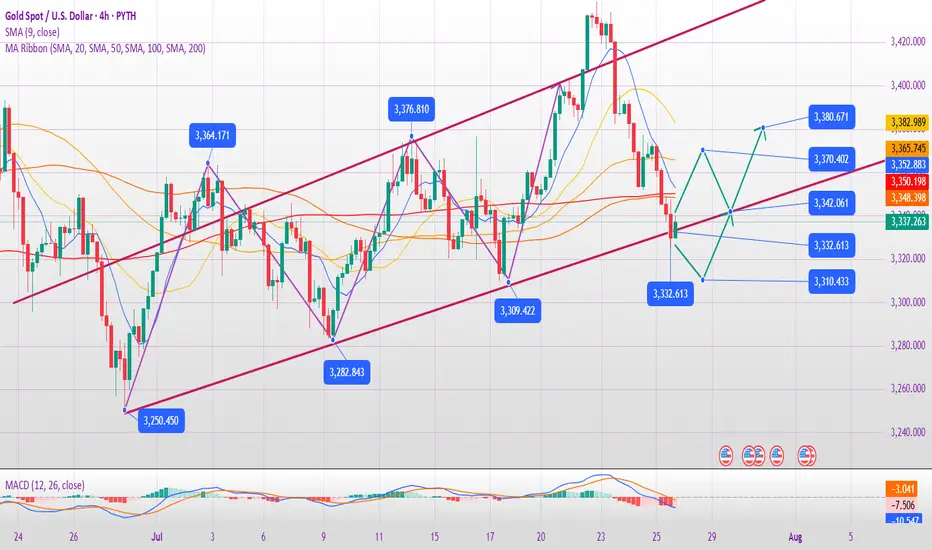
After continuous decline, oversold rebound opportunity.Last week, gold showed a trend of rising and falling. The weekly line closed with an inverted hammer and a long upper shadow, continuing the cross-line pattern of the previous week. The short-term rise was obviously blocked. Although the trend line connecting the daily lows of 3247-3282-3309 has been substantially broken, it may continue to fall after testing and sorting. In the short term, we need to focus on the 3348 suppression level and the 3324 support level. If they fall below, they may fall to the 3300/3285 support area. From the current trend, the overall bearish and lack of rebound momentum, the weak pattern may continue, and only when the price falls to a specific position to complete the bottoming will it attract entry.
Therefore, it is recommended to maintain a bearish mindset. The hourly line shows that the long and short conversions are relatively frequent. The upward trend channel was maintained in the first three days, but all gains were given up in the next two days and the downward channel was rebuilt. Given that both the 4-hour and daily lines have fallen below the key support level, 3348 has become the key point for today's bearishness, and it is necessary to change the mindset in time and go short.
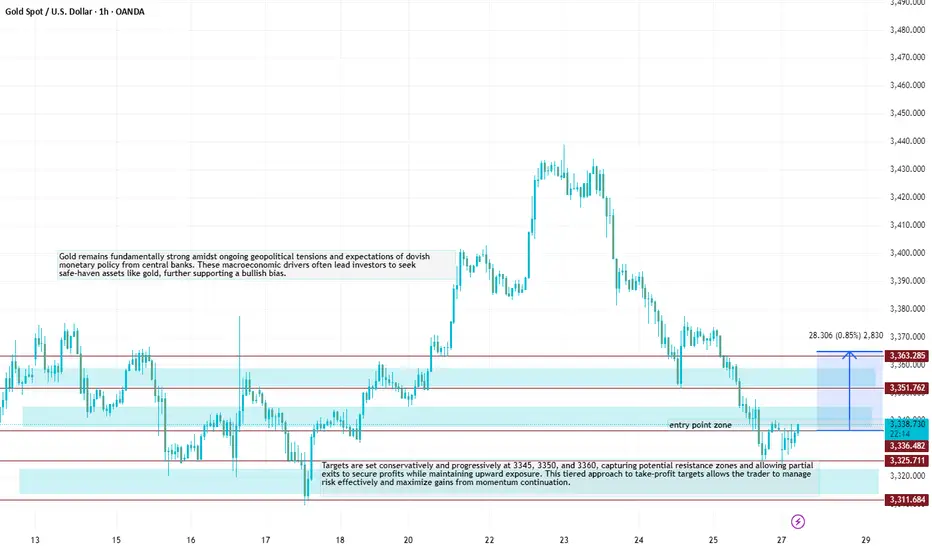
XAUUSDXAU/USD Trade Analysis – buy Setup
📍 Trade Idea: buy Gold (XAU/USD)
Entry Zone: 3338/3336
Stop Loss: 3326..00/Above key resistance zone)
Take Profit Levels:
🎯 TP1: 3345
🎯 TP2: 3350
🎯 TP3: 3360
Targets are set conservatively and progressively at 3345, 3350, and 3360, capturing potential resistance zones and allowing partial exits to secure profits while maintaining upward exposure. This tiered approach to take-profit targets allows the trader to manage risk effectively and maximize gains from momentum continuation.
Gold remains fundamentally strong amidst ongoing geopolitical tensions and expectations of dovish monetary policy from central banks. These macroeconomic drivers often lead investors to seek safe-haven assets like gold, further supporting a bullish bias.
July 28, 2025 - XAUUSD GOLD Analysis and Potential OpportunitySummary:
Price action remains weak after last week's bearish close, with 3440 acting as a clear resistance level. While bulls have lost momentum, bears have not yet taken full control — 3310 and 3283 are key support zones to watch.
Price is currently reacting near 3339,
• Above 3345, the plan is to buy on pullbacks.
• Below 3332, switch to selling rallies.
Expect a potential bounce after the recent sharp decline from 3420 to 3385, but stay cautious near resistance zones like 3385–3400, as consolidation or rejection may occur.
🔍 Key Levels to Watch:
• 3384 – Resistance
• 3375 – Key resistance
• 3365 – Resistance
• 3345 – Intraday key resistance
• 3325 – Intraday key support
• 3310 – Support
• 3300 – Psychological level
• 3283 – Critical support
📈 Intraday Strategy:
• SELL if price breaks below 3332 → target 3325, then 3320, 3310, 3300
• BUY if price holds above 3345 → target 3350, then 3365, 3375, 3384
👉 If you find this helpful or traded using this plan, a like would mean a lot and keep me motivated. Thanks for the support!
Disclaimer: This is my personal view, not financial advice. Always use proper risk control.
Gold Trading Strategy Reference On Monday✅ Gold Market Weekly Summary
Gold prices experienced significant volatility this week and ultimately closed lower on the weekly chart, failing to hold above the key $3400 level. Although the price briefly achieved a bullish breakout earlier in the week, the rally lacked follow-through, indicating weak bullish momentum and growing market indecision from a technical perspective.
✅ Detailed Review
Gold surged by 2.4% in the first two trading days of the week, but gave back nearly 3% over the last three sessions. The reversal was primarily driven by renewed optimism surrounding trade negotiations led by former President Trump, which boosted risk appetite and dampened safe-haven demand for gold.
✅ Outlook for Next Week
Investors will closely monitor the Federal Reserve’s policy meeting scheduled for July 29–30. Market expectations suggest an extremely low probability of a rate cut during this meeting, with the likelihood of holding rates steady in September rising to approximately 40%, up sharply from around 10% a month ago.
✅ If Fed Chair Jerome Powell highlights progress in trade agreements as a reduction in economic uncertainty—thereby leaving the door open for a September rate cut—U.S. Treasury yields may fall sharply, potentially boosting gold prices. Conversely, if Powell cites rising inflation data and avoids signaling any easing at the next meeting, gold may come under renewed pressure.
✅ Technical Analysis
Gold suffered a sharp decline on Friday, breaking below the key 4-hour trendline support at the $3335 level, which we previously identified. This triggered renewed bearish momentum, and the current price action reflects a clear downtrend. Unless a firm bottom is established, the bearish trend is likely to continue.
✅ Hourly Chart Structure
Volatility between bulls and bears was apparent this week. The price followed an ascending channel during the first half of the week but reversed sharply in the latter half, erasing gains and forming a new descending channel. The $3350 level now acts as a critical pivot point and will serve as the key resistance level for bearish strategies next week.
✅ Conclusion
Given that both the 4-hour and daily charts have broken major support levels, the outlook has shifted from a mildly bullish consolidation to a trend-following bearish stance.
✅ Trading Strategy Reference:
🔰 Entry: Consider initiating short positions around the $3350 level
⛔ Stop-Loss: Place stops above $3360
🔰 Targets: Initial target at $3325; if broken, look for further downside toward the $3310 area
🔥Trading Reminder: Trading strategies are time-sensitive, and market conditions can change rapidly. Please adjust your trading plan based on real-time market conditions. If you have any questions or need one-on-one guidance, feel free to contact me🤝

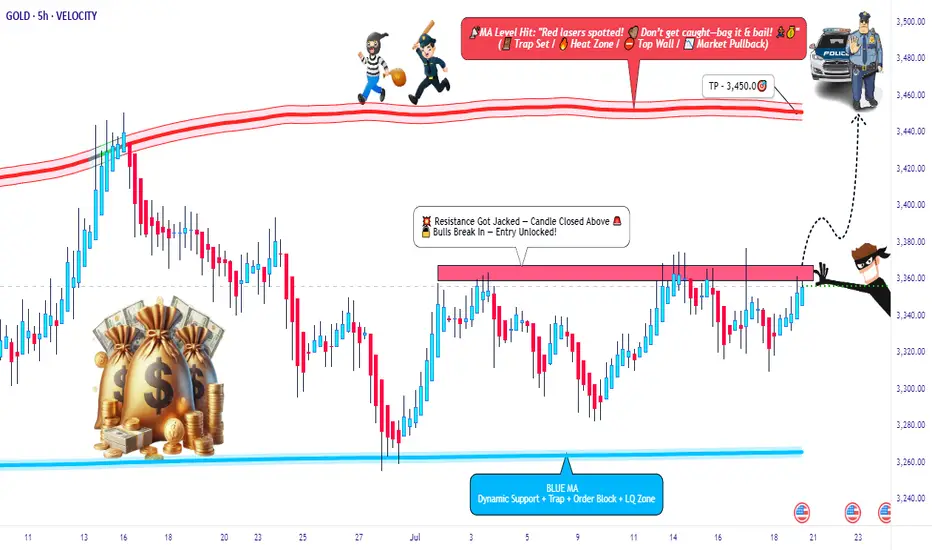
XAU/USD Breakout Playbook – Rob the Market!🚨💰 GOLD HEIST IN MOTION! | XAU/USD Thief Trading Strategy (Breakout Edition) 🏴☠️
🧠 Strategic Mindset | Not Your Average Chart Talk
Yo Market Bandits & Pip Hunters – welcome to the underground playbook!
This isn't your grandma’s chart breakdown – it’s a Thief Trading Takedown on XAU/USD (Gold), where we’re not chasing the market… we’re outsmarting it.
THE MASTER PLAN: Enter Like a Ghost, Exit Like a King 👑
📍 ENTRY POINT – The Break-In Begins!
💥 Breakout Level: Watch for 3370.00 resistance to crack – this is our green light.
🕵️♂️ Entry Style:
• Buy Stop above MA resistance zone (fast & clean)
• OR Buy Limit near swing low zones after confirmation pullback (sniper entry)
🧠 Thief Tip: Wait for the breakout to happen. No orders, no SL before it. Patience is profit.
🔄 Layer the Entry:
• Deploy DCA (Dollar Cost Averaging) or scaling entries with precision
• Build positions like stacking cash bags — smart, silent, and calculated
🛡️ PROTECT THE LOOT – Stop Loss Logic 💣
📍 SL Guide: 3310.00 (4H swing low – update as price structure evolves)
🔥 SL ONLY comes after breakout. Set it too early? That’s how you get caught.
⛔ No pre-breakout orders. No early SL. Stay invisible till it's go time.
🎯 THE ESCAPE – Profit Like a Phantom 🚀
💸 Take Profit: 3450.00
📉 Scalpers: Trail SL as price pushes – never give back stolen pips
🌀 Swing Traders: Monitor resistance layers – don’t let the bulls turn on you
🧭 CONTEXT – Why This Setup?
🔍 Macro Snapshot:
• Trend: Neutral/Bullish Lean
• Influencers: COT reports, geopolitical tension, dollar flows
• Sentiment Shifting – watch the herd, but don’t run with it
🗞️ News Risk: Don’t get wrecked by events! Avoid entries during high-impact news.
🚨 Trailing SL is your best weapon during volatility.
⚡ POWER UP THE CREW – Support the Movement
💬 Drop a comment, hit the 🔥 like button, and share with your trading gang
More Thief Trading blueprints coming soon – bigger breakouts, cleaner setups
⚠️ STAY SHARP, THIEVES!
This ain't financial advice – it’s an outlaw’s edge on the market.
Trade smart. Risk well. Protect the bag.
🏴☠️ XAU/USD GOLD HEIST IN PROGRESS... Join the Movement. Let’s Rob the Market.