Gold fell from a high and may fall back to the rangeGold fell from a high and may fall back to the range
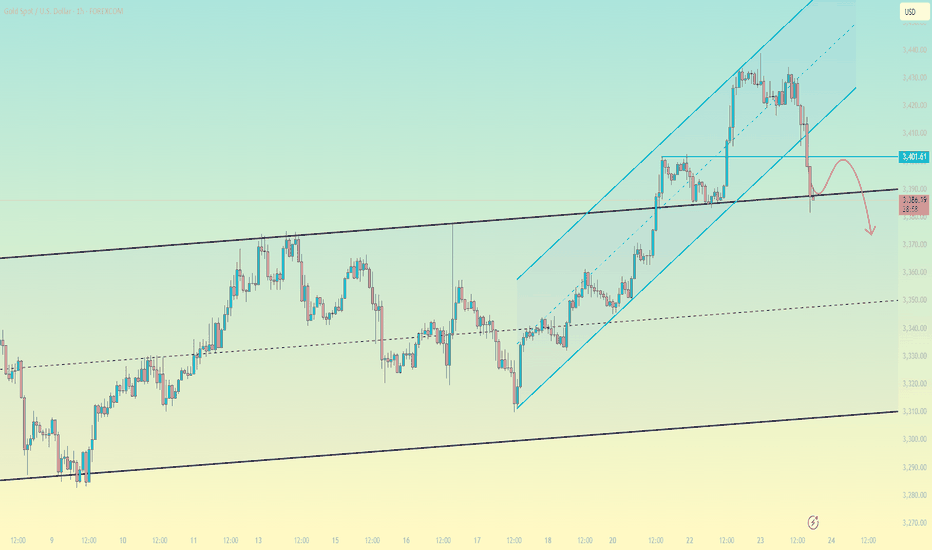
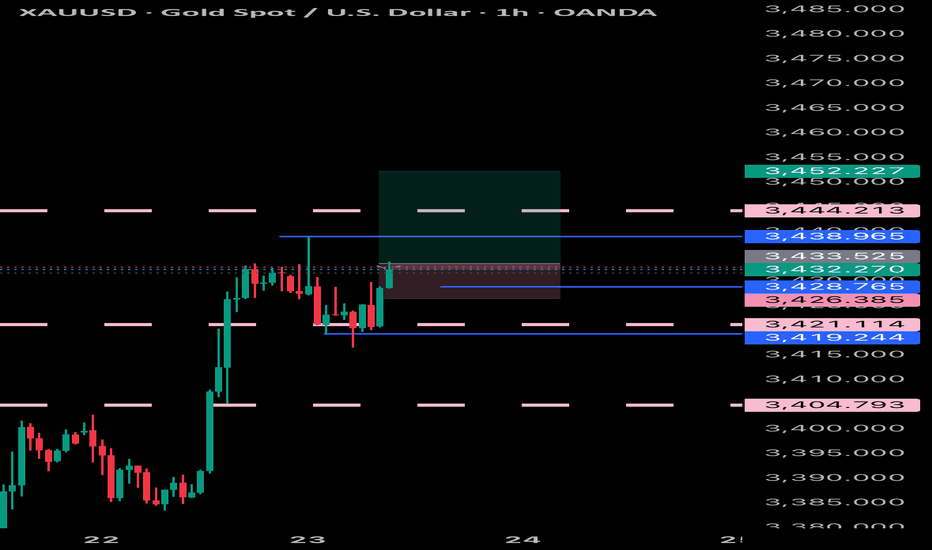
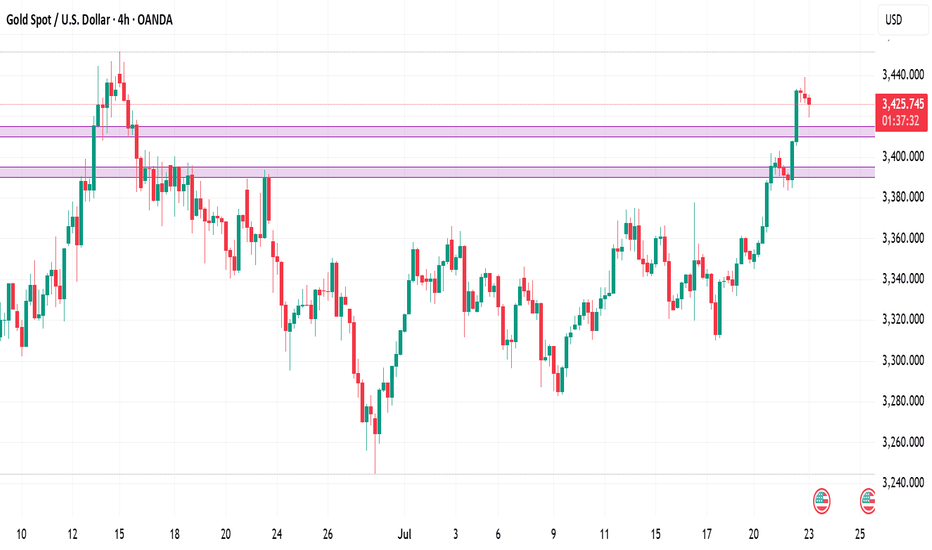
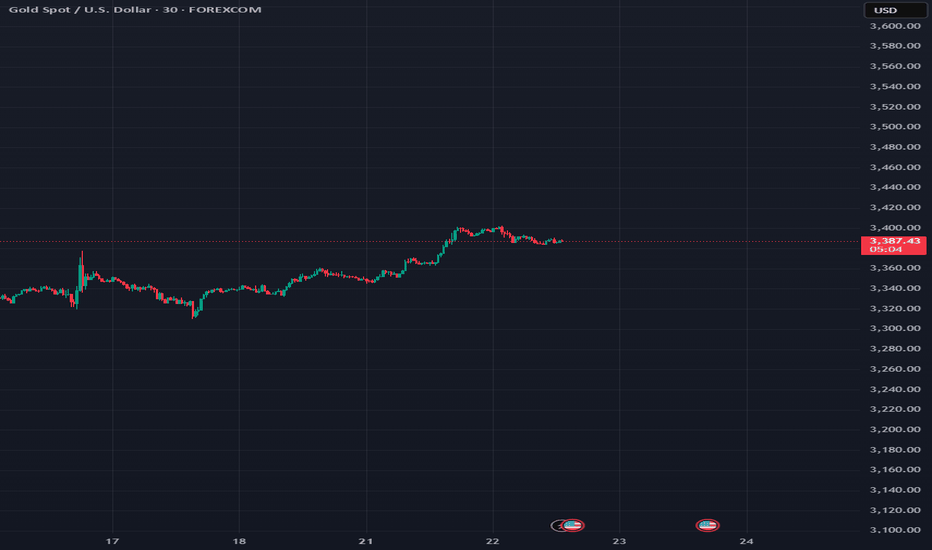
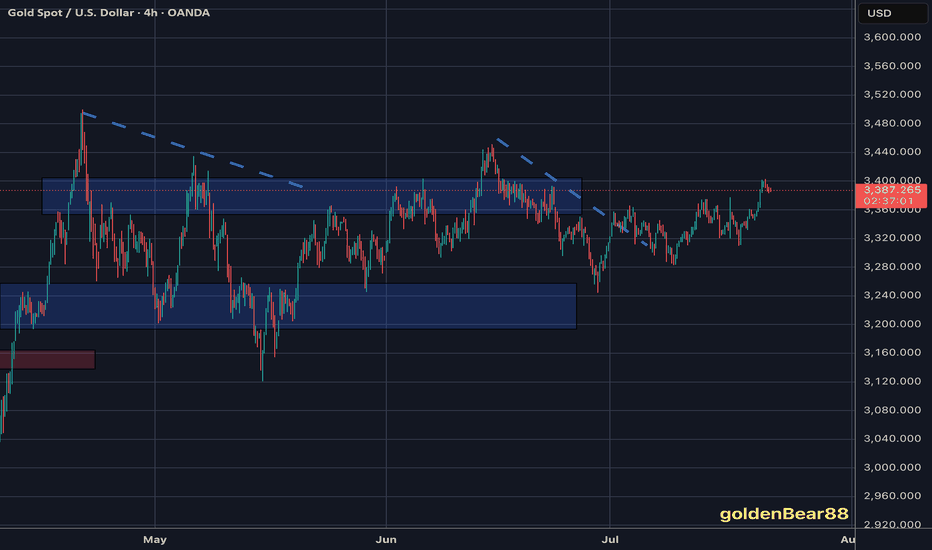
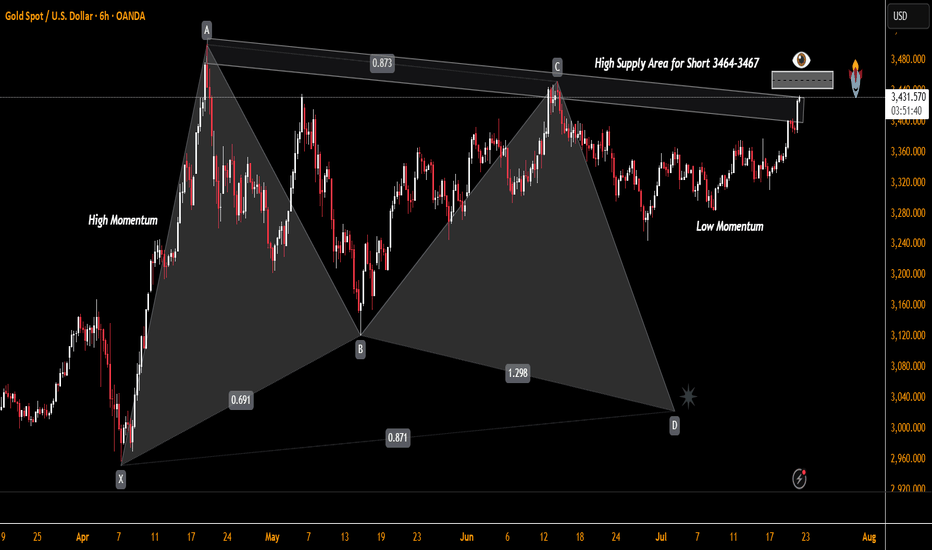
During the U.S. trading session on Wednesday (July 23), spot gold fell from a high and is now trading around $3,390/ounce. Previously, gold prices broke through the $3,400 mark on Tuesday, reaching a high of $3,433.37/ounce during the session, a new high since June 16, and finally closed up 1% at $3,431.59/ounce.
The main factors driving the rise in gold prices include:
Weak U.S. dollar: The U.S. dollar index fell 0.3% to 97.545, a two-week low, providing support for gold.
Trade uncertainty: The market is closely watching the deadline for U.S. tariff negotiations on August 1, and the continued deadlock has increased risk aversion demand.
Lower U.S. Treasury yields: The downward trend in yields weakens the attractiveness of the U.S. dollar, and funds flow to gold.
However, if there is a breakthrough in trade negotiations or the Federal Reserve releases hawkish signals, market risk appetite may rebound and gold prices may face correction pressure. In the short term, gold prices are still dominated by fundamentals, but we need to be alert to the possibility of high-level shock adjustments.
Technical aspect: Overbought signals appear, pay attention to key support and resistance
Daily level:
Strong rise: three consecutive days of positive closing, breaking through the 3400 and 3420 trend line pressure, the Bollinger band opening widens, showing strong bullish momentum.
Overbought risk: RSI and MACD show a top divergence, technical correction needs are enhanced, but market sentiment still dominates the trend.
Key observation points: If it continues to close positive today, the upper target will look at 3450; if it closes negative, it may start a short-term adjustment and test the 3380-3370 support.
4-hour level:
Short-term peak signal: It hit 3438 in the early trading and then fell back. If it falls below the 3405-3400 support, it may further test 3385 or even 3375-3350.
Long-short watershed: If 3400 is held, high-level fluctuations will be maintained; if it is lost, the correction may continue.
Operation strategy: Be cautious about high-level fluctuations
Short-term resistance: 3400-3405 (if the rebound is under pressure, consider shorting)
Short-term support: 3380-3370 (if it stabilizes after a pullback, you can try long with a light position)
Summary: Although gold is still in a bullish trend, the technical overbought and fundamental uncertainty require vigilance against the risk of a high-level correction. It is recommended to rebound high and short as the main, and pull back low and long as the auxiliary, and pay close attention to the gains and losses of the 3400 mark and changes in market sentiment.
XAUUSDK trade ideas
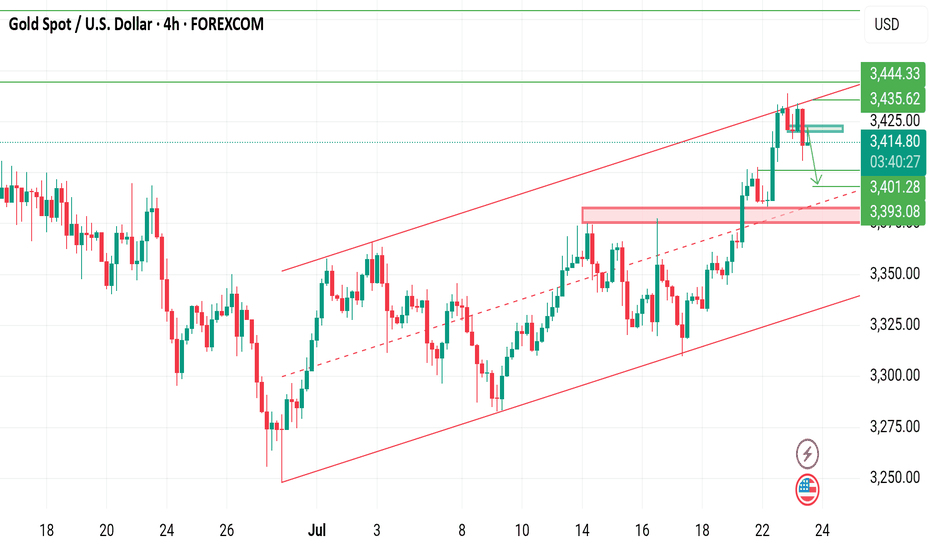
XAUUSD on bearish retest sellGold is currently still holding rising channel along with the swing moves we were on sell throughout from yesterday and my 1st Attempt on sell achieved with 200 PIPs Tp now I'm expecting the again reversal retest move!!
What's possible scanarios we have?
▪️I opened again sell opportunity from 3420-3425 area by following our structural retest strategy, my Selling trade target will be 3405 then 3395 in extension.
▪️if H4 candle closing above 3435 this Parallel moves will be invalid.
#XAUUSD
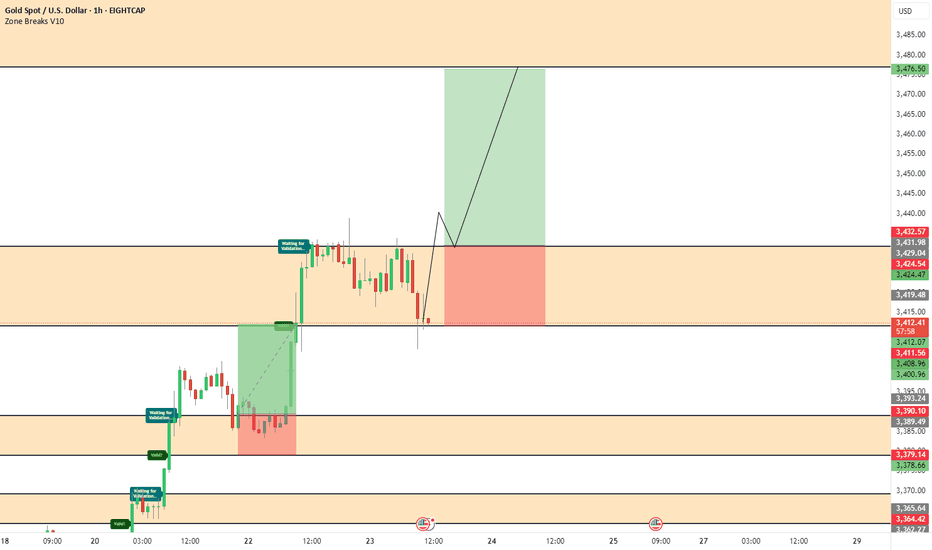
XAU/USD Intraday Plan | Support & Resistance to WatchGold has continued its rally, breaking through the 3,416 resistance and pushing into the next upside zone.
Price is now trading around 3,421, just below the 3,440 resistance cluster.
The structure remains bullish with price holding firmly above both the 50MA and 200MA, which are acting as dynamic support.
A confirmed break and hold above 3,440 would open the path toward 3,458 and potentially the higher‑timeframe target at 3,478 if momentum extends.
If price fails to sustain above 3,416–3,440 and begins to fade, watch the initial pullback toward 3,400.
A deeper move below that would shift focus to 3,383 - 3,362 and then the Pullback Support Zone.
Failure to hold there could expose price to the lower Support Zone if bearish pressure builds.
📌 Key Levels to Watch
Resistance:
‣ 3,440
‣ 3,458
‣ 3,478
Support:
‣ 3,416
‣ 3,400
‣ 3,383
‣ 3,362
‣ 3,336
🔎 Fundamental Focus
⚠️Not much on the calendar today. Still, manage your risk and stay prepared for any unexpected volatility.
XAUUSD KEY LEVELS
GOLD/USD (XAUUSD) – Key Levels and Trading Scenarios (1H Chart)**
🕐Timeframe: 1-Hour
📍 **Current Price**: 3386.78
🔍 Technical Outlook:
Gold recently experienced a strong bullish impulse, breaking out of consolidation and forming a new local high around **3401.72**. Price is now retracing slightly and consolidating near the top. The market structure remains bullish, but a short-term pullback is possible before the next leg up or down.
🟥 Resistance Levels:
* **3401.72 – Key Intraday Resistance**: Previous high. A break and close above this level with strong momentum may trigger bullish continuation.
* **3429.09 – Major Resistance Zone**: If price breaks above 3401.72, the next target will be this higher resistance.
🟩 Support Levels:
373.61 – First Key Support**: If price breaks down from current range, this level may act as the first area of reaction. A clean break below it could signal deeper correction.
3344.76 – Major Support**: Strong historical level and previous consolidation zone. If this level fails to hold, we could see significant bearish pressure.
📈 Bullish Scenario:
* Wait for a clean breakout and retest of 3401.72.
* If price shows bullish momentum with a strong bullish candle after the retest, consider long positions.
* Target: **3429.09**
* Stop loss below **3373.61** for a favorable risk-reward.
---
📉 Bearish Scenario:
* If price breaks below **3373.61**, wait for a bearish retest and confirmation.
* Look for rejection signs and enter short on lower highs.
* Target: **3344.76**
* Stop loss above **3386–3390 zone** depending on entry.
---
⚠️ Key Notes:
* Market is currently in a decision phase: **breakout or reversal**.
* Use confirmation candles before entries.
* Be cautious around **3373–3401** zone as it may act as a chop zone during low volume hours.
---
💬 Let me know your thoughts! Are you bullish or bearish on gold?
🔔 Don’t forget to follow for more gold updates!
\#XAUUSD #Gold #TradingView #PriceAction #Forex #DayTrading #SupportResistance #TechnicalAnalysis
Gold (XAU/USD) 4‑Hour Technical Analysis: July 23, 2025Gold continues to trade in a bullish structure on the 4‑hour timeframe, holding above $3,420 after a steady advance from early July lows. At the time of writing, XAU/USD stands at $3,423.8, confirmed by Investing.com. This analysis employs a comprehensive blend of globally‑recognized technical tools — ranging from price action and classical indicators to institutional concepts — to identify the most probable trading zones and a high‑conviction setup.
Current Price Structure and Trend
On the 4‑hour chart, gold maintains a clear bullish market structure, consistently printing higher highs and higher lows since early July. The current price action unfolds within a well‑defined rising channel, bounded approximately between $3,400 on the lower side and $3,450 on the upper. Twice in the past week, price has tested and respected the channel’s lower boundary, confirming its validity.
Support and resistance levels are evident: immediate support lies at $3,410, coinciding with the 50% Fibonacci retracement of the July impulse wave. Below that, $3,390–$3,395 offers secondary support at the channel’s base and a longer‑term Fibonacci cluster. Resistance is concentrated at $3,445–$3,450, aligning with the channel top, upper Bollinger Band, and prior swing highs, while a secondary ceiling may emerge near $3,468–$3,470, corresponding to an Elliott Wave 3 extension target.
Candlestick, Volume, and Momentum
Recent price action has been supported by bullish candlestick formations. Notably, a strong bullish engulfing bar formed at $3,410 earlier this week, affirming institutional demand at that level. Volume profile analysis shows the heaviest transaction cluster between $3,410–$3,420, confirming this area as a smart money accumulation zone.
Volume‑weighted average price (VWAP ) currently runs near $3,418, with price holding above it, reflecting institutional positioning in favor of the bulls. Momentum indicators support the trend: MACD on the 4‑hour has just crossed bullish, RSI prints at 60 — strong but not overbought — and ADX climbs to 24, indicating a trend strengthening phase.
Indicators, Patterns, and Institutional Concepts
Trend indicators reinforce the bullish view. The 50‑ and 100‑period exponential moving averages converge around $3,415–$3,420, providing dynamic support. Ichimoku analysis shows price well above the Kumo (cloud), with a bullish Tenkan‑Kijun configuration. Bollinger Bands are widening, and price is leaning toward the upper band — a classic signal of volatility expansion in trend direction.
Classical and harmonic patterns offer further evidence. The current consolidation resembles a bull flag, suggesting continuation. Elliott Wave analysis points to a third wave in progress, with an upside projection into the $3,448–$3,468 area. Smart money concepts confirm that the recent break above $3,420 constituted a bullish break of structure (BOS), with price now retracing into a favorable gap (FVG) and a 4‑hour bullish order block anchored around $3,410–$3,415.
Liquidity and stop‑clusters likely sit above $3,445 and $3,468, making these logical targets for bullish campaigns.
Market Context and Sentiment
Gold is benefiting from a softening US dollar and a drop in volatility indexes. Seasonal tendencies also lean bullish into late summer. Sentiment on professional platforms aligns with this view: TradingView top authors and FXStreet analysts favor buying pullbacks into $3,410–$3,415 and targeting $3,450–$3,468, which harmonizes with this analysis. No major divergence from consensus is noted, adding to confidence.
Identified Trading Zones
Two strong buy zones emerge on the 4‑hour chart. The most immediate and highest‑confidence zone is $3,410–$3,415, supported by channel support, Fibonacci retracement, VWAP, moving averages, and an order block. Below this lies a secondary buy zone at $3,390–$3,395, tied to deeper Fibonacci support and the rising channel’s lower boundary.
On the other hand, clear sell zones are defined at $3,445–$3,450, where upper channel resistance, Bollinger bands, and prior highs converge, and a secondary zone at $3,468–$3,470, aligned with wave targets and round‑number psychological resistance. These areas are likely to attract profit‑taking and potential reversals.
The Golden Setup
Among the findings, one trade stands out as the highest‑conviction setup:
A long position at $3,415, with a stop loss at $3,405 and a take profit at $3,450.
This trade is backed by strong confluence: price pulling back into a well‑defined demand zone ($3,410–$3,415) that features order block support, Fibonacci retracement, VWAP alignment, EMA cluster support, and a rising channel boundary. The target sits just below the first significant resistance band ($3,445–$3,450), offering a favorable risk‑to‑reward ratio. The confidence level on this setup is rated at 8/10, given the multi‑method alignment and consistent sentiment from professional sources.
Summary Table
Category Levels / Details
Buy Zones $3,410–$3,415, $3,390–$3,395
Sell Zones $3,445–$3,450, $3,468–$3,470
Golden Setup Long @ $3,415 / SL $3,405 / TP $3,450 (Confidence: 8/10)
In conclusion, gold maintains a constructive technical outlook on the 4‑hour timeframe. The prevailing bullish structure, reinforced by classical and institutional methodologies, supports a continuation toward the $3,450–$3,468 region. The suggested Golden Setup provides a disciplined, high‑probability entry at a key inflection zone, consistent with both technical evidence and prevailing market sentiment.
Report - 22 jully, 2025Institutional Integrity Crisis at the Federal Reserve:
The Treasury Secretary's demand for a full investigation into the Federal Reserve, alongside President Trump’s repeated attacks on Chair Jerome Powell, has severely shaken institutional confidence. Accusations of mismanagement around a $2.5 billion renovation, public comparisons to failed aviation regulators, and Trump’s flirtation with Powell’s removal for "fraud" have undermined the perception of the Fed as an apolitical, data-dependent central bank. These moves are highly destabilizing at a time when inflation remains elevated (2.7% YoY), tariffs are beginning to bite, and rate-cut odds are growing.
Markets have reacted with mixed tones. The bond market is flashing warning signals, with the yield curve steepening modestly as investors reassess Fed independence and pricing power. Equities, by contrast, have so far displayed resilience thanks to solid earnings and rotation into sectors less sensitive to rates (e.g., financials, healthcare).
The DXY has softened as political risk clouds yield-driven strength. The USDJPY continues to flirt with the 149 level, supported by rate differentials but vulnerable to headline risk. Gold (XAUUSD) has reclaimed a bid after dipping to $3,300, as long-end real rates remain uncertain and central bank buying continues globally.
→ If Powell is removed or constrained, expect a sharp repricing lower in the dollar, upward pressure on gold, and a potential equity volatility spike.
Dividend Shift Map: Signals of Sector Confidence & Fragility
Dividend movements are signaling investor positioning under macro stress:
Boosts from GS (+33%), Citi, UNP, JPM, MS, BK, and PPG point to institutional strength in financials, industrials, and infrastructure.
Cuts from MSB (−78.6%), United-Guardian (−28.6%), VOC (−15.4%) show stress in energy trusts, chemicals, and manufacturing niches, reflecting margin compression and spot price weakness.
The divergence reflects both sectoral dispersion and management outlooks on sustained rate pressures. Dividend payers are drawing capital rotation, particularly in value-heavy indexes like the Dow.
UK–EU SAFE Defense Fund Arrangement: Industrial & Fiscal Implications
The UK’s entry into the €150B EU SAFE fund reopens post-Brexit military-industrial cooperation. However, London must pay a portion of EU subsidies used to buy British arms. France is pressing for higher UK contributions, while Germany seeks compromise. Despite potential fiscal friction, UK defense firms (e.g., BAE Systems, QinetiQ) are likely to benefit from expanded procurement markets, which could support hiring and capex.
For UK assets, this is a mild bullish signal: defense sector outperformance, GBP support, and fiscal clarity despite headline noise.
Japan's Taiwan Evacuation Stance: Strategic Retreat in East Asia
Japan’s unofficial warnings to firms that they would be “on their own” in evacuating staff from Taiwan marks a pivotal moment in East Asian FDI risk. The message, privately circulated since 2022, is now widely acknowledged. Japan’s FDI into Taiwan fell 27% YoY, dropping from $1.7B to $452M. Sectors like semiconductors and materials (JSR, Tokyo Electron) are rethinking exposure.
This stance favors India, Vietnam, and Malaysia as alternate chip/tech hubs. It also suggests increasing strategic divergence within the U.S.–Japan alliance over operational military readiness.
USDJPY could strengthen if investors rotate out of JPY as geopolitical fragility grows. The BOJ’s passive stance adds fuel to this view. Longer term, a global Taiwan contingency premium may build across EM Asia FX and tech equities.
AI Infrastructure Stalls: Stargate’s Failure & OpenAI's Workaround
Stargate, the $500B OpenAI–SoftBank AI infrastructure mega-project, has failed to produce a single data center deal, despite grand White House fanfare in January. Key friction centers on land rights, SoftBank’s SB Energy prioritization, and operational delays. The project is now scaled back to a pilot site in Ohio, down from the original 5GW goal for 2025.
Meanwhile, OpenAI has independently signed a $30B/year, 4.5GW infrastructure deal with Oracle—divorcing from Stargate.
Implications:
SoftBank (9984.T): Damaged reputation; lowered tech credibility short term.
Oracle (ORCL): Strong positioning in AI infrastructure. Bullish long-term.
Infra REITs (DLR, EQIX): Likely beneficiaries as private leasing demand accelerates.
Pentagon’s Rare Earths Intervention: Strategic Subsidization
In a seismic intervention, the U.S. Department of Defense has acquired a stake in MP Materials, guaranteeing NdPr purchases at nearly 2x market prices ($110/kg). The $400M commitment and a 10-year price floor represent unprecedented industrial policy in the critical minerals sector. Apple has already pledged $200M to MP’s magnet output.
The backlash among rivals reflects fears of a “China-style” industrial model—subsidized monopolies. Still, the goal is clear: detach U.S. military supply chains from Chinese materials.
MP Materials (MP): Bullish short and medium term.
Other rare earth startups: Bearish unless similar support is extended.
XAUUSD: No direct impact, but this adds to U.S. industrial policy risk premium supporting metals.
Market Risks & Watchpoints
Powell Removal / Fed Discredit: Dollar tailspin risk. Watch 103.00 DXY.
Taiwan Hotspot Premium: Insurance and chip costs to rise. Monitor EMFX reaction.
Stargate Fallout: SoftBank asset markdowns, but Oracle/Altman momentum persists.
Defense & Arms Politics: UK–EU deal fiscal impact mild; industrial upside for UK arms players.
Dividend Map: Useful real-time sector thermometer. Energy/commodities may face next downgrades.
XAU/USD) Bullish trend analysis Read The captionSMC Trading point update
Technical analysis of XAU/USD (Gold) on the 1-hour timeframe. Here’s a breakdown
---
Technical Analysis Summary
Descending Channel Breakout
Price action previously formed a descending wedge/channel, shown by the two black trendlines.
A bullish breakout occurred above the trendline, signaling a shift in momentum from bearish to bullish.
Key Support Zone
The yellow highlighted zone (around $3,338–$3,340) is marked as the “new key support level”.
Price is expected to retest this area (confluence with 200 EMA), which aligns with standard bullish breakout behavior.
The green arrow indicates potential bounce confirmation.
Bullish Projection
After the retest, price is projected to climb steadily toward the target point at $3,394.52.
The setup anticipates around 56.27 points upside, or roughly +1.69% gain from the support zone.
---
Target
$3,394.52 – defined using the previous range breakout height and horizontal resistance.
---
Trade Idea
Entry: On bullish confirmation near $3,338 support zone.
Stop Loss: Just below the yellow zone (e.g., under $3,330).
Take Profit: Near $3,394.
Mr SMC Trading point
---
Conclusion
This is a classic breakout-retest-play, supported by trendline structure, a key horizontal support zone, and RSI strength. As long as price respects the highlighted support, the bullish outlook remains valid.
Please support boost 🚀 this analysis)
Closing all of my orders in ProfitAs discussed throughout my yesterday's session commentary: "My position: I will continue Buying every dip on Gold as stated many times throughout my recent remarks maintaining #3,377.80 and #3,400.80 benchmark as an Medium-term Targets."
I have closed set of Buying orders engaged within #3,360.80 - #3,363.80 Support belt / some on #3,377.80 Resistance and some above. My #3,400.80 Medium-term Target I mentioned many times throughout my remarks was hit successfully.
Technical analysis: Gold continues to Trade under heavy gains and prior to Fundamental expectations, it is important to monitor independently what the result will be, either Gold closing above #3,400.80 benchmark or vital for Sellers / reversal. Each result - except a very surprising spikes all along however sequence will not be DX friendly. Based on my estimations, I do believe that generally Gold will continue with an aggressive Medium-term Bullish values and so called Risk aversion will disappear. When Risk taking is returning to the markets the DX will gain further against all major currencies. From my personal point of view, the best opportunity is to keep Buying Gold on the Long-run and even if I am usually Gold Bear, I cannot Sell Gold at all costs currently with Gold Bullish non-stop since October #2023 Year. I continue Buying Gold on each dip.
Gold 3H Bullish Reversal SetupGold (XAU/USD) 3H Chart Setup:
Price has bounced from a key support zone around 3315, triggering a potential bullish reversal. The target is set near 3360, with a stop loss below the support zone. The projected price path shows possible consolidation before an upward breakout.
Gold Analysis and Trading Strategy | July 29✅ Fundamental Analysis
🔹 U.S. Dollar Index Surges Strongly: On Monday, the U.S. Dollar Index jumped over 1%, closing at 98.6, marking a new short-term high. This rally was primarily driven by the U.S.-EU trade agreement, which reduced tariffs to 15%, easing concerns of a trade war escalation. As a result, risk assets gained appeal, while gold's safe-haven demand was suppressed.
🔹 U.S.-China Talks Resume with Limited Expectations: The U.S. and China resumed trade negotiations in Stockholm, aiming to extend the 90-day tariff truce. However, the U.S. side made it clear that "no major breakthroughs are expected," leaving room for uncertainty, which provides some support for gold.
🔹 Geopolitical Risks Remain Elevated: President Trump has set a 10–12 day deadline regarding the Russia-Ukraine issue, warning of stronger measures if no progress is made. Meanwhile, tensions in the Middle East continue. Any escalation in conflicts could trigger renewed safe-haven buying in gold.
✅ Technical Analysis
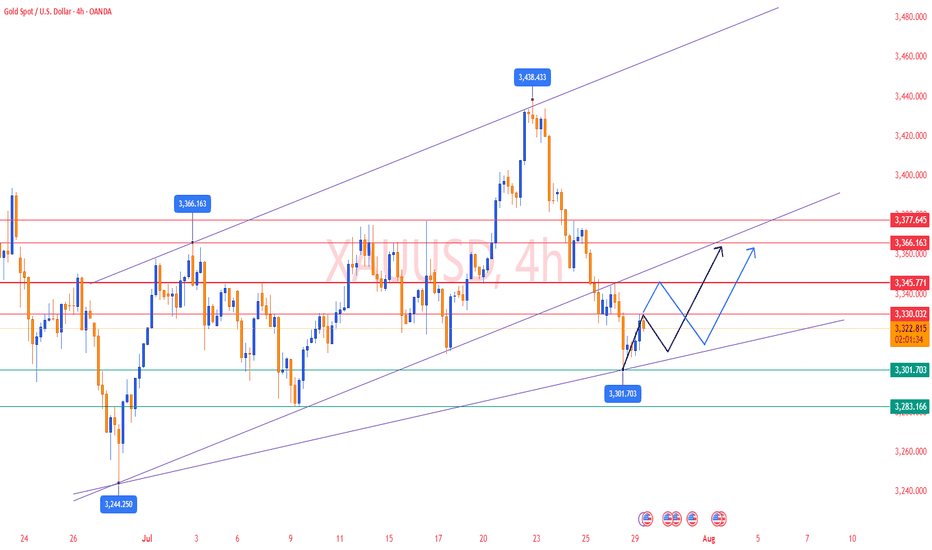
🔸 Gold closed lower again on Monday, marking the fourth consecutive daily loss. The price rebounded to the 3345 level during the day but encountered strong resistance. During the European session, gold broke down swiftly, reaching a low of around 3301, showing a typical one-sided sell-off with strong bearish momentum.
🔸 On the 4-hour chart, gold broke below the key support level at 3320 and continued trading below the MA system. If the price fails to reclaim the 3330–3340 zone, the outlook remains bearish. However, if the European or U.S. session can push the price firmly above 3330, a potential bottom formation could be underway.
🔴 Resistance Levels: 3330 / 3345–3350
🟢 Support Levels: 3300 / 3285–3280
✅ Trading Strategy Reference:
🔻 Short Position Strategy:
🔰Consider entering short positions in batches if gold rebounds to the 3340-3345 area. Target: 3320-3310;If support breaks, the move may extend to 3300.
🔺 Long Position Strategy:
🔰Consider entering long positions in batches if gold pulls back to the 3300-3305 area. Target: 3325-3335;If resistance breaks, the move may extend to 3345.
🔥Trading Reminder: Trading strategies are time-sensitive, and market conditions can change rapidly. Please adjust your trading plan based on real-time market conditions. If you have any questions or need one-on-one guidance, feel free to contact me🤝
XAU/USD 29 July 2025 Intraday AnalysisH4 Analysis:
-> Swing: Bullish.
-> Internal: Bullish.
You will note that price has targeted weak internal high on three separate occasions which has now formed a triple top, this is a bearish reversal pattern and proving this zone is a strong supply level. This is in-line with HTF bearish pullback phase.
Remainder of analysis and bias remains the same as analysis dated 23 April 2025.
Price has now printed a bearish CHoCH according to my analysis yesterday.
Price is now trading within an established internal range.
Intraday Expectation:
Price to trade down to either discount of internal 50% EQ, or H4 demand zone before targeting weak internal high priced at 3,500.200.
Note:
The Federal Reserve’s sustained dovish stance, coupled with ongoing geopolitical uncertainties, is likely to prolong heightened volatility in the gold market. Given this elevated risk environment, traders should exercise caution and recalibrate risk management strategies to navigate potential price fluctuations effectively.
Additionally, gold pricing remains sensitive to broader macroeconomic developments, including policy decisions under President Trump. Shifts in geopolitical strategy and economic directives could further amplify uncertainty, contributing to market repricing dynamics.
H4 Chart:
M15 Analysis:
-> Swing: Bullish.
-> Internal: Bullish.
H4 Timeframe - Price has failed to target weak internal high, therefore, it would not be unrealistic if price printed a bearish iBOS.
The remainder of my analysis shall remain the same as analysis dated 13 June 2025, apart from target price.
As per my analysis dated 22 May 2025 whereby I mentioned price can be seen to be reacting at discount of 50% EQ on H4 timeframe, therefore, it is a viable alternative that price could potentially print a bullish iBOS on M15 timeframe despite internal structure being bearish.
Price has printed a bullish iBOS followed by a bearish CHoCH, which indicates, but does not confirm, bearish pullback phase initiation. I will however continue to monitor, with respect to depth of pullback.
Intraday Expectation:
Price to continue bearish, react at either M15 supply zone, or discount of 50% internal EQ before targeting weak internal high priced at 3,451.375.
Note:
Gold remains highly volatile amid the Federal Reserve's continued dovish stance, persistent and escalating geopolitical uncertainties. Traders should implement robust risk management strategies and remain vigilant, as price swings may become more pronounced in this elevated volatility environment.
Additionally, President Trump’s recent tariff announcements are expected to further amplify market turbulence, potentially triggering sharp price fluctuations and whipsaws.
M15 Chart:
Gold setupGold us just broken to the downside from the previous uptrend and now we expect the prices to continue pushing towards the downside. the prices are likely to reject from the the current order block but if not, they will probably do on the smaller upper order block as you can see via the analysis
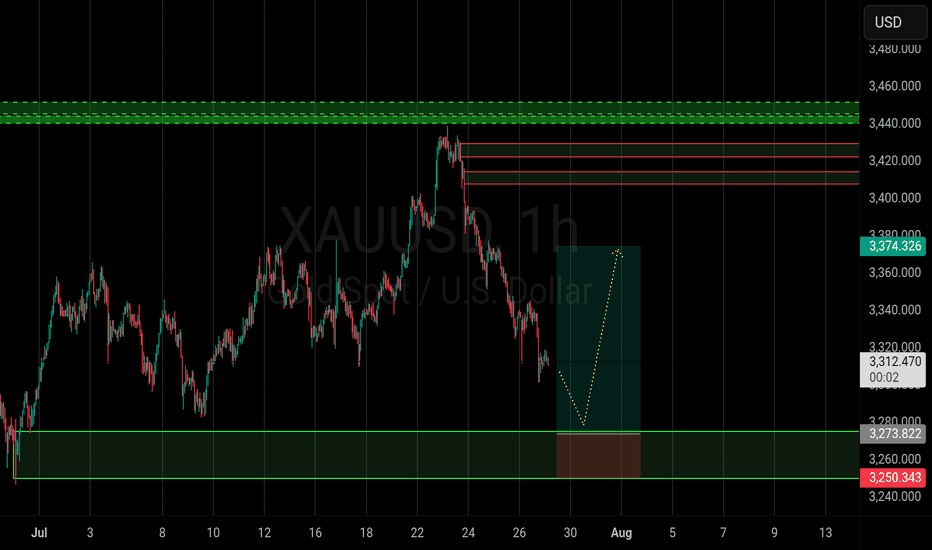
XAUUSD approaches a strong buy zoneGold is approaching a strong buy area. Aggressive traders set pending orders whereas cautious ones wait for some confirmation signals in the range of such zones. I expect buyers to push price back up for atleast half day today Follow risk management to enjoy your trading journey.
Target1 3374
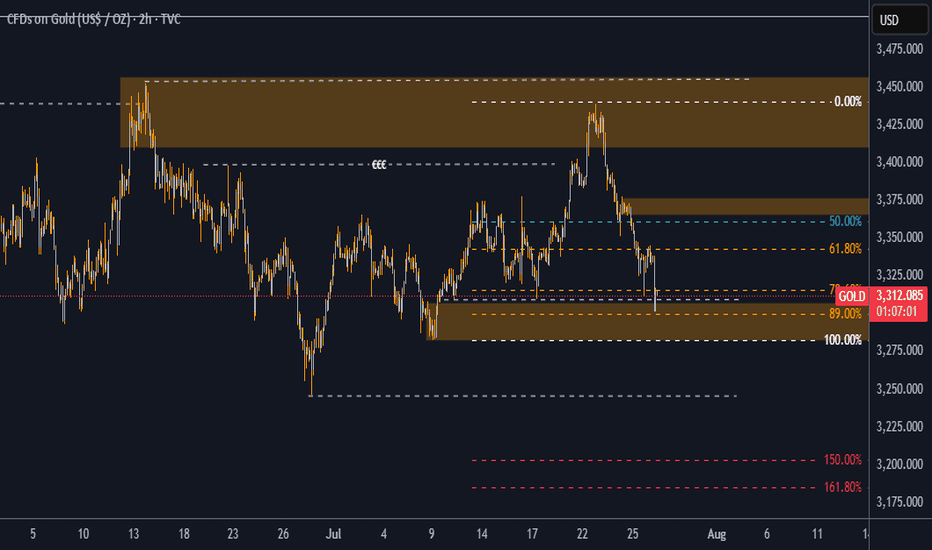
Gold analysis Gold (XAU/USD) Technical Analysis
Date: July 28, 2025
Market Context
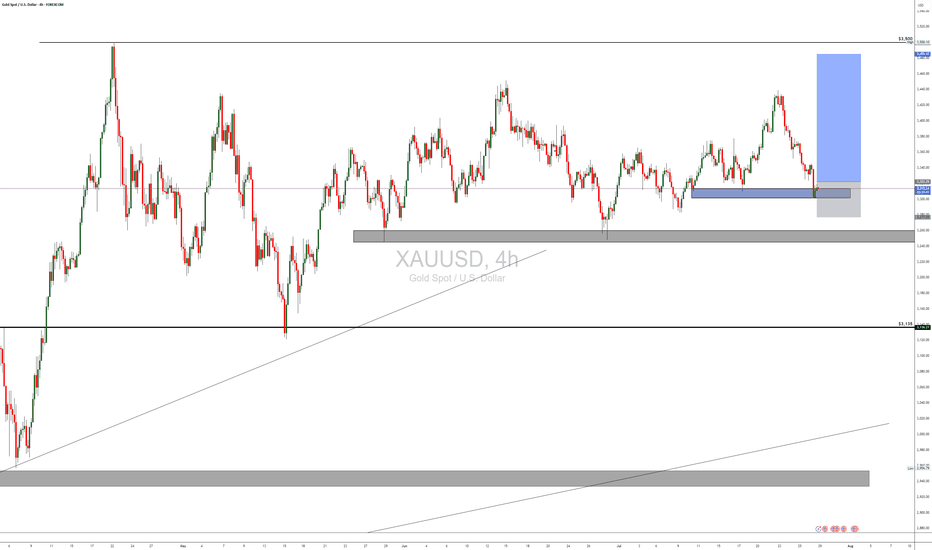
Gold (XAU/USD) is currently trading at $3,313.01, showing a modest gain of +0.32% on the day. From a Smart Money Concepts (SMC) perspective, price action is now positioned at a high-probability demand zone, presenting an attractive opportunity for long positions.
Key Technical Observations
Liquidity Grab at $3,308
Price has recently swept the liquidity resting below $3,308, indicating the possible completion of a stop-hunt move orchestrated by institutional players. This move created an ideal setup for a bullish reversal from a zone where weak longs have been shaken out.
Discounted Price Zone (89% Fibonacci)
The market has retraced deeply into a discounted region, reaching the 89% Fibonacci retracement level of the most recent bullish leg. This zone coincides with a previously identified demand block, enhancing the confluence for potential bullish continuation.
Market Structure & Order Blocks
The current structure shows a bullish intent with price revisiting a bullish order block that previously led to a strong rally. The reaction from this block is key—holding above $3,300 would confirm buyers stepping in with conviction.
Internal Liquidity Void (Imbalance)
A visible inefficiency (price imbalance) exists between $3,345 and $3,398, acting as a magnet for price in the short-to-mid term. This inefficiency aligns perfectly with SMC principles that favor price filling these voids.
Bullish Targets
If price holds and confirms bullish intent from the current zone, we expect a move toward the following key levels:
Target 1: $3,345
This is the midpoint of a previous consolidation range and also lies just above the 50% Fibonacci level.
It also aligns with a minor supply area and could serve as a first TP level.
Target 2: $3,398
This is the upper bound of a key supply zone that previously initiated a strong sell-off.
It coincides with the 0.00% Fib retracement, marking the origin of the most recent bearish leg.
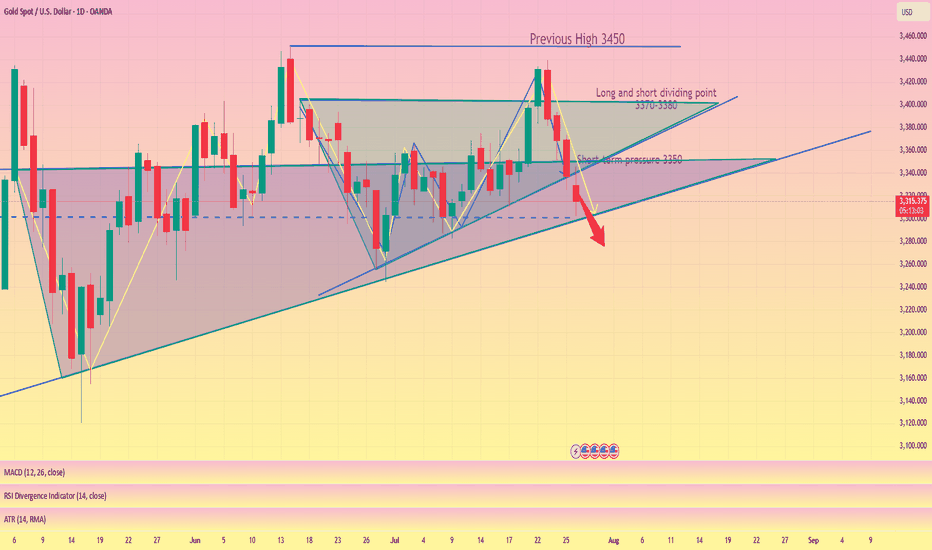
3300 may fall below, possibly setting a new low#XAUUSD
From the daily chart perspective, gold has a tendency to form a converging triangle, and observing the technical indicators of the daily chart, the downward trend may have just begun📉.
So, how should we plan for the evening?📊 Now there are certainly many outside buyers who will continue to increase their positions and try to recover their losses💰. So, should we continue to be long?📈 My opinion is to wait and see.👀 If the daily chart does not fall below 3300 points, it will consolidate between 3300 and 3350 points in the future. If it falls below 3300 points, we will next focus on the support level of 3295-3285 points, and then consider whether to go long🤔.
If you are more aggressive, you can consider going long near 3305 points and exit after earning $10-20. All opinions have been informed and everyone can choose to adopt them according to their own circumstances.😄
